
Part 6 The Acceptance-Sampling INTRODUCTION
PC
Published · 17 slides · 0 views
1 / 1


Description
Part 6 The Acceptance-Sampling INTRODUCTION Acceptance sampling can be performed during inspection of incoming raw materials, components, and assemblies, in various phases of in-process operations, or during final product inspection. It can
Related Topics
Share
Embed code
Download this presentation From Below
"Part 6 The Acceptance-Sampling INTRODUCTION" is the property of its rightful owner. Permission is granted to download and print the materials on this website for personal, non-commercial use only, and to display it on your personal computer provided you do not modify the materials and that you retain all copyright notices contained in the materials. By downloading content from our website, you accept the terms of this agreement.
Presentation Transcript
01
Part 6
The Acceptance-Sampling<br>
02
INTRODUCTION
Acceptance sampling can be performed during inspection of incoming raw materials, components, and assemblies, in various phases of in-process operations, or during final product inspection. It can be used as a form of product inspection between companies and their vendors, between manufacturers and their customers, or between departments or divisions within the same company.
Note that acceptance sampling does not control or improve the quality level of the process. Because of the nature of sampling, acceptance sampling procedures will accept some lots and reject others, even though they are of the same quality. Usually, a sample of the product produced is selected at random to study in detail whether the product conforms to the pre-determined standards or not. A limited percentage of defective products are allowed.
Acceptable Quality Level and Rejectable Quality Level
The technique of acceptance sampling assumes two limiting levels of quality: (i) The Acceptable Quality Level (AQL) i.e. the least number or percentage of defective products that the buyer expects to purchase and the seller expects to sell and (ii) The Lot Percentage Tolerance Defective (LPTD) “or Rejectable Quality Level (RQL)” refers to that limit where the buyer wants to be certain about the rejection of the lot.<br>
Acceptance sampling can be performed during inspection of incoming raw materials, components, and assemblies, in various phases of in-process operations, or during final product inspection. It can be used as a form of product inspection between companies and their vendors, between manufacturers and their customers, or between departments or divisions within the same company.
Note that acceptance sampling does not control or improve the quality level of the process. Because of the nature of sampling, acceptance sampling procedures will accept some lots and reject others, even though they are of the same quality. Usually, a sample of the product produced is selected at random to study in detail whether the product conforms to the pre-determined standards or not. A limited percentage of defective products are allowed.
Acceptable Quality Level and Rejectable Quality Level
The technique of acceptance sampling assumes two limiting levels of quality: (i) The Acceptable Quality Level (AQL) i.e. the least number or percentage of defective products that the buyer expects to purchase and the seller expects to sell and (ii) The Lot Percentage Tolerance Defective (LPTD) “or Rejectable Quality Level (RQL)” refers to that limit where the buyer wants to be certain about the rejection of the lot.<br>
03
PRODUCER AND CONSUMER RISKS
In acceptance sampling, units are randomly chosen from a batch, lot, or process. There are two types of risk inherent in any sampling plan as discussed in the following material:
Producer's Risk: The risk associated with rejecting a "good" lot, due to the inherent nature of random sampling, is defined as a producer's risk. The notion of the quality level of lots that defines acceptable level or "good" product will be influenced by the needs of the customer. Acceptable quality level (AQL) is the terminology used to define this level of quality.
Consumer's Risk: The risk associated with accepting a "poor" lot, due to the inherent nature of random sampling, is defined as a consumer's risk. It is govern the definition of a "poor" lot. Limiting quality level (LQL) or rejectable quality level (RQL) which is the terminology used to defined this level of unacceptable quality. An alternative terminology, when the quality level is expressed in percentage nonconformance, is lot tolerance percent defective (LTPD).
For example, if we state that the producer's risk is 5% for an AQL of 0.02 (2%), it means that we consider batches that are 2% nonconforming to be good and prefer to reject such batches no more than 5% of the time. If the consumer's risk is 10% for an LQL of 0.08 (8%), this means that batches that are 8% nonconforming are poor and we prefer to accept these batches no more than 10% of the time.<br>
In acceptance sampling, units are randomly chosen from a batch, lot, or process. There are two types of risk inherent in any sampling plan as discussed in the following material:
Producer's Risk: The risk associated with rejecting a "good" lot, due to the inherent nature of random sampling, is defined as a producer's risk. The notion of the quality level of lots that defines acceptable level or "good" product will be influenced by the needs of the customer. Acceptable quality level (AQL) is the terminology used to define this level of quality.
Consumer's Risk: The risk associated with accepting a "poor" lot, due to the inherent nature of random sampling, is defined as a consumer's risk. It is govern the definition of a "poor" lot. Limiting quality level (LQL) or rejectable quality level (RQL) which is the terminology used to defined this level of unacceptable quality. An alternative terminology, when the quality level is expressed in percentage nonconformance, is lot tolerance percent defective (LTPD).
For example, if we state that the producer's risk is 5% for an AQL of 0.02 (2%), it means that we consider batches that are 2% nonconforming to be good and prefer to reject such batches no more than 5% of the time. If the consumer's risk is 10% for an LQL of 0.08 (8%), this means that batches that are 8% nonconforming are poor and we prefer to accept these batches no more than 10% of the time.<br>
04
OPERATING CHARACTERISTIC CURVE (O.C)
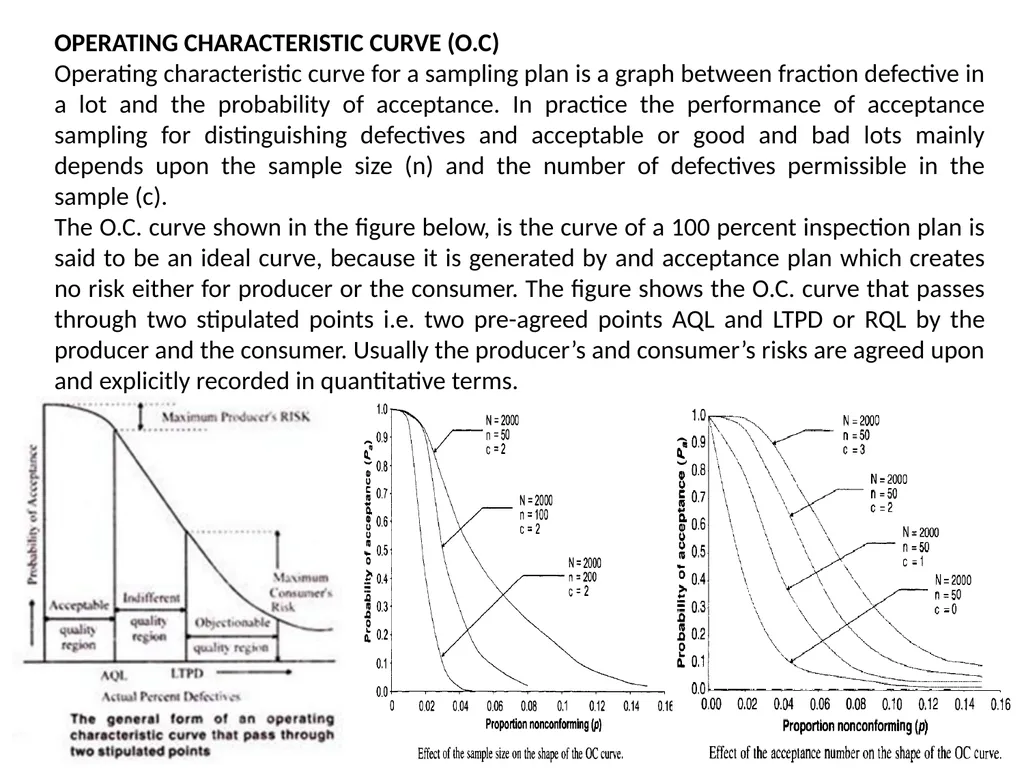
Operating characteristic curve for a sampling plan is a graph between fraction defective in a lot and the probability of acceptance. In practice the performance of acceptance sampling for distinguishing defectives and acceptable or good and bad lots mainly depends upon the sample size (n) and the number of defectives permissible in the sample (c).
The O.C. curve shown in the figure below, is the curve of a 100 percent inspection plan is said to be an ideal curve, because it is generated by and acceptance plan which creates no risk either for producer or the consumer. The figure shows the O.C. curve that passes through two stipulated points i.e. two pre-agreed points AQL and LTPD or RQL by the producer and the consumer. Usually the producer’s and consumer’s risks are agreed upon and explicitly recorded in quantitative terms.<br>
Operating characteristic curve for a sampling plan is a graph between fraction defective in a lot and the probability of acceptance. In practice the performance of acceptance sampling for distinguishing defectives and acceptable or good and bad lots mainly depends upon the sample size (n) and the number of defectives permissible in the sample (c).
The O.C. curve shown in the figure below, is the curve of a 100 percent inspection plan is said to be an ideal curve, because it is generated by and acceptance plan which creates no risk either for producer or the consumer. The figure shows the O.C. curve that passes through two stipulated points i.e. two pre-agreed points AQL and LTPD or RQL by the producer and the consumer. Usually the producer’s and consumer’s risks are agreed upon and explicitly recorded in quantitative terms.<br>
05
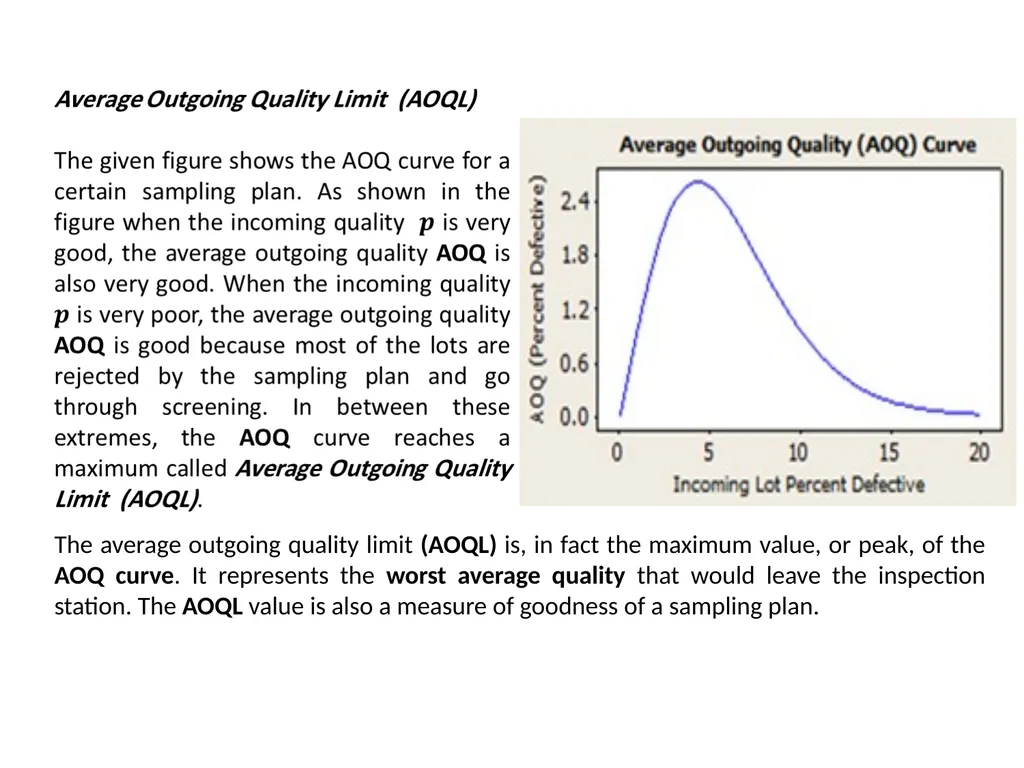
The average outgoing quality limit (AOQL) is, in fact the maximum value, or peak, of the AOQ curve. It represents the worst average quality that would leave the inspection station. The AOQL value is also a measure of goodness of a sampling plan.<br>
06
The Acceptance-Sampling By Minitab Acceptance Sampling by Attributes
Example:
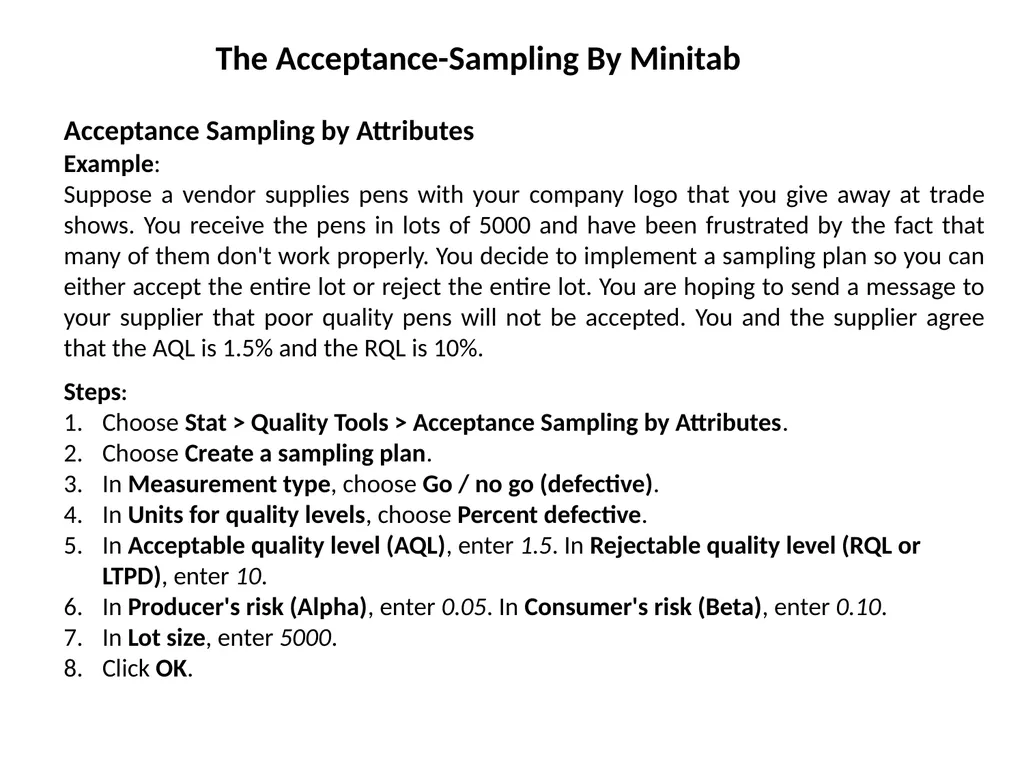
Suppose a vendor supplies pens with your company logo that you give away at trade shows. You receive the pens in lots of 5000 and have been frustrated by the fact that many of them don't work properly. You decide to implement a sampling plan so you can either accept the entire lot or reject the entire lot. You are hoping to send a message to your supplier that poor quality pens will not be accepted. You and the supplier agree that the AQL is 1.5% and the RQL is 10%. Steps:
Choose Stat > Quality Tools > Acceptance Sampling by Attributes.
Choose Create a sampling plan.
In Measurement type, choose Go / no go (defective).
In Units for quality levels, choose Percent defective.
In Acceptable quality level (AQL), enter 1.5. In Rejectable quality level (RQL or LTPD), enter 10.
In Producer's risk (Alpha), enter 0.05. In Consumer's risk (Beta), enter 0.10.
In Lot size, enter 5000.
Click OK.<br>
Example:
Suppose a vendor supplies pens with your company logo that you give away at trade shows. You receive the pens in lots of 5000 and have been frustrated by the fact that many of them don't work properly. You decide to implement a sampling plan so you can either accept the entire lot or reject the entire lot. You are hoping to send a message to your supplier that poor quality pens will not be accepted. You and the supplier agree that the AQL is 1.5% and the RQL is 10%. Steps:
Choose Stat > Quality Tools > Acceptance Sampling by Attributes.
Choose Create a sampling plan.
In Measurement type, choose Go / no go (defective).
In Units for quality levels, choose Percent defective.
In Acceptable quality level (AQL), enter 1.5. In Rejectable quality level (RQL or LTPD), enter 10.
In Producer's risk (Alpha), enter 0.05. In Consumer's risk (Beta), enter 0.10.
In Lot size, enter 5000.
Click OK.<br>
07
Suppose a vendor supplies pens with your company logo that you give away at trade shows. You receive the pens in lots of 5000 and have been frustrated by the fact that many of them don't work properly. You decide to implement a sampling plan so you can either accept the entire lot or reject the entire lot. You are hoping to send a message to your supplier that poor quality pens will not be accepted. You and the supplier agree that the AQL is 1.5% and the RQL is 10%. Steps:
Choose Stat > Quality Tools > Acceptance Sampling by Attributes.
Choose Create a sampling plan.
In Measurement type, choose Go / no go (defective).
In Units for quality levels, choose Percent defective.
In Acceptable quality level (AQL), enter 1.5. In Rejectable quality level (RQL or LTPD), enter 10.
In Producer's risk (Alpha), enter 0.05. In Consumer's risk (Beta), enter 0.10.
In Lot size, enter 5000.
Click OK.<br>
Choose Stat > Quality Tools > Acceptance Sampling by Attributes.
Choose Create a sampling plan.
In Measurement type, choose Go / no go (defective).
In Units for quality levels, choose Percent defective.
In Acceptable quality level (AQL), enter 1.5. In Rejectable quality level (RQL or LTPD), enter 10.
In Producer's risk (Alpha), enter 0.05. In Consumer's risk (Beta), enter 0.10.
In Lot size, enter 5000.
Click OK.<br>
08
Acceptance Sampling by Attributes
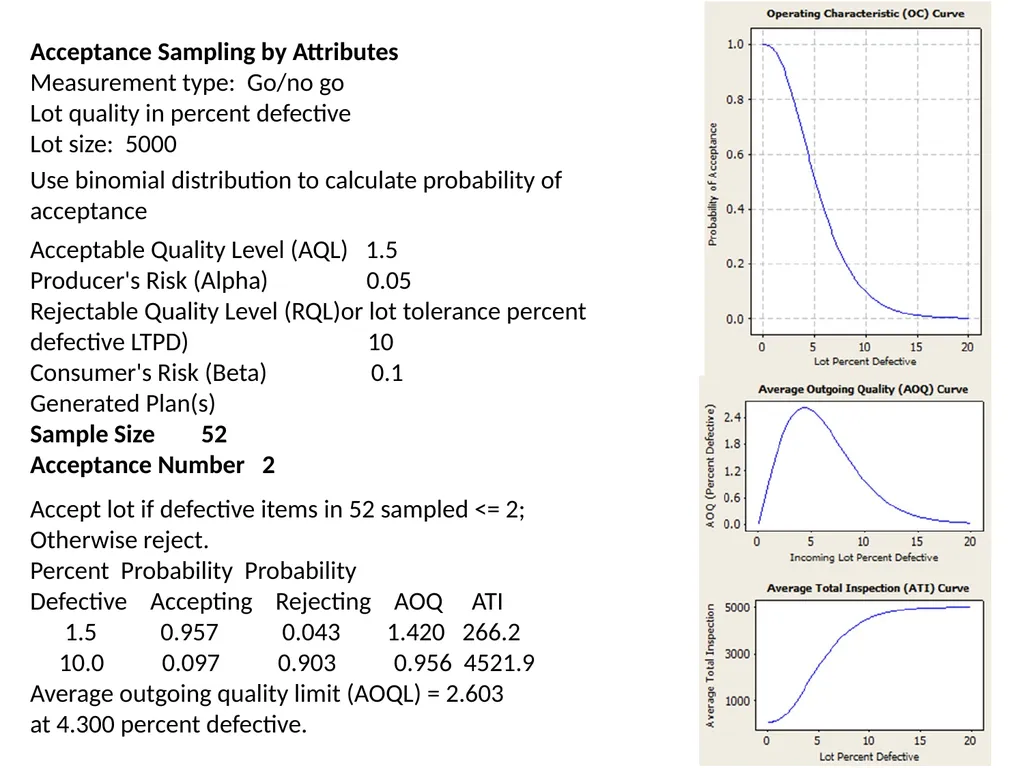
Measurement type: Go/no go
Lot quality in percent defective
Lot size: 5000
Use binomial distribution to calculate probability of acceptance
Acceptable Quality Level (AQL) 1.5
Producer's Risk (Alpha) 0.05
Rejectable Quality Level (RQL)or lot tolerance percent defective LTPD) 10
Consumer's Risk (Beta) 0.1
Generated Plan(s)
Sample Size 52
Acceptance Number 2
Accept lot if defective items in 52 sampled <= 2;
Otherwise reject.
Percent Probability Probability
Defective Accepting Rejecting AOQ ATI
1.5 0.957 0.043 1.420 266.2
10.0 0.097 0.903 0.956 4521.9
Average outgoing quality limit (AOQL) = 2.603
at 4.300 percent defective.<br>
Measurement type: Go/no go
Lot quality in percent defective
Lot size: 5000
Use binomial distribution to calculate probability of acceptance
Acceptable Quality Level (AQL) 1.5
Producer's Risk (Alpha) 0.05
Rejectable Quality Level (RQL)or lot tolerance percent defective LTPD) 10
Consumer's Risk (Beta) 0.1
Generated Plan(s)
Sample Size 52
Acceptance Number 2
Accept lot if defective items in 52 sampled <= 2;
Otherwise reject.
Percent Probability Probability
Defective Accepting Rejecting AOQ ATI
1.5 0.957 0.043 1.420 266.2
10.0 0.097 0.903 0.956 4521.9
Average outgoing quality limit (AOQL) = 2.603
at 4.300 percent defective.<br>
09
Acceptance Sampling by Variables
Example:
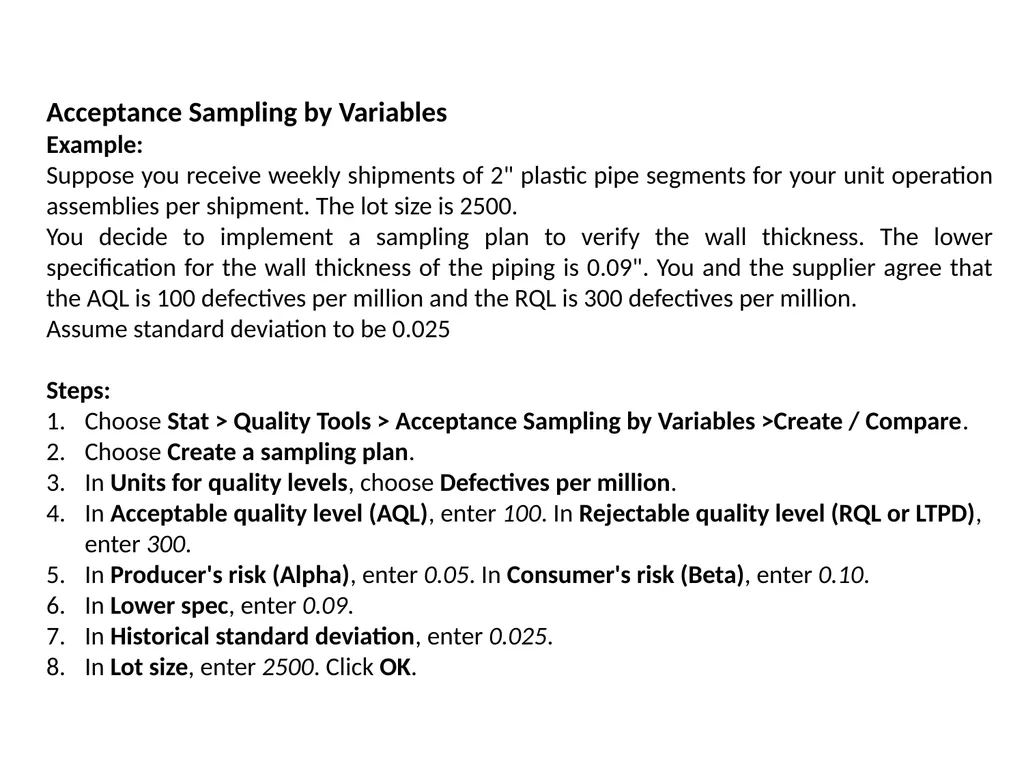
Suppose you receive weekly shipments of 2" plastic pipe segments for your unit operation assemblies per shipment. The lot size is 2500.
You decide to implement a sampling plan to verify the wall thickness. The lower specification for the wall thickness of the piping is 0.09". You and the supplier agree that the AQL is 100 defectives per million and the RQL is 300 defectives per million.
Assume standard deviation to be 0.025
Steps:
Choose Stat > Quality Tools > Acceptance Sampling by Variables >Create / Compare.
Choose Create a sampling plan.
In Units for quality levels, choose Defectives per million.
In Acceptable quality level (AQL), enter 100. In Rejectable quality level (RQL or LTPD), enter 300.
In Producer's risk (Alpha), enter 0.05. In Consumer's risk (Beta), enter 0.10.
In Lower spec, enter 0.09.
In Historical standard deviation, enter 0.025.
In Lot size, enter 2500. Click OK.<br>
Example:
Suppose you receive weekly shipments of 2" plastic pipe segments for your unit operation assemblies per shipment. The lot size is 2500.
You decide to implement a sampling plan to verify the wall thickness. The lower specification for the wall thickness of the piping is 0.09". You and the supplier agree that the AQL is 100 defectives per million and the RQL is 300 defectives per million.
Assume standard deviation to be 0.025
Steps:
Choose Stat > Quality Tools > Acceptance Sampling by Variables >Create / Compare.
Choose Create a sampling plan.
In Units for quality levels, choose Defectives per million.
In Acceptable quality level (AQL), enter 100. In Rejectable quality level (RQL or LTPD), enter 300.
In Producer's risk (Alpha), enter 0.05. In Consumer's risk (Beta), enter 0.10.
In Lower spec, enter 0.09.
In Historical standard deviation, enter 0.025.
In Lot size, enter 2500. Click OK.<br>
10
Suppose you receive weekly shipments of 2" plastic pipe segments for your unit operation assemblies per shipment. The lot size is 2500.
You decide to implement a sampling plan to verify the wall thickness. The lower specification for the wall thickness of the piping is 0.09". You and the supplier agree that the AQL is 100 defectives per million and the RQL is 300 defectives per million
Assume standard deviation to be 0.025 Steps:
Choose Stat > Quality Tools > Acceptance Sampling by Variables >Create / Compare.
Choose Create a sampling plan.
In Units for quality levels, choose Defectives per million.
In Acceptable quality level (AQL), enter 100. In Rejectable quality level (RQL or LTPD), enter 300.
In Producer's risk (Alpha), enter 0.05. In Consumer's risk (Beta), enter 0.10.
In Lower spec, enter 0.09.
In Historical standard deviation, enter 0.025.
In Lot size, enter 2500. Click OK.<br>
You decide to implement a sampling plan to verify the wall thickness. The lower specification for the wall thickness of the piping is 0.09". You and the supplier agree that the AQL is 100 defectives per million and the RQL is 300 defectives per million
Assume standard deviation to be 0.025 Steps:
Choose Stat > Quality Tools > Acceptance Sampling by Variables >Create / Compare.
Choose Create a sampling plan.
In Units for quality levels, choose Defectives per million.
In Acceptable quality level (AQL), enter 100. In Rejectable quality level (RQL or LTPD), enter 300.
In Producer's risk (Alpha), enter 0.05. In Consumer's risk (Beta), enter 0.10.
In Lower spec, enter 0.09.
In Historical standard deviation, enter 0.025.
In Lot size, enter 2500. Click OK.<br>
11
Acceptance Sampling by Variables - Create/Compare
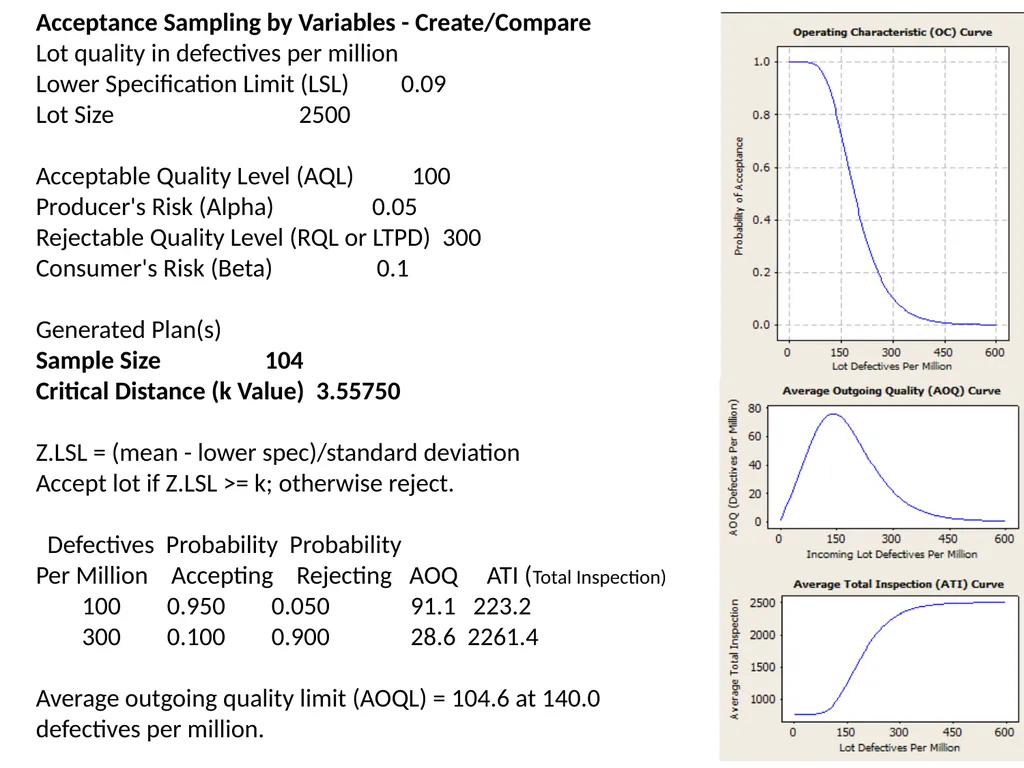
Lot quality in defectives per million
Lower Specification Limit (LSL) 0.09
Lot Size 2500
Acceptable Quality Level (AQL) 100
Producer's Risk (Alpha) 0.05
Rejectable Quality Level (RQL or LTPD) 300
Consumer's Risk (Beta) 0.1
Generated Plan(s)
Sample Size 104
Critical Distance (k Value) 3.55750
Z.LSL = (mean - lower spec)/standard deviation
Accept lot if Z.LSL >= k; otherwise reject.
Defectives Probability Probability
Per Million Accepting Rejecting AOQ ATI (Total Inspection)
100 0.950 0.050 91.1 223.2
300 0.100 0.900 28.6 2261.4
Average outgoing quality limit (AOQL) = 104.6 at 140.0 defectives per million.<br>
Lot quality in defectives per million
Lower Specification Limit (LSL) 0.09
Lot Size 2500
Acceptable Quality Level (AQL) 100
Producer's Risk (Alpha) 0.05
Rejectable Quality Level (RQL or LTPD) 300
Consumer's Risk (Beta) 0.1
Generated Plan(s)
Sample Size 104
Critical Distance (k Value) 3.55750
Z.LSL = (mean - lower spec)/standard deviation
Accept lot if Z.LSL >= k; otherwise reject.
Defectives Probability Probability
Per Million Accepting Rejecting AOQ ATI (Total Inspection)
100 0.950 0.050 91.1 223.2
300 0.100 0.900 28.6 2261.4
Average outgoing quality limit (AOQL) = 104.6 at 140.0 defectives per million.<br>
12
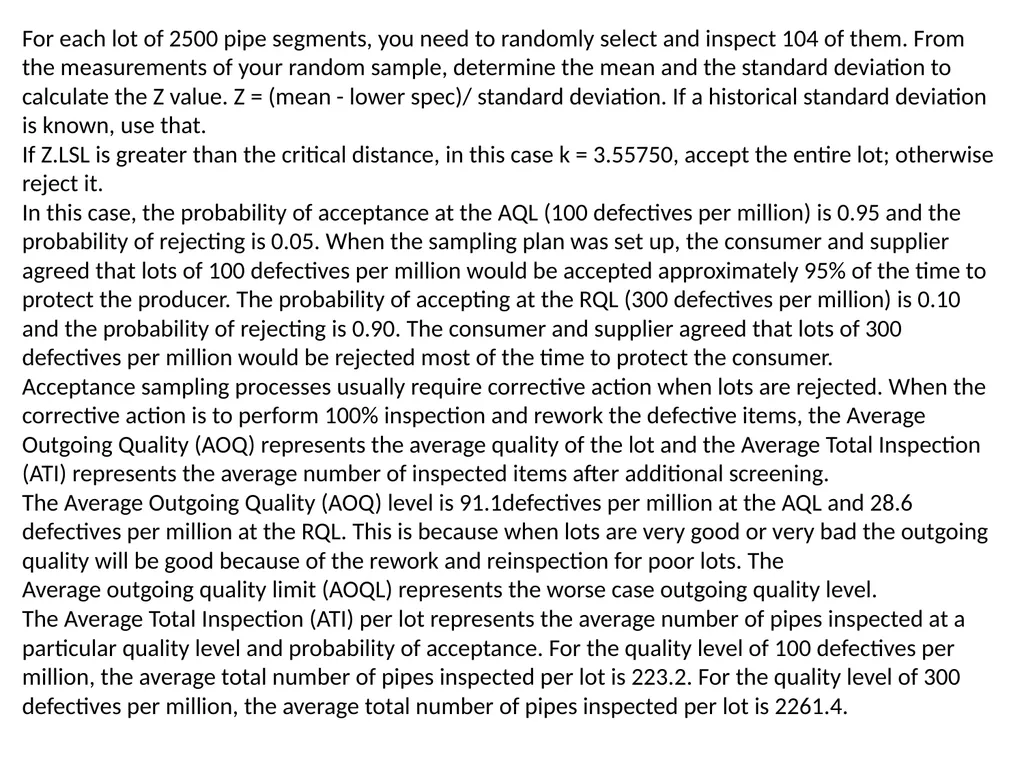
For each lot of 2500 pipe segments, you need to randomly select and inspect 104 of them. From the measurements of your random sample, determine the mean and the standard deviation to calculate the Z value. Z = (mean - lower spec)/ standard deviation. If a historical standard deviation is known, use that.
If Z.LSL is greater than the critical distance, in this case k = 3.55750, accept the entire lot; otherwise reject it.
In this case, the probability of acceptance at the AQL (100 defectives per million) is 0.95 and the probability of rejecting is 0.05. When the sampling plan was set up, the consumer and supplier agreed that lots of 100 defectives per million would be accepted approximately 95% of the time to protect the producer. The probability of accepting at the RQL (300 defectives per million) is 0.10 and the probability of rejecting is 0.90. The consumer and supplier agreed that lots of 300 defectives per million would be rejected most of the time to protect the consumer.
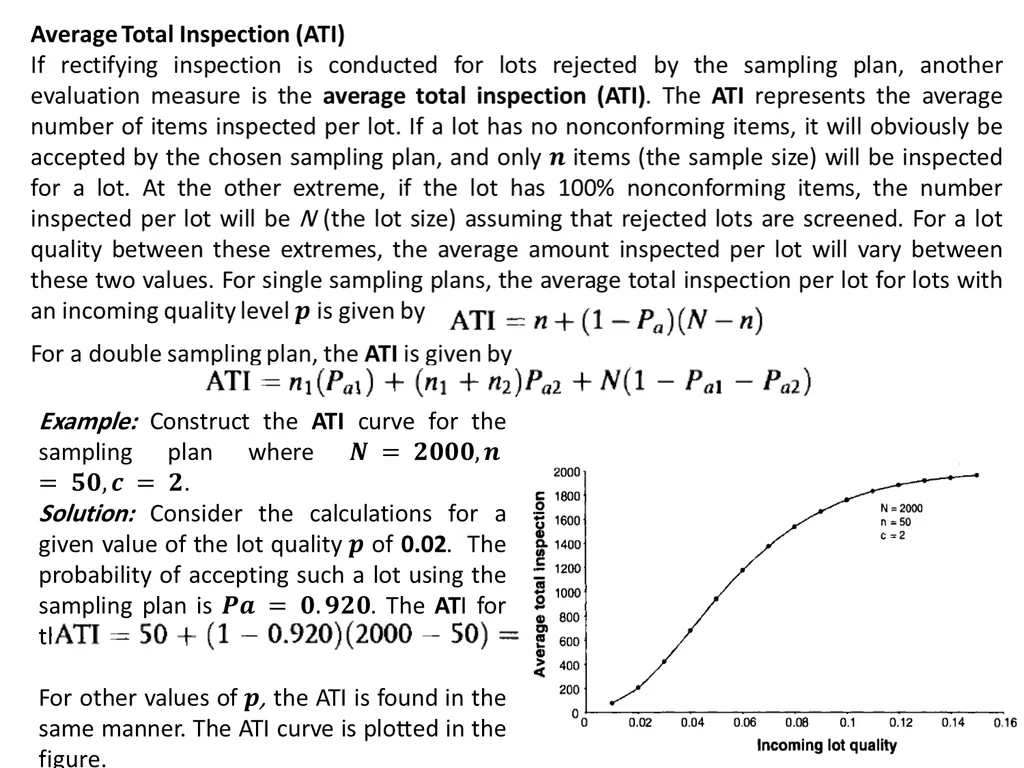
Acceptance sampling processes usually require corrective action when lots are rejected. When the corrective action is to perform 100% inspection and rework the defective items, the Average Outgoing Quality (AOQ) represents the average quality of the lot and the Average Total Inspection (ATI) represents the average number of inspected items after additional screening.
The Average Outgoing Quality (AOQ) level is 91.1defectives per million at the AQL and 28.6 defectives per million at the RQL. This is because when lots are very good or very bad the outgoing quality will be good because of the rework and reinspection for poor lots. The Average outgoing quality limit (AOQL) represents the worse case outgoing quality level.
The Average Total Inspection (ATI) per lot represents the average number of pipes inspected at a particular quality level and probability of acceptance. For the quality level of 100 defectives per million, the average total number of pipes inspected per lot is 223.2. For the quality level of 300 defectives per million, the average total number of pipes inspected per lot is 2261.4.<br>
If Z.LSL is greater than the critical distance, in this case k = 3.55750, accept the entire lot; otherwise reject it.
In this case, the probability of acceptance at the AQL (100 defectives per million) is 0.95 and the probability of rejecting is 0.05. When the sampling plan was set up, the consumer and supplier agreed that lots of 100 defectives per million would be accepted approximately 95% of the time to protect the producer. The probability of accepting at the RQL (300 defectives per million) is 0.10 and the probability of rejecting is 0.90. The consumer and supplier agreed that lots of 300 defectives per million would be rejected most of the time to protect the consumer.
Acceptance sampling processes usually require corrective action when lots are rejected. When the corrective action is to perform 100% inspection and rework the defective items, the Average Outgoing Quality (AOQ) represents the average quality of the lot and the Average Total Inspection (ATI) represents the average number of inspected items after additional screening.
The Average Outgoing Quality (AOQ) level is 91.1defectives per million at the AQL and 28.6 defectives per million at the RQL. This is because when lots are very good or very bad the outgoing quality will be good because of the rework and reinspection for poor lots. The Average outgoing quality limit (AOQL) represents the worse case outgoing quality level.
The Average Total Inspection (ATI) per lot represents the average number of pipes inspected at a particular quality level and probability of acceptance. For the quality level of 100 defectives per million, the average total number of pipes inspected per lot is 223.2. For the quality level of 300 defectives per million, the average total number of pipes inspected per lot is 2261.4.<br>
13
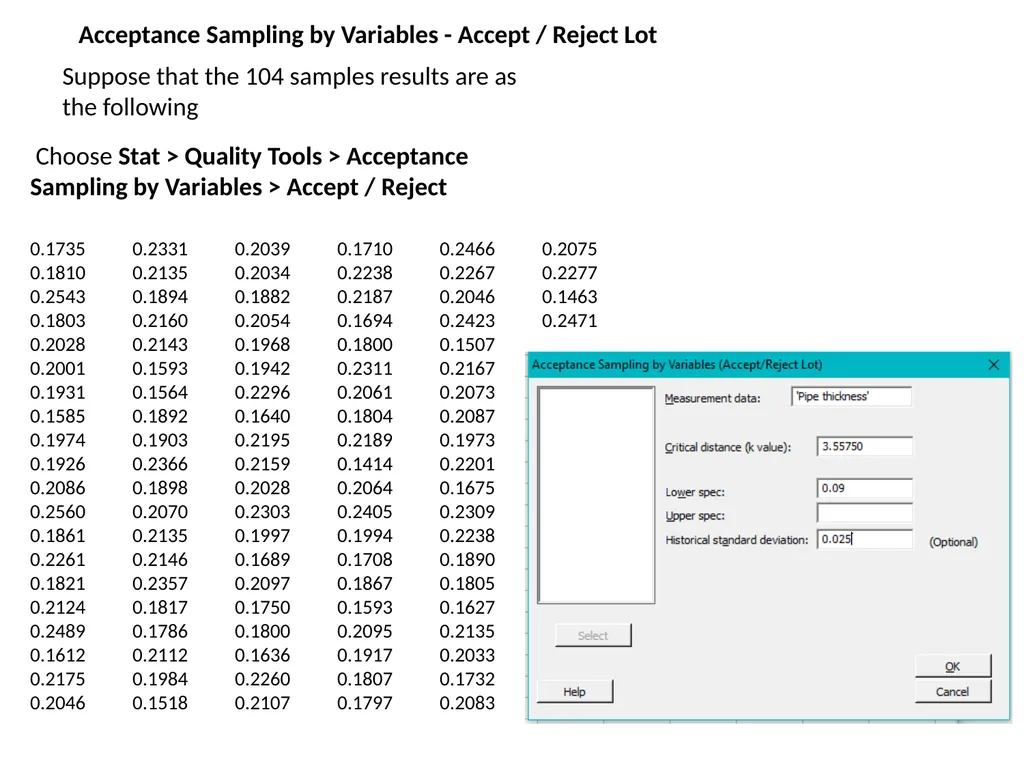
Acceptance Sampling by Variables - Accept / Reject Lot Suppose that the 104 samples results are as the following Choose Stat > Quality Tools > Acceptance Sampling by Variables > Accept / Reject 0.1735 0.2331 0.2039 0.1710 0.2466 0.2075
0.1810 0.2135 0.2034 0.2238 0.2267 0.2277
0.2543 0.1894 0.1882 0.2187 0.2046 0.1463
0.1803 0.2160 0.2054 0.1694 0.2423 0.2471
0.2028 0.2143 0.1968 0.1800 0.1507
0.2001 0.1593 0.1942 0.2311 0.2167
0.1931 0.1564 0.2296 0.2061 0.2073
0.1585 0.1892 0.1640 0.1804 0.2087
0.1974 0.1903 0.2195 0.2189 0.1973
0.1926 0.2366 0.2159 0.1414 0.2201
0.2086 0.1898 0.2028 0.2064 0.1675
0.2560 0.2070 0.2303 0.2405 0.2309
0.1861 0.2135 0.1997 0.1994 0.2238
0.2261 0.2146 0.1689 0.1708 0.1890
0.1821 0.2357 0.2097 0.1867 0.1805
0.2124 0.1817 0.1750 0.1593 0.1627
0.2489 0.1786 0.1800 0.2095 0.2135
0.1612 0.2112 0.1636 0.1917 0.2033
0.2175 0.1984 0.2260 0.1807 0.1732
0.2046 0.1518 0.2107 0.1797 0.2083<br>
0.1810 0.2135 0.2034 0.2238 0.2267 0.2277
0.2543 0.1894 0.1882 0.2187 0.2046 0.1463
0.1803 0.2160 0.2054 0.1694 0.2423 0.2471
0.2028 0.2143 0.1968 0.1800 0.1507
0.2001 0.1593 0.1942 0.2311 0.2167
0.1931 0.1564 0.2296 0.2061 0.2073
0.1585 0.1892 0.1640 0.1804 0.2087
0.1974 0.1903 0.2195 0.2189 0.1973
0.1926 0.2366 0.2159 0.1414 0.2201
0.2086 0.1898 0.2028 0.2064 0.1675
0.2560 0.2070 0.2303 0.2405 0.2309
0.1861 0.2135 0.1997 0.1994 0.2238
0.2261 0.2146 0.1689 0.1708 0.1890
0.1821 0.2357 0.2097 0.1867 0.1805
0.2124 0.1817 0.1750 0.1593 0.1627
0.2489 0.1786 0.1800 0.2095 0.2135
0.1612 0.2112 0.1636 0.1917 0.2033
0.2175 0.1984 0.2260 0.1807 0.1732
0.2046 0.1518 0.2107 0.1797 0.2083<br>
14
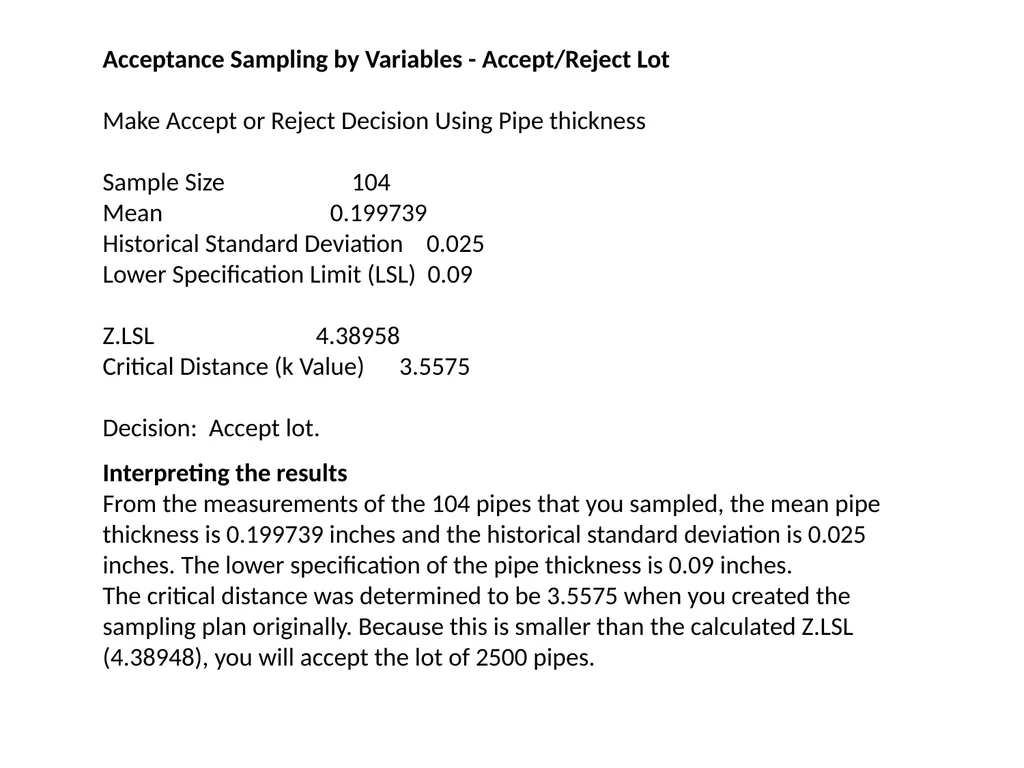
Acceptance Sampling by Variables - Accept/Reject Lot
Make Accept or Reject Decision Using Pipe thickness
Sample Size 104
Mean 0.199739
Historical Standard Deviation 0.025
Lower Specification Limit (LSL) 0.09
Z.LSL 4.38958
Critical Distance (k Value) 3.5575
Decision: Accept lot. Interpreting the results
From the measurements of the 104 pipes that you sampled, the mean pipe thickness is 0.199739 inches and the historical standard deviation is 0.025 inches. The lower specification of the pipe thickness is 0.09 inches.
The critical distance was determined to be 3.5575 when you created the sampling plan originally. Because this is smaller than the calculated Z.LSL (4.38948), you will accept the lot of 2500 pipes.<br>
Make Accept or Reject Decision Using Pipe thickness
Sample Size 104
Mean 0.199739
Historical Standard Deviation 0.025
Lower Specification Limit (LSL) 0.09
Z.LSL 4.38958
Critical Distance (k Value) 3.5575
Decision: Accept lot. Interpreting the results
From the measurements of the 104 pipes that you sampled, the mean pipe thickness is 0.199739 inches and the historical standard deviation is 0.025 inches. The lower specification of the pipe thickness is 0.09 inches.
The critical distance was determined to be 3.5575 when you created the sampling plan originally. Because this is smaller than the calculated Z.LSL (4.38948), you will accept the lot of 2500 pipes.<br>