PERM Improper Payment Rate Calculation
Description: PERM Improper Payment Rate Calculation Presentation PERM Improper Payment Rate Calculation Process October 2021 The approval process of the PERM methodology is very thorough PERM Calculations are not easily replicated Focus on projected
Related Topics
Download Presentation
"PERM Improper Payment Rate Calculation" is the property of its rightful owner. Permission is granted to download and print the materials on this website for personal, non-commercial use only, and to display it on your personal computer provided you do not modify the materials and that you retain all copyright notices contained in the materials. By downloading content from our website, you accept the terms of this agreement.
Presentation Transcript
slide1. PERM Improper Payment Rate Calculation Presentation PERM Improper Payment Rate Calculation Process
October 2021<br>
slide2. The approval process of the PERM methodology is very thorough
PERM Calculations are not easily replicated
Focus on projected dollars in error to understand what drives the rate
Focus on number of errors to understand common error trends Most Important Takeaways<br>
slide3. States send universe data, and the Statistical Contractor (SC) draws a sample of claims from the universe
Review Contractors (RC) review sampled claims and determine improper payment amount
SC calculates an estimated improper payment rate from the reviewed sampled claims Calculating State Improper Payment Rates<br>
slide4. Calculating State Component Rates<br>
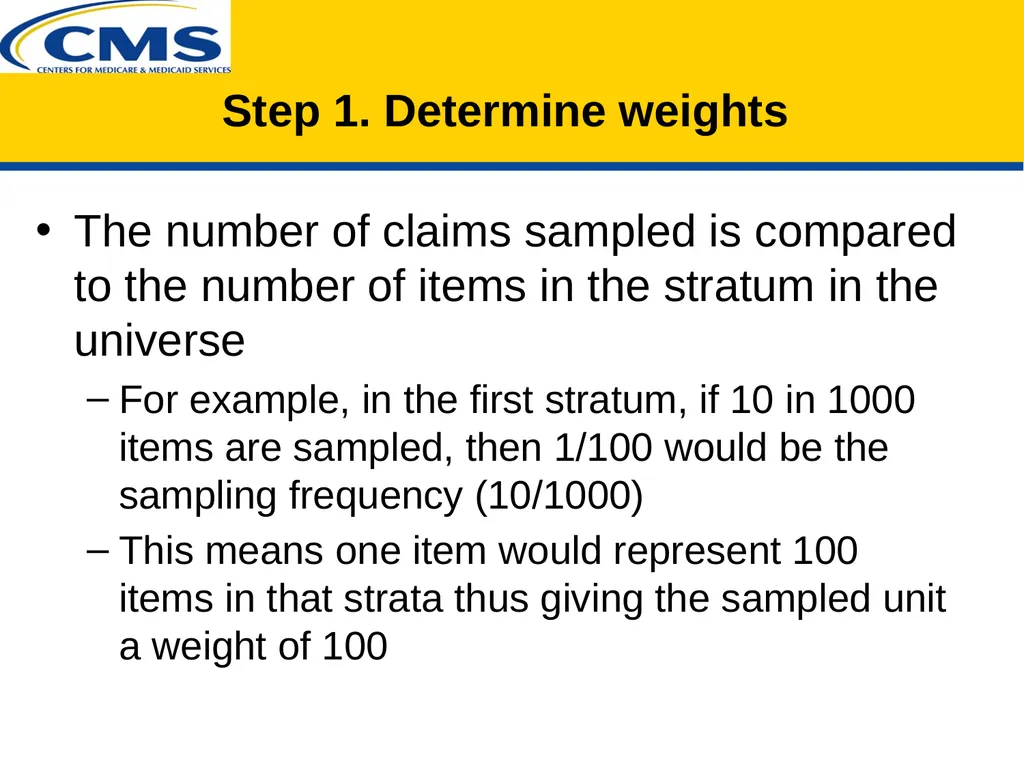
slide5. The number of claims sampled is compared to the number of items in the stratum in the universe
For example, in the first stratum, if 10 in 1000 items are sampled, then 1/100 would be the sampling frequency (10/1000)
This means one item would represent 100 items in that strata thus giving the sampled unit a weight of 100 Step 1. Determine weights<br>
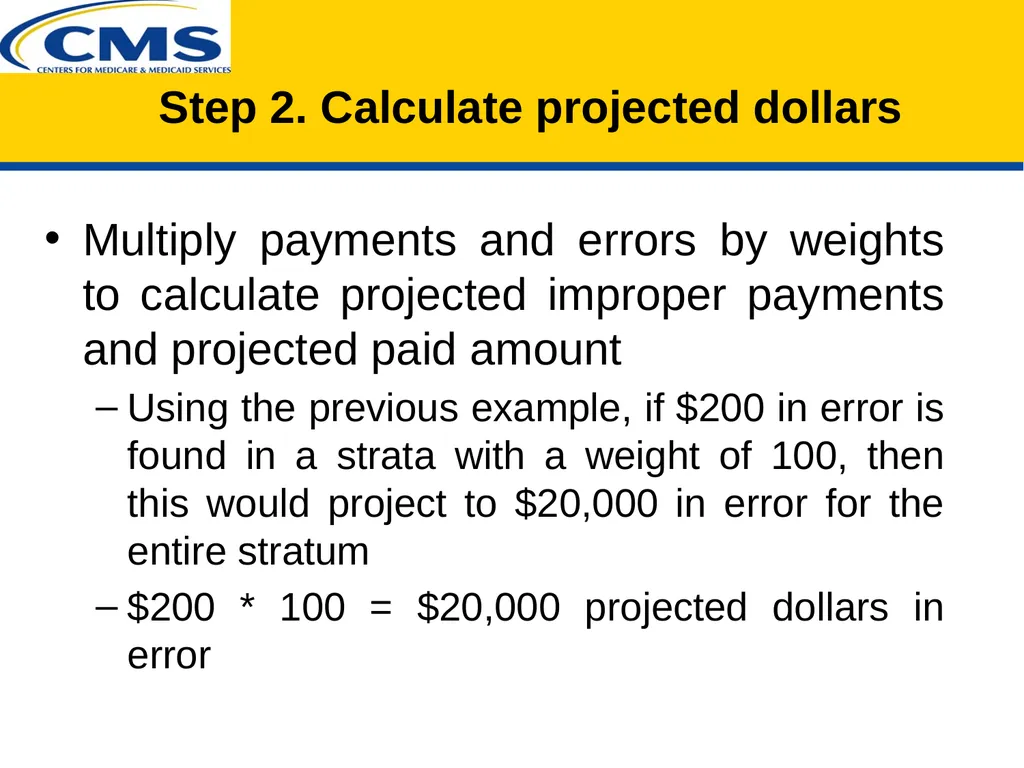
slide6. Multiply payments and errors by weights to calculate projected improper payments and projected paid amount
Using the previous example, if $200 in error is found in a strata with a weight of 100, then this would project to $20,000 in error for the entire stratum
$200 * 100 = $20,000 projected dollars in error Step 2. Calculate projected dollars<br>
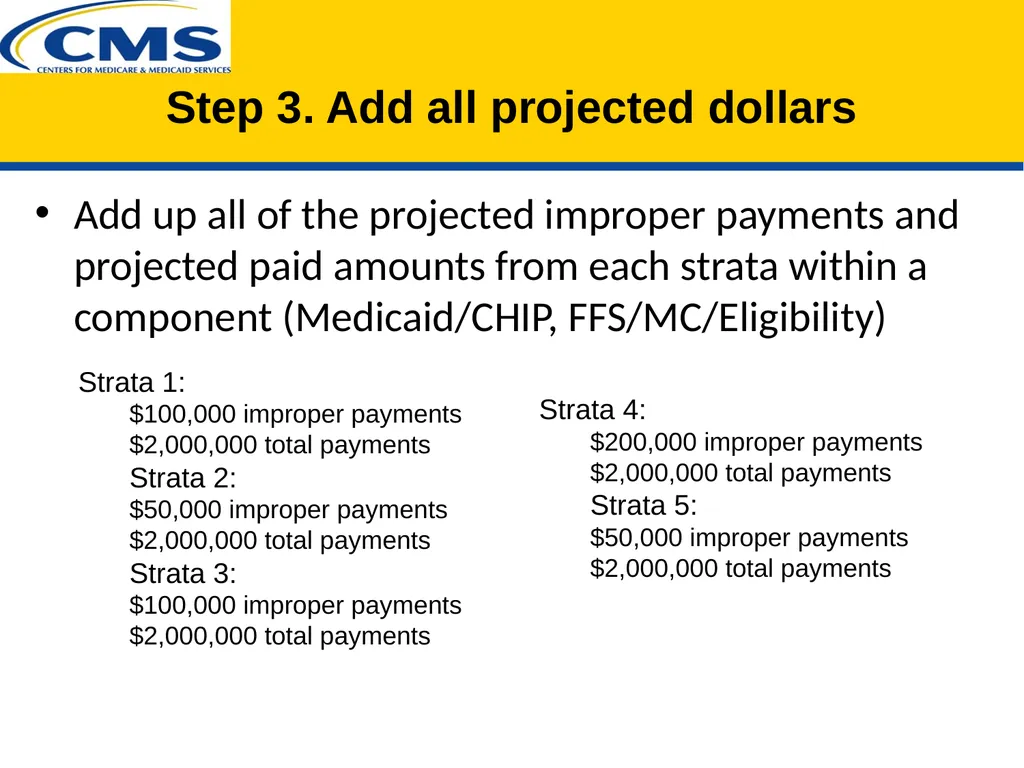
slide7. Strata 4:
$200,000 improper payments
$2,000,000 total payments
Strata 5:
$50,000 improper payments $2,000,000 total payments Strata 1:
$100,000 improper payments
$2,000,000 total payments
Strata 2:
$50,000 improper payments $2,000,000 total payments
Strata 3:
$100,000 improper payments $2,000,000 total payments Add up all of the projected improper payments and projected paid amounts from each strata within a component (Medicaid/CHIP, FFS/MC/Eligibility) Step 3. Add all projected dollars<br>
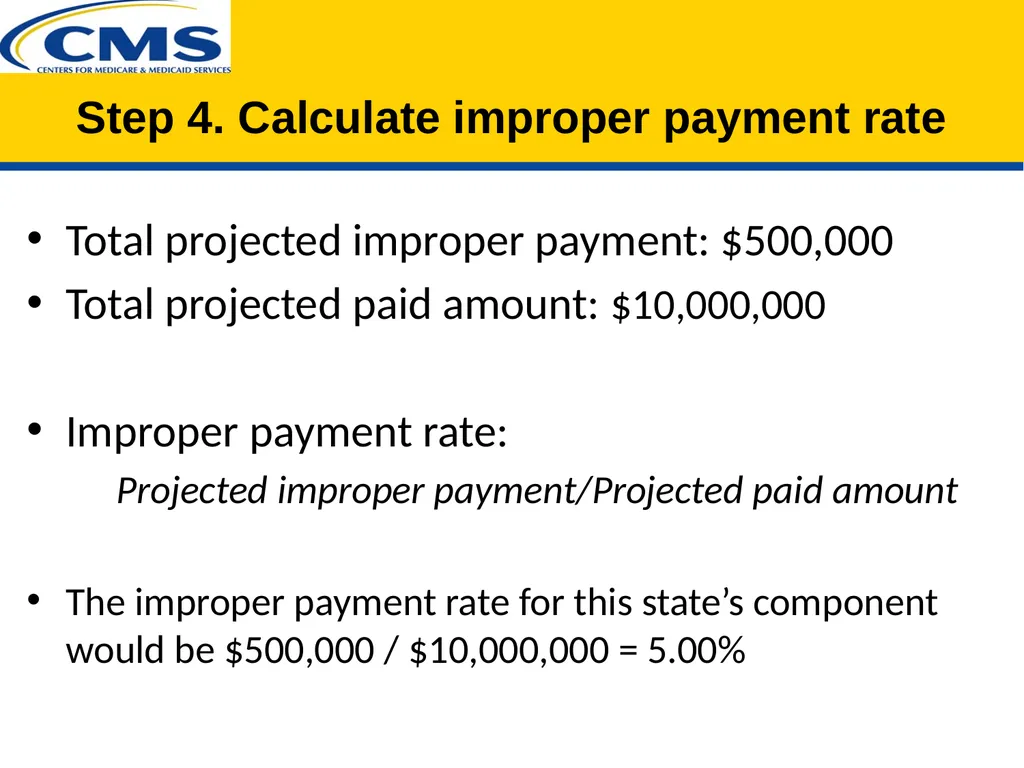
slide8. Total projected improper payment: $500,000
Total projected paid amount: $10,000,000
Improper payment rate:
Projected improper payment/Projected paid amount
The improper payment rate for this state’s component would be $500,000 / $10,000,000 = 5.00% Step 4. Calculate improper payment rate<br>
slide9. Combining State Component Rates<br>
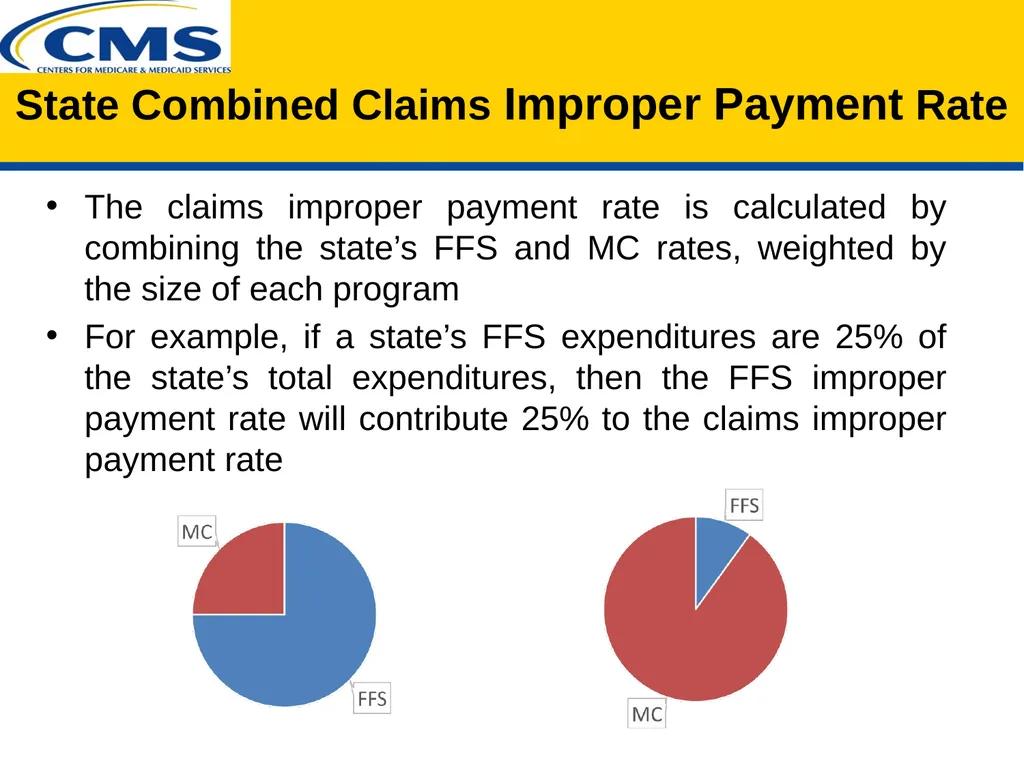
slide10. The claims improper payment rate is calculated by combining the state’s FFS and MC rates, weighted by the size of each program
For example, if a state’s FFS expenditures are 25% of the state’s total expenditures, then the FFS improper payment rate will contribute 25% to the claims improper payment rate State Combined Claims Improper Payment Rate<br>
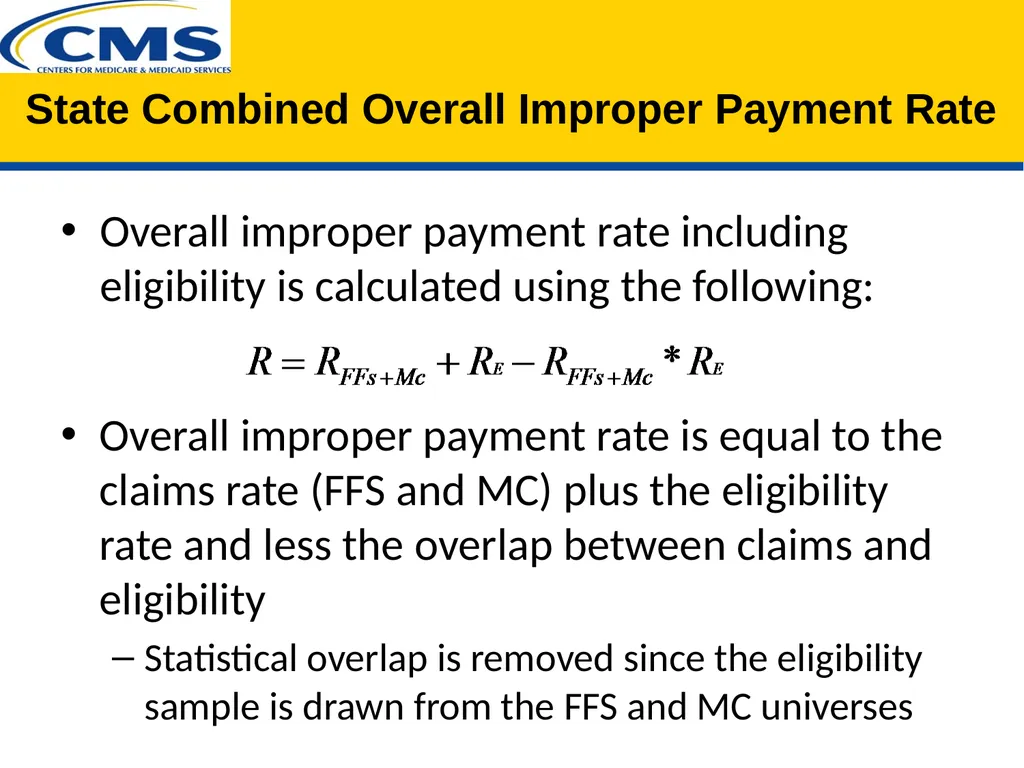
slide11. Overall improper payment rate is equal to the claims rate (FFS and MC) plus the eligibility rate and less the overlap between claims and eligibility
Statistical overlap is removed since the eligibility sample is drawn from the FFS and MC universes Overall improper payment rate including eligibility is calculated using the following: State Combined Overall Improper Payment Rate<br>
slide12. Calculating the Cycle and National Rates<br>
slide13. The cycle improper payment rate
Calculated by combining all 17 state component rates (FFS, managed care, eligibility)
The cycle component rates are then combined to calculate the cycle overall rate
Is impacted by each state’s:
Total expenditures
Improper payment rate Cycle Improper Payment Rates<br>
slide14. The national improper payment rate
Is called “rolling” because it includes rates from three cycles of data
RY 2021 includes improper payment rates from RY 2019, RY 2020, and RY 2021 cycles
Similar to cycle rate
State’s contribution is based on the total expenditures and improper payment rates
The rolling component rates are combined to calculate the national rolling overall rate National Rolling Improper Payment Rates<br>
slide15. Calculating Target Rate<br>
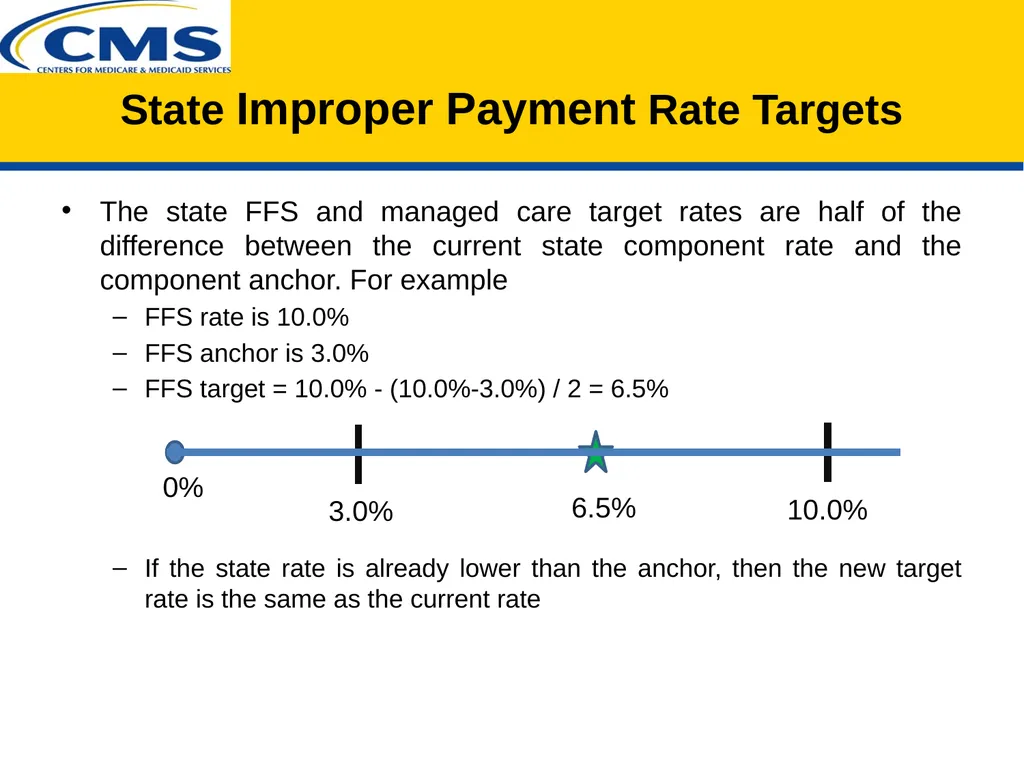
slide16. 10.0% 6.5% 3.0% 0% The state FFS and managed care target rates are half of the difference between the current state component rate and the component anchor. For example
FFS rate is 10.0%
FFS anchor is 3.0%
FFS target = 10.0% - (10.0%-3.0%) / 2 = 6.5%
If the state rate is already lower than the anchor, then the new target rate is the same as the current rate State Improper Payment Rate Targets<br>

slide17. Questions? PERM Improper Payment Rate Calculation Process<br>
October 2021<br>
slide2. The approval process of the PERM methodology is very thorough
PERM Calculations are not easily replicated
Focus on projected dollars in error to understand what drives the rate
Focus on number of errors to understand common error trends Most Important Takeaways<br>
slide3. States send universe data, and the Statistical Contractor (SC) draws a sample of claims from the universe
Review Contractors (RC) review sampled claims and determine improper payment amount
SC calculates an estimated improper payment rate from the reviewed sampled claims Calculating State Improper Payment Rates<br>
slide4. Calculating State Component Rates<br>
slide5. The number of claims sampled is compared to the number of items in the stratum in the universe
For example, in the first stratum, if 10 in 1000 items are sampled, then 1/100 would be the sampling frequency (10/1000)
This means one item would represent 100 items in that strata thus giving the sampled unit a weight of 100 Step 1. Determine weights<br>
slide6. Multiply payments and errors by weights to calculate projected improper payments and projected paid amount
Using the previous example, if $200 in error is found in a strata with a weight of 100, then this would project to $20,000 in error for the entire stratum
$200 * 100 = $20,000 projected dollars in error Step 2. Calculate projected dollars<br>
slide7. Strata 4:
$200,000 improper payments
$2,000,000 total payments
Strata 5:
$50,000 improper payments $2,000,000 total payments Strata 1:
$100,000 improper payments
$2,000,000 total payments
Strata 2:
$50,000 improper payments $2,000,000 total payments
Strata 3:
$100,000 improper payments $2,000,000 total payments Add up all of the projected improper payments and projected paid amounts from each strata within a component (Medicaid/CHIP, FFS/MC/Eligibility) Step 3. Add all projected dollars<br>
slide8. Total projected improper payment: $500,000
Total projected paid amount: $10,000,000
Improper payment rate:
Projected improper payment/Projected paid amount
The improper payment rate for this state’s component would be $500,000 / $10,000,000 = 5.00% Step 4. Calculate improper payment rate<br>
slide9. Combining State Component Rates<br>
slide10. The claims improper payment rate is calculated by combining the state’s FFS and MC rates, weighted by the size of each program
For example, if a state’s FFS expenditures are 25% of the state’s total expenditures, then the FFS improper payment rate will contribute 25% to the claims improper payment rate State Combined Claims Improper Payment Rate<br>
slide11. Overall improper payment rate is equal to the claims rate (FFS and MC) plus the eligibility rate and less the overlap between claims and eligibility
Statistical overlap is removed since the eligibility sample is drawn from the FFS and MC universes Overall improper payment rate including eligibility is calculated using the following: State Combined Overall Improper Payment Rate<br>
slide12. Calculating the Cycle and National Rates<br>
slide13. The cycle improper payment rate
Calculated by combining all 17 state component rates (FFS, managed care, eligibility)
The cycle component rates are then combined to calculate the cycle overall rate
Is impacted by each state’s:
Total expenditures
Improper payment rate Cycle Improper Payment Rates<br>
slide14. The national improper payment rate
Is called “rolling” because it includes rates from three cycles of data
RY 2021 includes improper payment rates from RY 2019, RY 2020, and RY 2021 cycles
Similar to cycle rate
State’s contribution is based on the total expenditures and improper payment rates
The rolling component rates are combined to calculate the national rolling overall rate National Rolling Improper Payment Rates<br>
slide15. Calculating Target Rate<br>
slide16. 10.0% 6.5% 3.0% 0% The state FFS and managed care target rates are half of the difference between the current state component rate and the component anchor. For example
FFS rate is 10.0%
FFS anchor is 3.0%
FFS target = 10.0% - (10.0%-3.0%) / 2 = 6.5%
If the state rate is already lower than the anchor, then the new target rate is the same as the current rate State Improper Payment Rate Targets<br>
slide17. Questions? PERM Improper Payment Rate Calculation Process<br>