Photometry: Estimation of analyte concentration on the basis of light absorption Photometry Photometry is one of the most widely used analytical procedures in biochemistry. For simple routine determination of small quantities of materials.
"Photometry: Estimation of analyte concentration on" is the property of its rightful owner. Permission is granted to
download and print the materials on this website for personal, non-commercial use only, and to display it
on your personal computer provided you do not modify the materials and that you retain all copyright
notices contained in the materials. By downloading content from our website, you accept the terms of this
agreement.
Presentation Transcript
01
Photometry:
Estimation of analyte concentration on the basis of light absorption<br>
02
Photometry Photometry is one of the most widely used analytical procedures in biochemistry.
For simple routine determination of small quantities of materials. The principle is based on physical laws of radiant energy or light.
Basic photometric principle can be applied in several analytical procedures,
1. Measurement of absorbed or transmitted light: colorimeter, spectrophotometery, atomic absorption, turbidometery
2. Measurement of emitted light, flame emission photometery: flourometery<br>
03
Spectrophotometer These are optical instruments for measurement of the absorption of light of a given wavelength of coloured substances in solution.
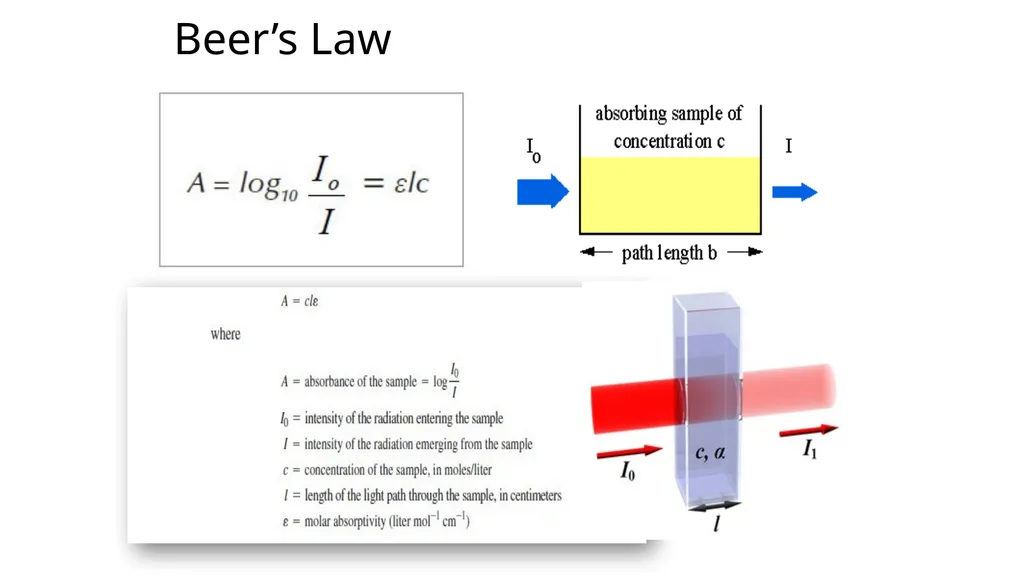
Beer's law makes it possible to calculate the concentration of the coloured substance in the solution.
Absorption photometers for work in aqueous solution work in the ultraviolet and visible ranges, from wavelength around 240 nm up to 750 nm.
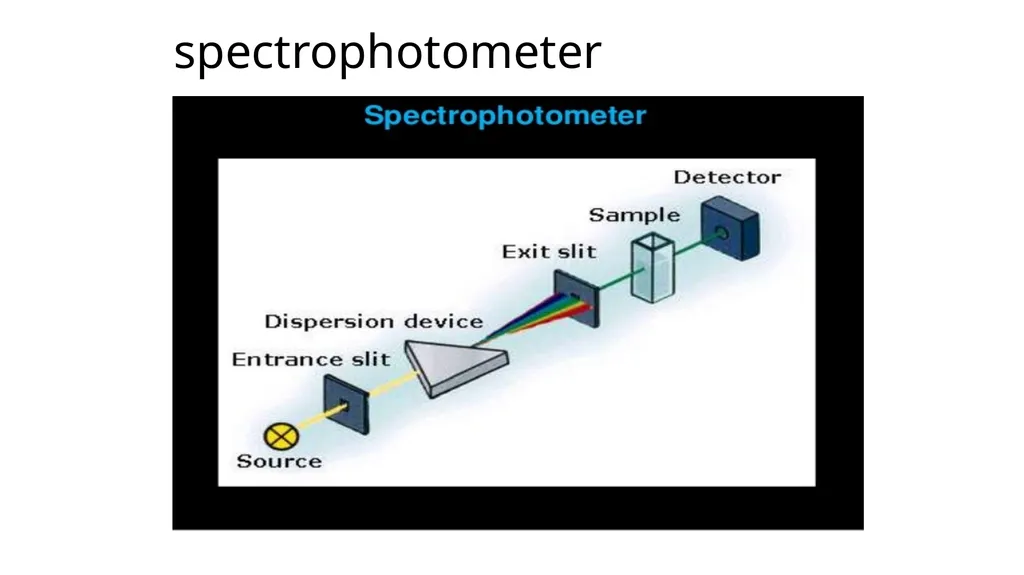
The principle of spectrophotometers and filter photometers is that monochromatic light is allowed to pass through a container (cell) with optically flat windows containing the solution.
It then reaches a light detector, that measures the intensity of the light compared to the intensity after passing through an identical cell with the same solvent but without the coloured substance.
From the ratio between the light intensities, knowing the capacity of the coloured substance to absorb light, it is possible to calculate the concentration of the substance using Beer's law.
In spectrophotometers a monochromator (with prism or with grating) is used to obtain monochromatic light of one defined wavelength.<br>
04
spectrophotometer<br>
05
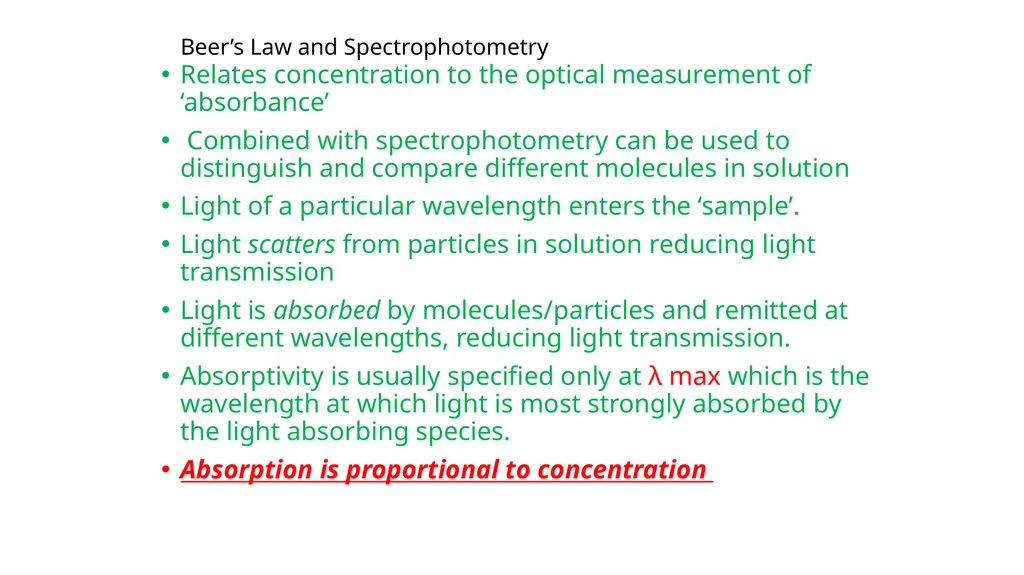
Beer’s Law and Spectrophotometry Relates concentration to the optical measurement of ‘absorbance’
Combined with spectrophotometry can be used to distinguish and compare different molecules in solution
Light of a particular wavelength enters the ‘sample’.
Light scatters from particles in solution reducing light transmission
Light is absorbed by molecules/particles and remitted at different wavelengths, reducing light transmission.
Absorptivity is usually specified only at λ max which is the wavelength at which light is most strongly absorbed by the light absorbing species.
Absorption is proportional to concentration<br>
06
Beer’s Law<br>
07
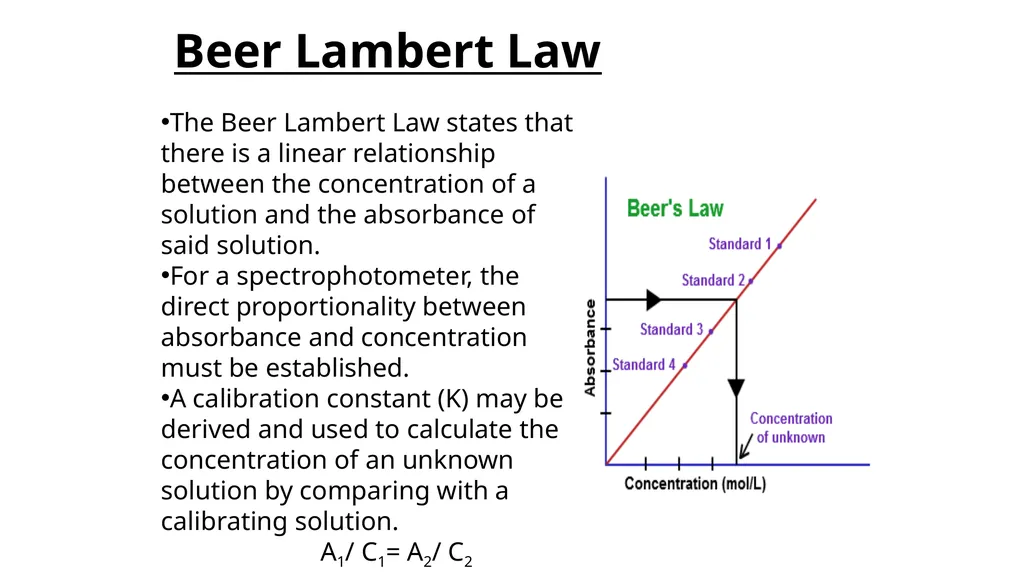
Beer Lambert Law The Beer Lambert Law states that there is a linear relationship between the concentration of a solution and the absorbance of said solution.
For a spectrophotometer, the direct proportionality between absorbance and concentration must be established.
A calibration constant (K) may be derived and used to calculate the concentration of an unknown solution by comparing with a calibrating solution.
A1/ C1= A2/ C2<br>
08
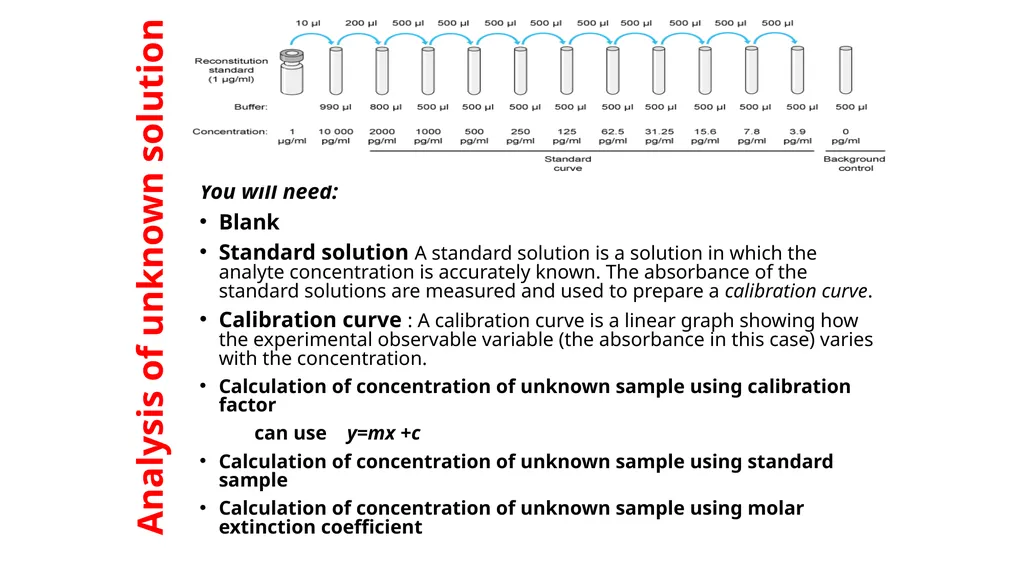
Analysis of unknown solution You will need:
Blank
Standard solution A standard solution is a solution in which the analyte concentration is accurately known. The absorbance of the standard solutions are measured and used to prepare a calibration curve.
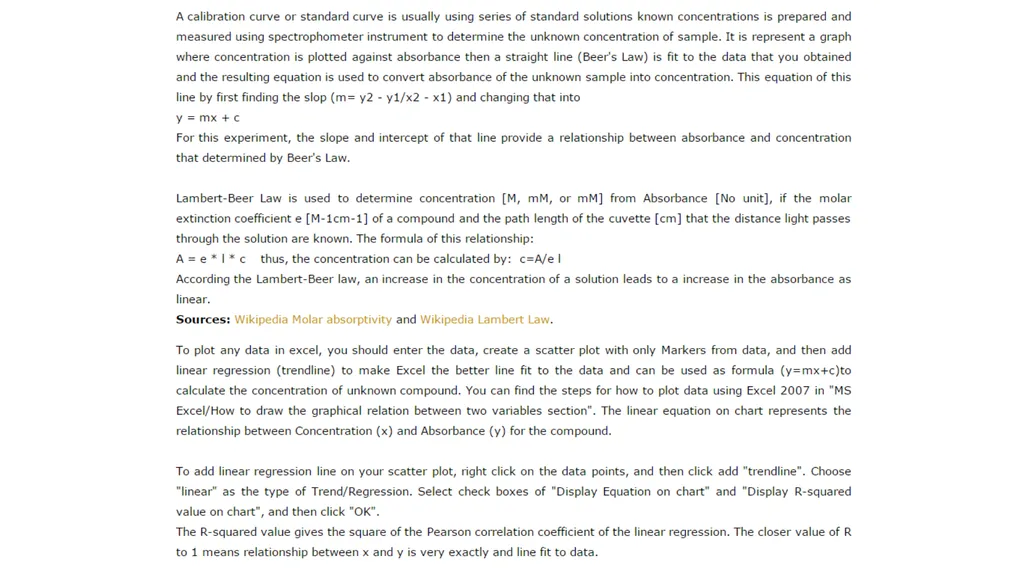
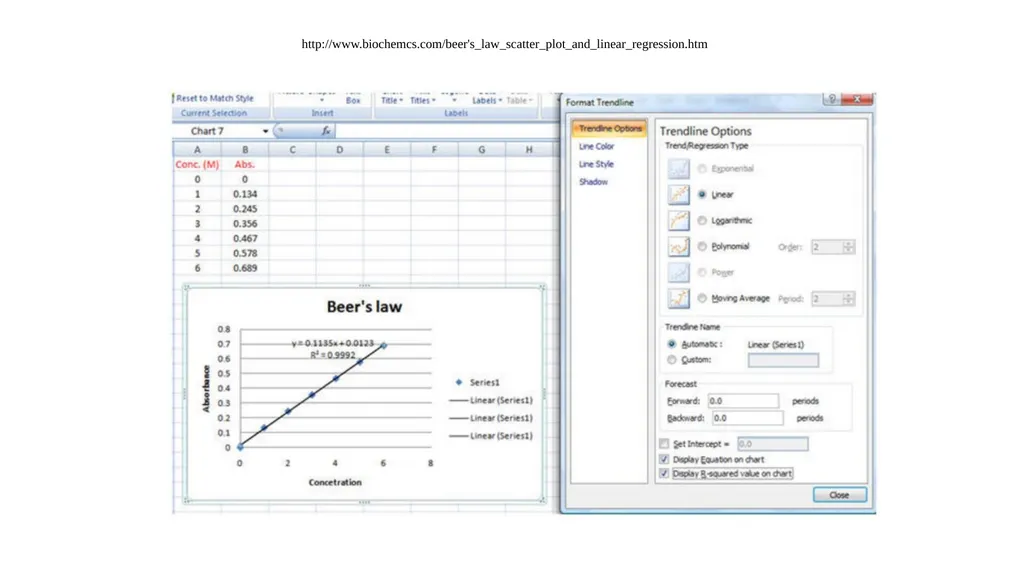
Calibration curve : A calibration curve is a linear graph showing how the experimental observable variable (the absorbance in this case) varies with the concentration.
Calculation of concentration of unknown sample using calibration factor
can use y=mx +c
Calculation of concentration of unknown sample using standard sample
Calculation of concentration of unknown sample using molar extinction coefficient<br>
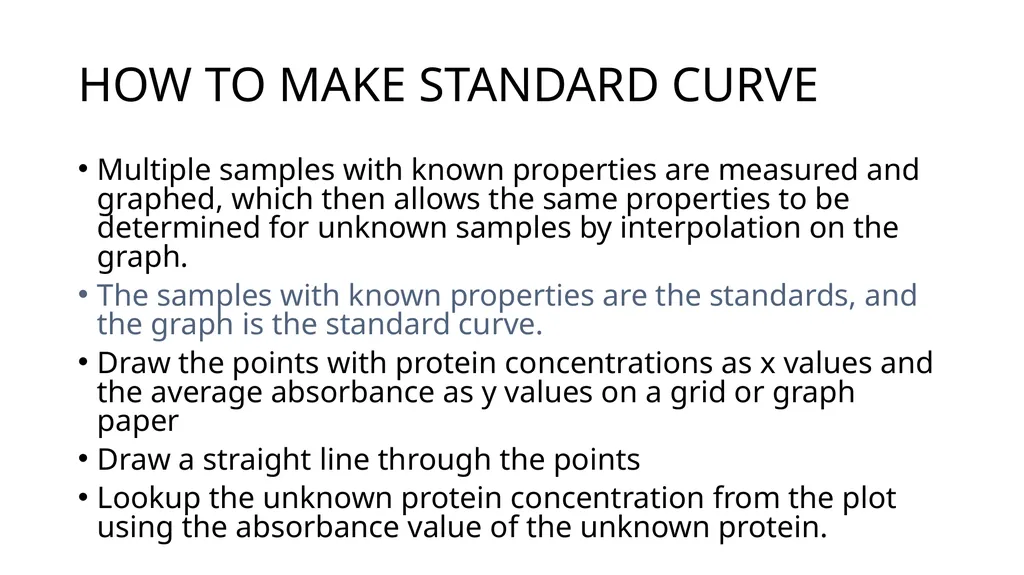
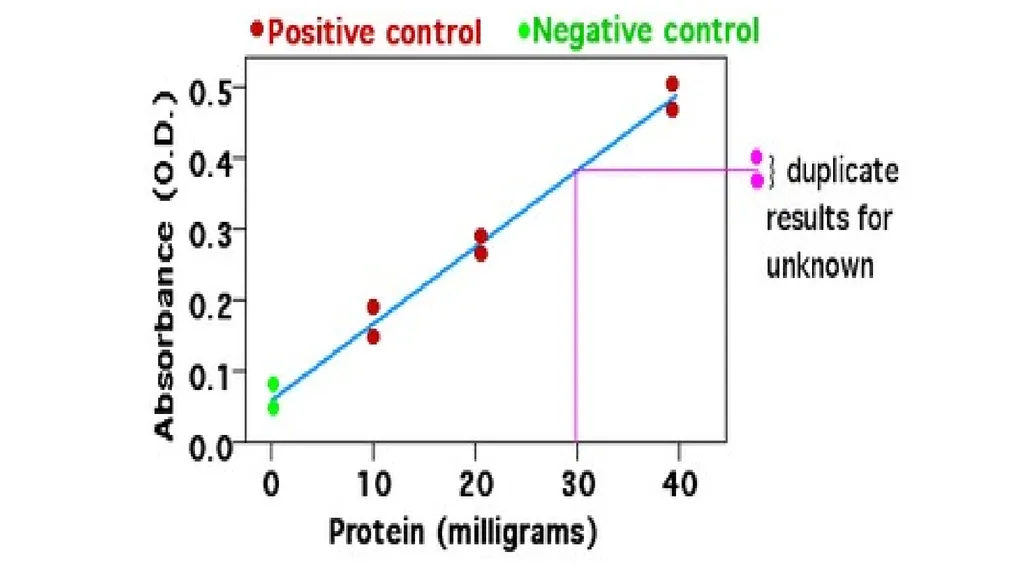
HOW TO MAKE STANDARD CURVE Multiple samples with known properties are measured and graphed, which then allows the same properties to be determined for unknown samples by interpolation on the graph.
The samples with known properties are the standards, and the graph is the standard curve.
Draw the points with protein concentrations as x values and the average absorbance as y values on a grid or graph paper
Draw a straight line through the points
Lookup the unknown protein concentration from the plot using the absorbance value of the unknown protein.<br>
11
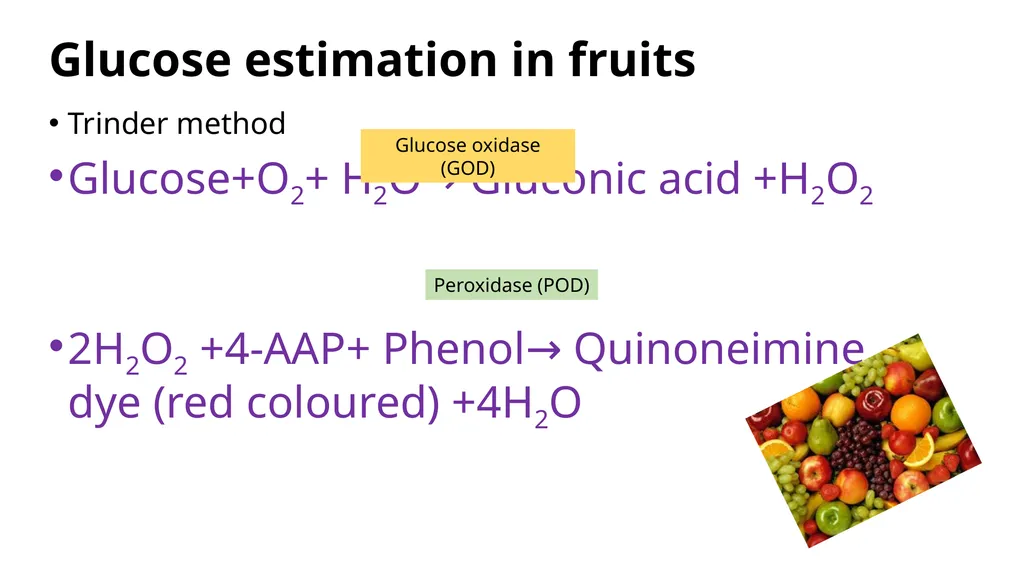
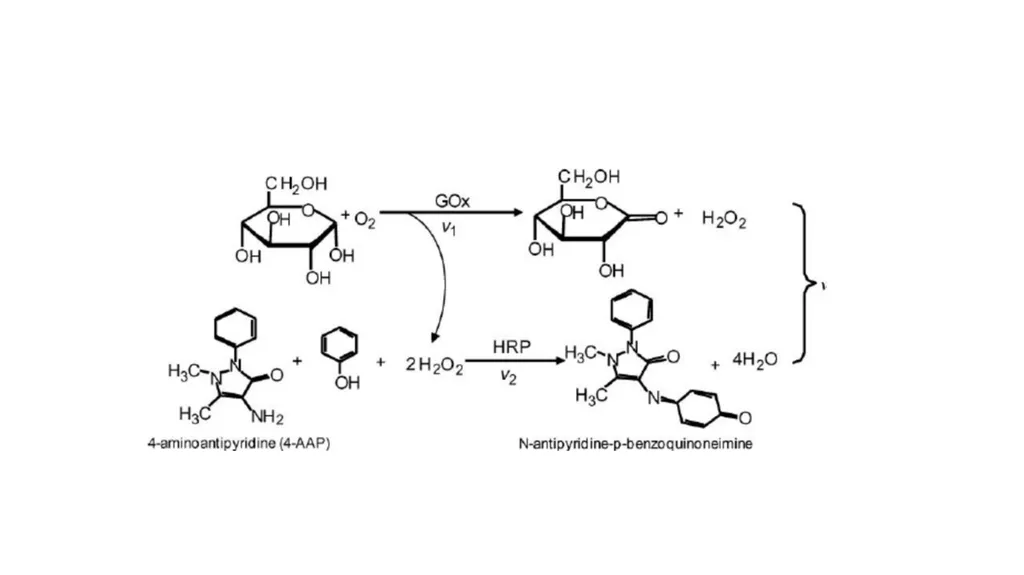
Estimation of Glucose EXP_ 2
ACh<br>
12
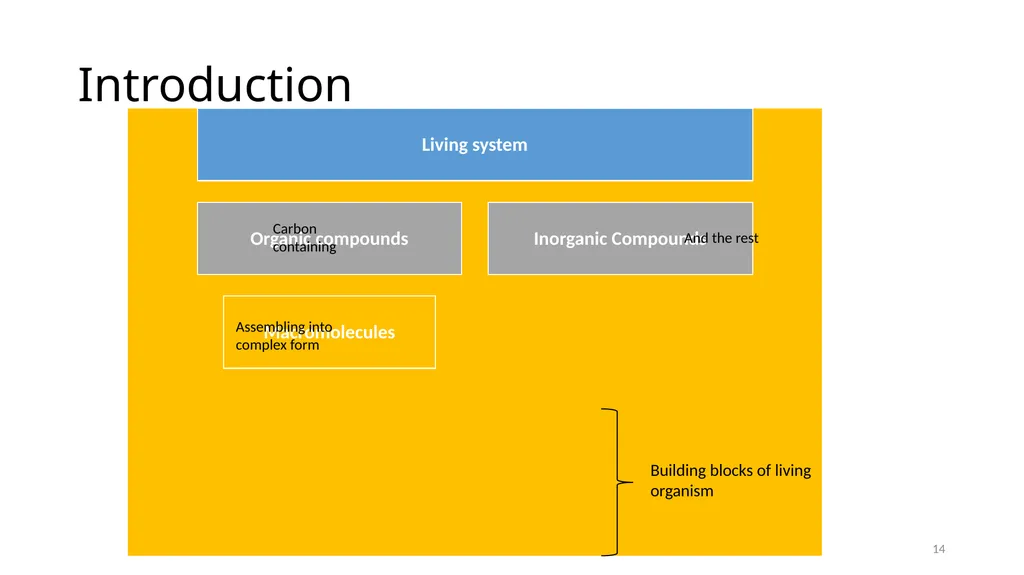
Introduction Carbon containing And the rest Assembling into complex form Building blocks of living organism 14<br>
13
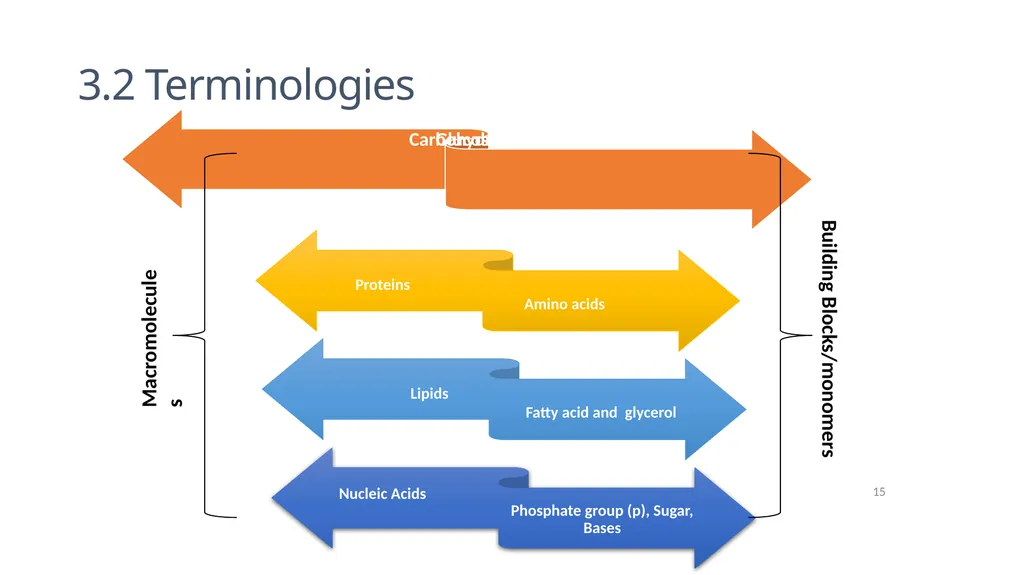
15 Lipids Fatty acid and glycerol Nucleic Acids Phosphate group (p), Sugar, Bases Macromolecules Building Blocks/monomers 3.2 Terminologies<br>
14
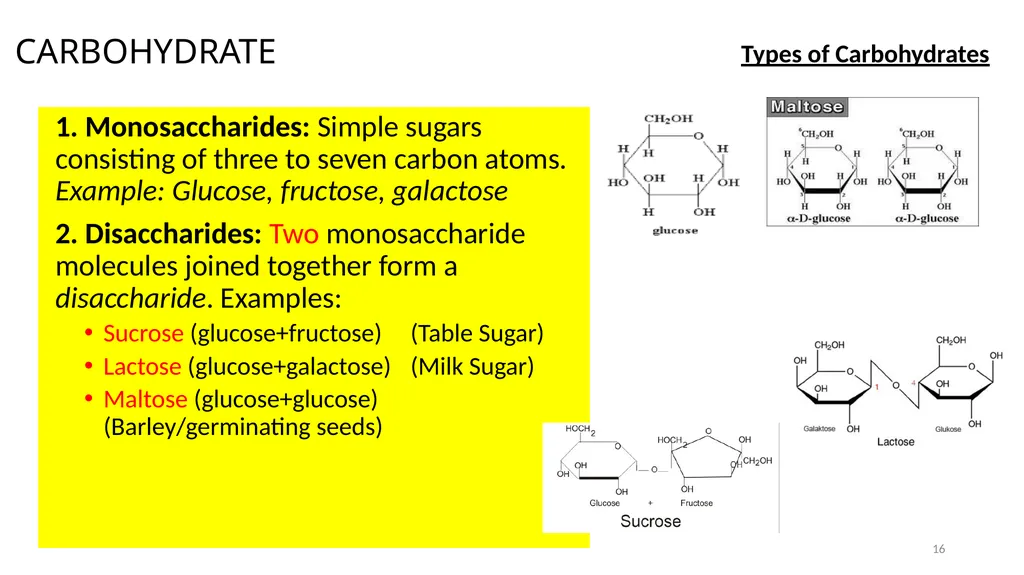
CARBOHYDRATE 1. Monosaccharides: Simple sugars consisting of three to seven carbon atoms. Example: Glucose, fructose, galactose
2. Disaccharides: Two monosaccharide molecules joined together form a disaccharide. Examples:
Sucrose (glucose+fructose) (Table Sugar)
Lactose (glucose+galactose) (Milk Sugar)
Maltose (glucose+glucose) (Barley/germinating seeds) 16 Types of Carbohydrates<br>
15
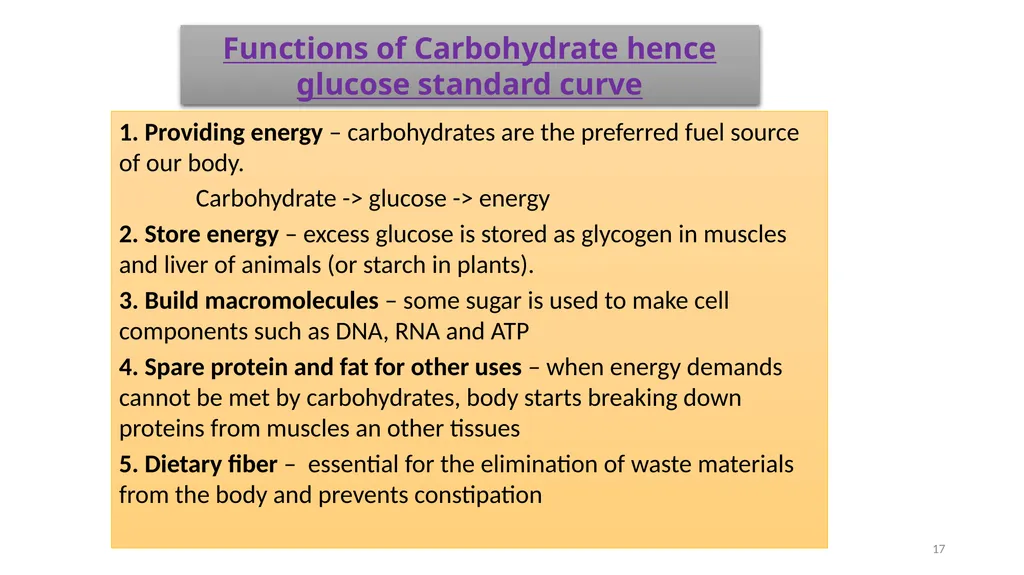
17 1. Providing energy – carbohydrates are the preferred fuel source of our body.
Carbohydrate -> glucose -> energy
2. Store energy – excess glucose is stored as glycogen in muscles and liver of animals (or starch in plants).
3. Build macromolecules – some sugar is used to make cell components such as DNA, RNA and ATP
4. Spare protein and fat for other uses – when energy demands cannot be met by carbohydrates, body starts breaking down proteins from muscles an other tissues
5. Dietary fiber – essential for the elimination of waste materials from the body and prevents constipation Functions of Carbohydrate hence glucose standard curve<br>
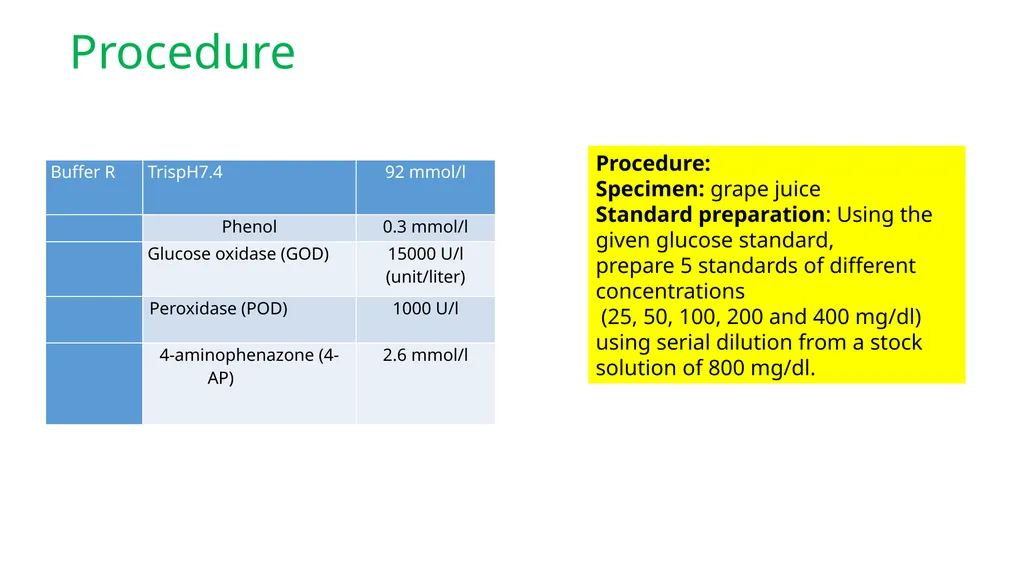
Procedure Procedure:
Specimen: grape juice
Standard preparation: Using the given glucose standard,
prepare 5 standards of different concentrations
(25, 50, 100, 200 and 400 mg/dl) using serial dilution from a stock solution of 800 mg/dl.<br>
18
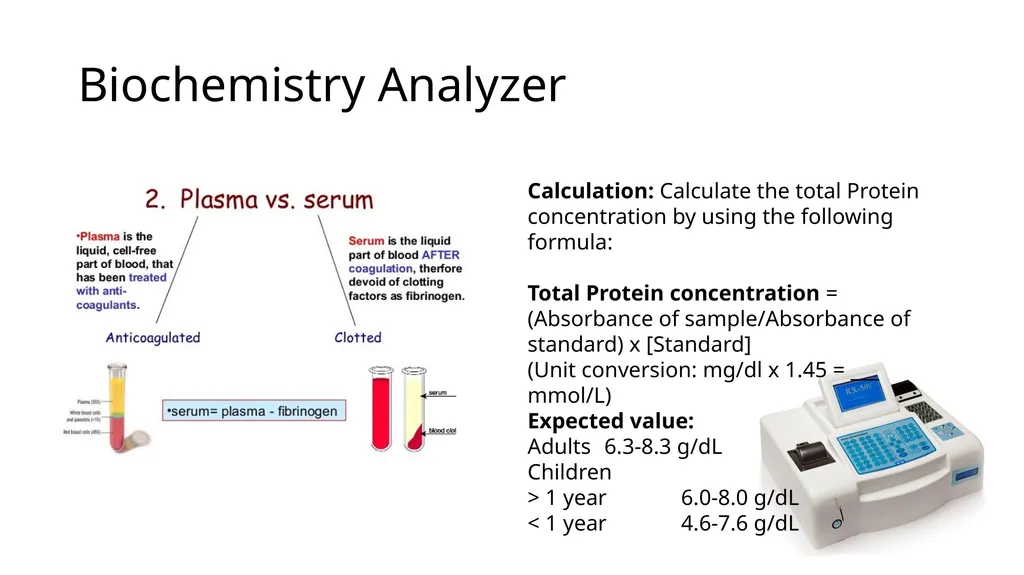
Biochemistry Analyzer Calculation: Calculate the total Protein concentration by using the following formula:
Total Protein concentration =
(Absorbance of sample/Absorbance of standard) x [Standard]
(Unit conversion: mg/dl x 1.45 = ___ mmol/L)
Expected value:
Adults 6.3-8.3 g/dL
Children
> 1 year 6.0-8.0 g/dL
< 1 year 4.6-7.6 g/dL<br>
19
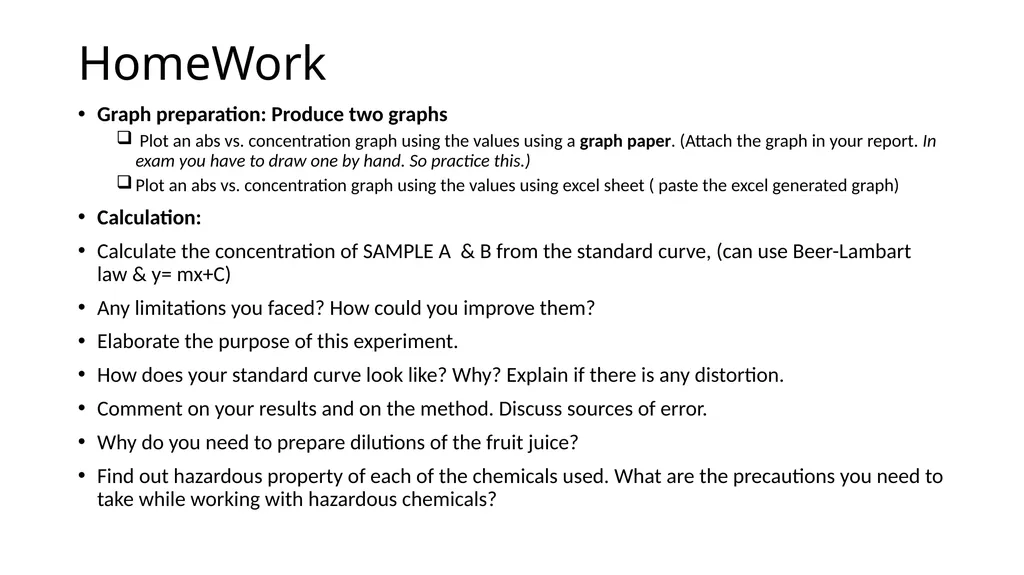
HomeWork Graph preparation: Produce two graphs
Plot an abs vs. concentration graph using the values using a graph paper. (Attach the graph in your report. In exam you have to draw one by hand. So practice this.)
Plot an abs vs. concentration graph using the values using excel sheet ( paste the excel generated graph)
Calculation:
Calculate the concentration of SAMPLE A & B from the standard curve, (can use Beer-Lambart law & y= mx+C)
Any limitations you faced? How could you improve them?
Elaborate the purpose of this experiment.
How does your standard curve look like? Why? Explain if there is any distortion.
Comment on your results and on the method. Discuss sources of error.
Why do you need to prepare dilutions of the fruit juice?
Find out hazardous property of each of the chemicals used. What are the precautions you need to take while working with hazardous chemicals?<br>