Please enjoy this free sample of a complete PowerPoint presentation template. Each presentation template on our site is 100 editable, and you can replace any piece of text, image, icons etc and change color to suit your requirements.
"Please enjoy this free sample of a complete" is the property of its rightful owner. Permission is granted to
download and print the materials on this website for personal, non-commercial use only, and to display it
on your personal computer provided you do not modify the materials and that you retain all copyright
notices contained in the materials. By downloading content from our website, you accept the terms of this
agreement.
Presentation Transcript
01
Please enjoy this free sample of a complete PowerPoint presentation template. Each presentation template on our site is 100% editable, and you can replace any piece of text, image, icons etc and change color to suit your requirements.<br>
02
Airline KPIs Collection of 10+ PowerPoint templates<br>
03
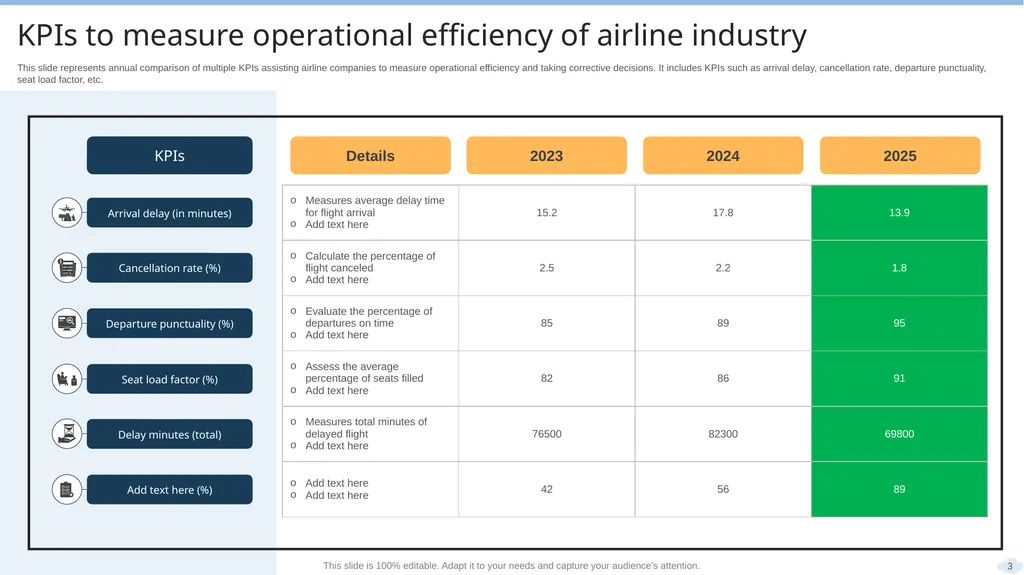
KPIs to measure operational efficiency of airline industry This slide represents annual comparison of multiple KPIs assisting airline companies to measure operational efficiency and taking corrective decisions. It includes KPIs such as arrival delay, cancellation rate, departure punctuality, seat load factor, etc. This slide is 100% editable. Adapt it to your needs and capture your audience's attention. 3<br>
04
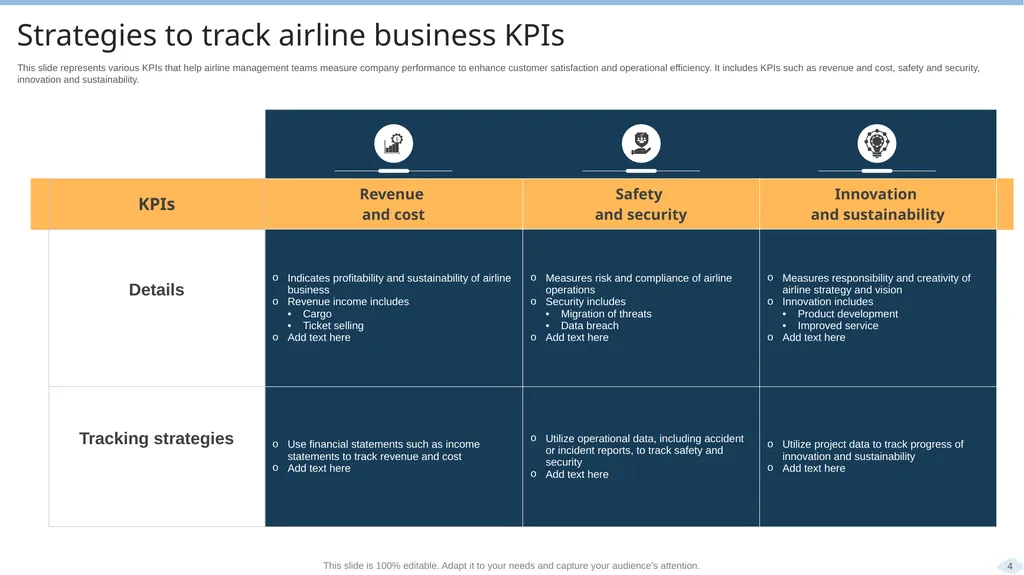
Strategies to track airline business KPIs This slide represents various KPIs that help airline management teams measure company performance to enhance customer satisfaction and operational efficiency. It includes KPIs such as revenue and cost, safety and security, innovation and sustainability. This slide is 100% editable. Adapt it to your needs and capture your audience's attention. 4<br>
05
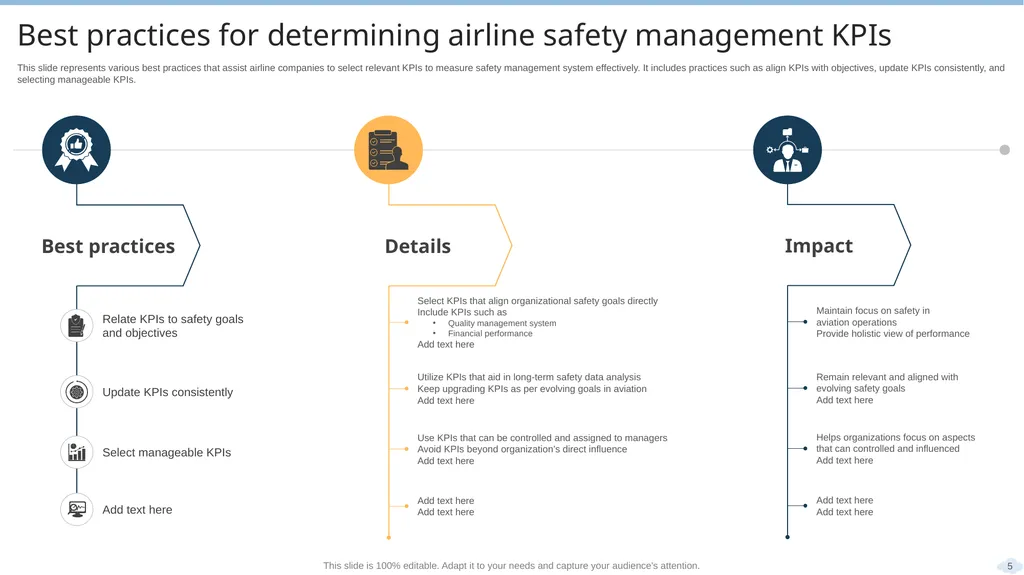
Best practices for determining airline safety management KPIs This slide represents various best practices that assist airline companies to select relevant KPIs to measure safety management system effectively. It includes practices such as align KPIs with objectives, update KPIs consistently, and selecting manageable KPIs. This slide is 100% editable. Adapt it to your needs and capture your audience's attention. 5<br>
06
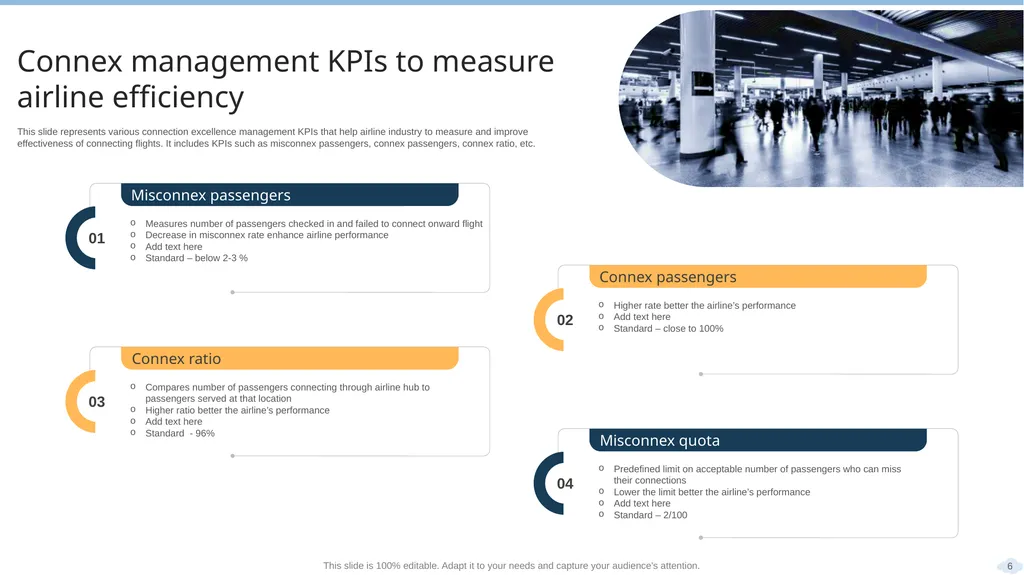
Connex management KPIs to measure airline efficiency This slide represents various connection excellence management KPIs that help airline industry to measure and improve effectiveness of connecting flights. It includes KPIs such as misconnex passengers, connex passengers, connex ratio, etc. This slide is 100% editable. Adapt it to your needs and capture your audience's attention. 6<br>
07
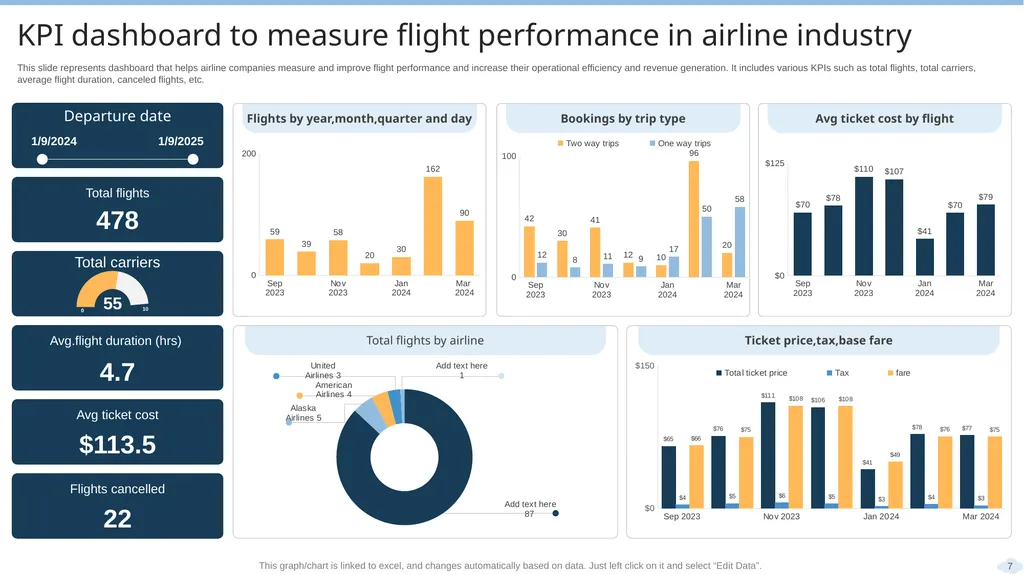
KPI dashboard to measure flight performance in airline industry This slide represents dashboard that helps airline companies measure and improve flight performance and increase their operational efficiency and revenue generation. It includes various KPIs such as total flights, total carriers, average flight duration, canceled flights, etc. This graph/chart is linked to excel, and changes automatically based on data. Just left click on it and select “Edit Data”. 7<br>
08
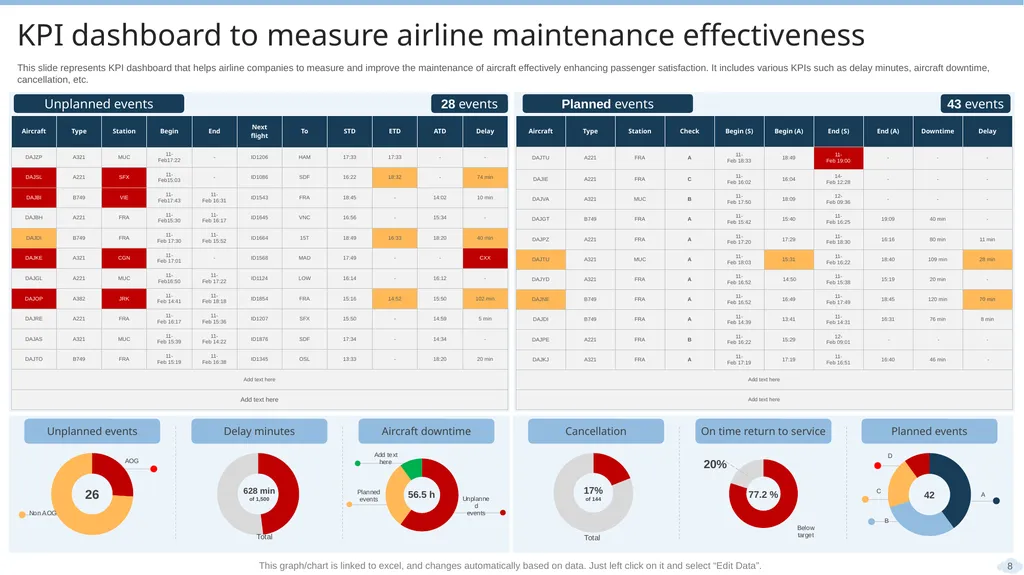
KPI dashboard to measure airline maintenance effectiveness This slide represents KPI dashboard that helps airline companies to measure and improve the maintenance of aircraft effectively enhancing passenger satisfaction. It includes various KPIs such as delay minutes, aircraft downtime, cancellation, etc. This graph/chart is linked to excel, and changes automatically based on data. Just left click on it and select “Edit Data”. 8<br>
09
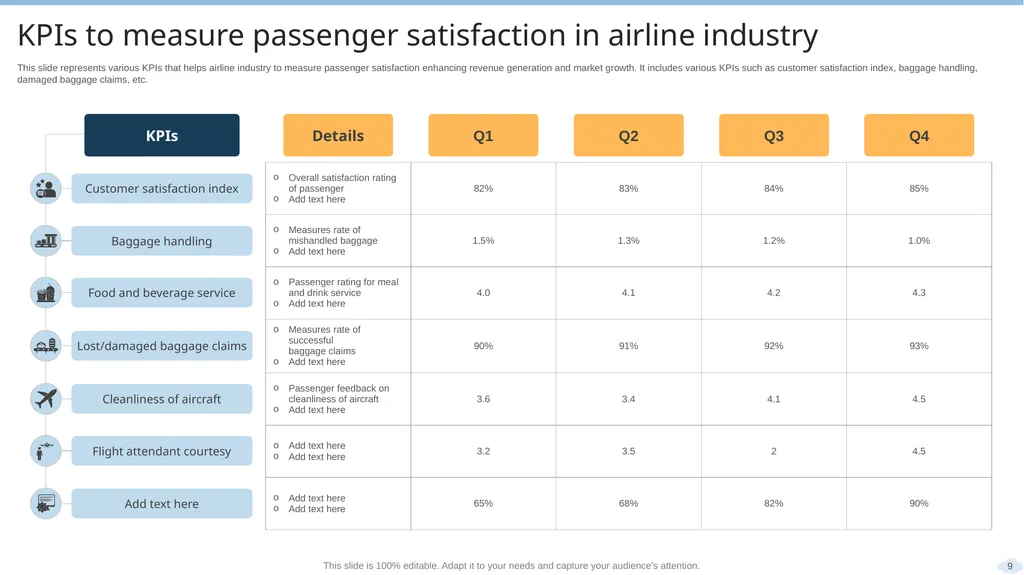
KPIs to measure passenger satisfaction in airline industry This slide represents various KPIs that helps airline industry to measure passenger satisfaction enhancing revenue generation and market growth. It includes various KPIs such as customer satisfaction index, baggage handling, damaged baggage claims, etc. This slide is 100% editable. Adapt it to your needs and capture your audience's attention. 9<br>
10
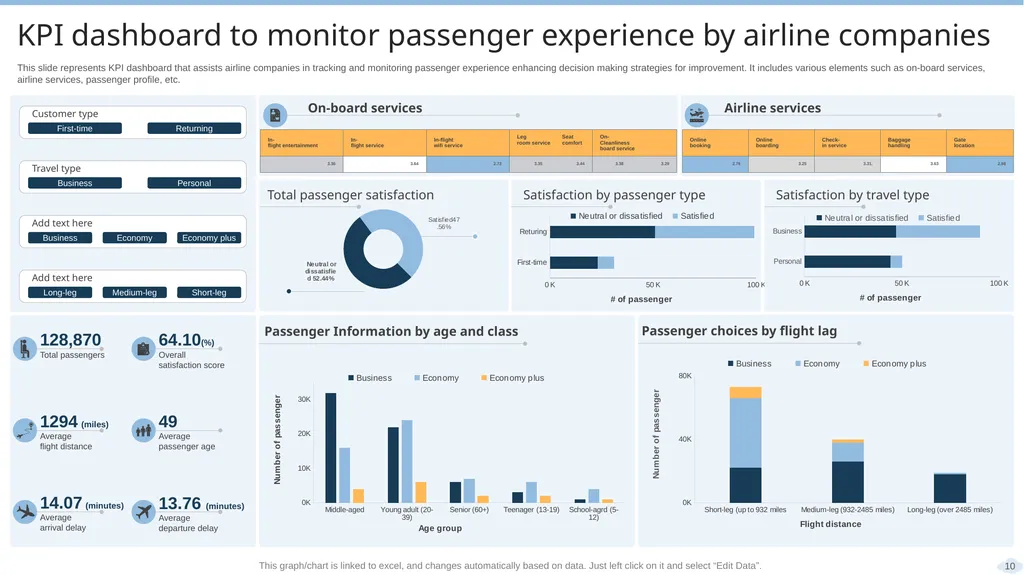
KPI dashboard to monitor passenger experience by airline companies This slide represents KPI dashboard that assists airline companies in tracking and monitoring passenger experience enhancing decision making strategies for improvement. It includes various elements such as on-board services, airline services, passenger profile, etc. This graph/chart is linked to excel, and changes automatically based on data. Just left click on it and select “Edit Data”. 10<br>
11
Airline KPI icon to measure passengers satisfaction 11<br>
12
Operational KPIs icon for airline performance measurement 12<br>