
Profit improvement WEBINAR David Goldstein

Description: Profit improvement WEBINAR David Goldstein President, Mekko Graphics Agenda Profit Snapshot Levers for Improvement Drill Down Profitability trends Competitive comparison Show impact of profit improvement goals on profitability Revenue by
Related Topics
Download Presentation
"Profit improvement WEBINAR David Goldstein" is the property of its rightful owner. Permission is granted to download and print the materials on this website for personal, non-commercial use only, and to display it on your personal computer provided you do not modify the materials and that you retain all copyright notices contained in the materials. By downloading content from our website, you accept the terms of this agreement.
Presentation Transcript
slide1. Profit improvement WEBINAR David Goldstein
President, Mekko Graphics<br>
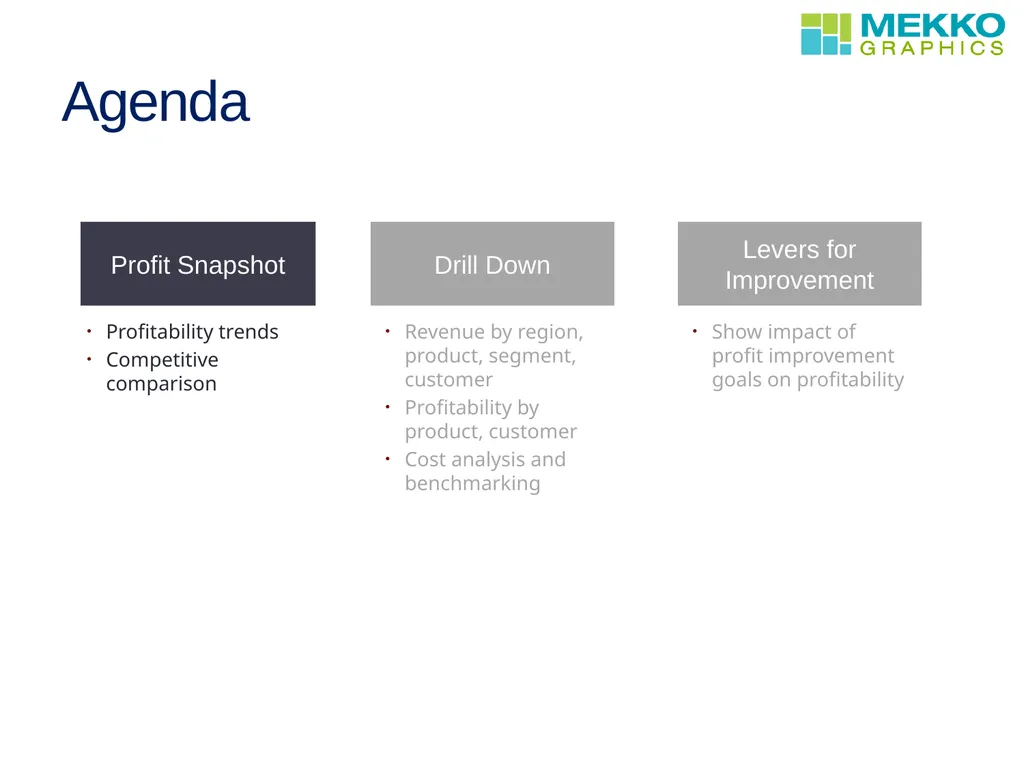
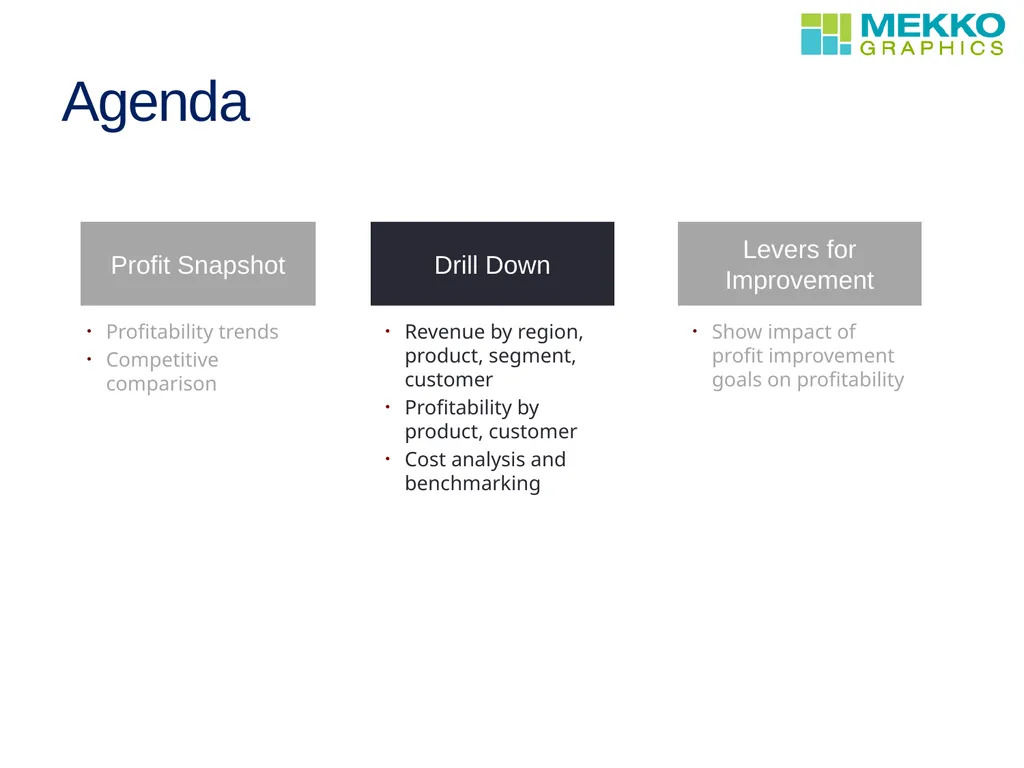
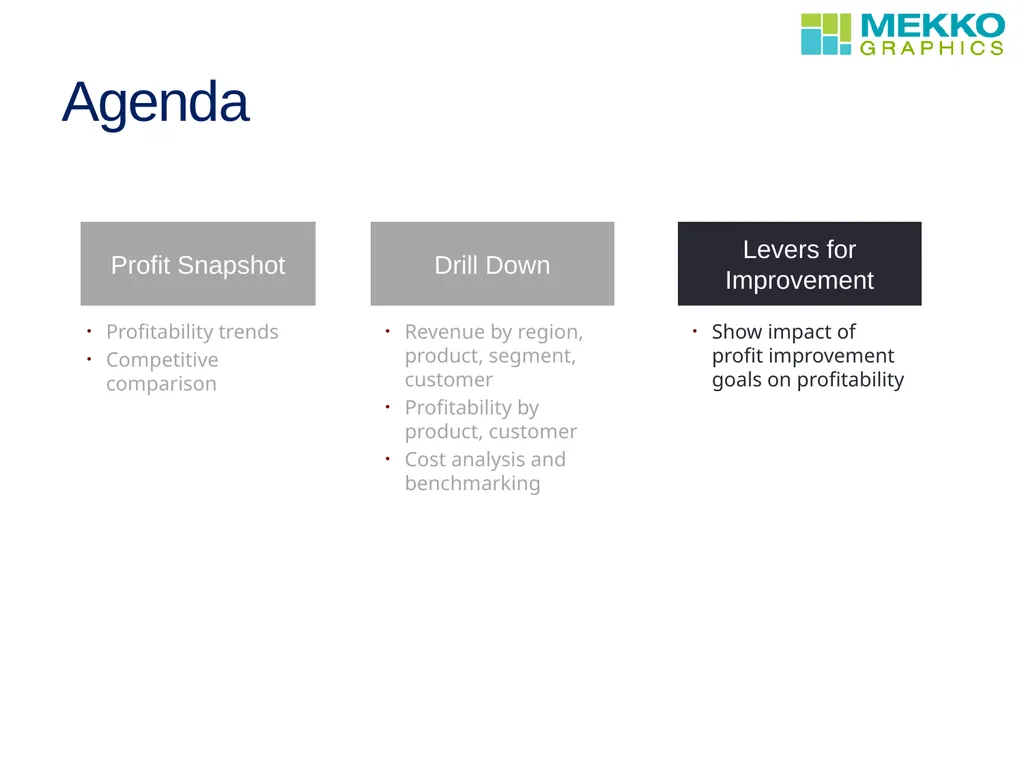
slide2. Agenda Profit Snapshot Levers for Improvement Drill Down Profitability trends
Competitive comparison Show impact of profit improvement goals on profitability Revenue by region, product, segment, customer
Profitability by product, customer
Cost analysis and benchmarking<br>
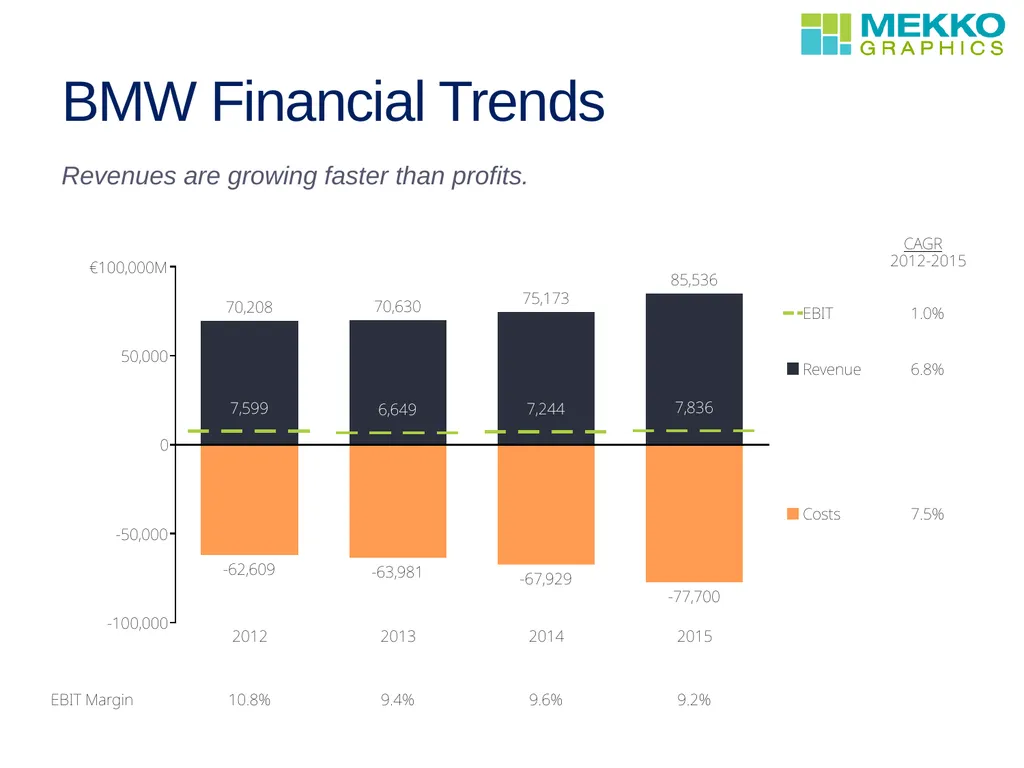
slide3. BMW Financial Trends Revenues are growing faster than profits.<br>
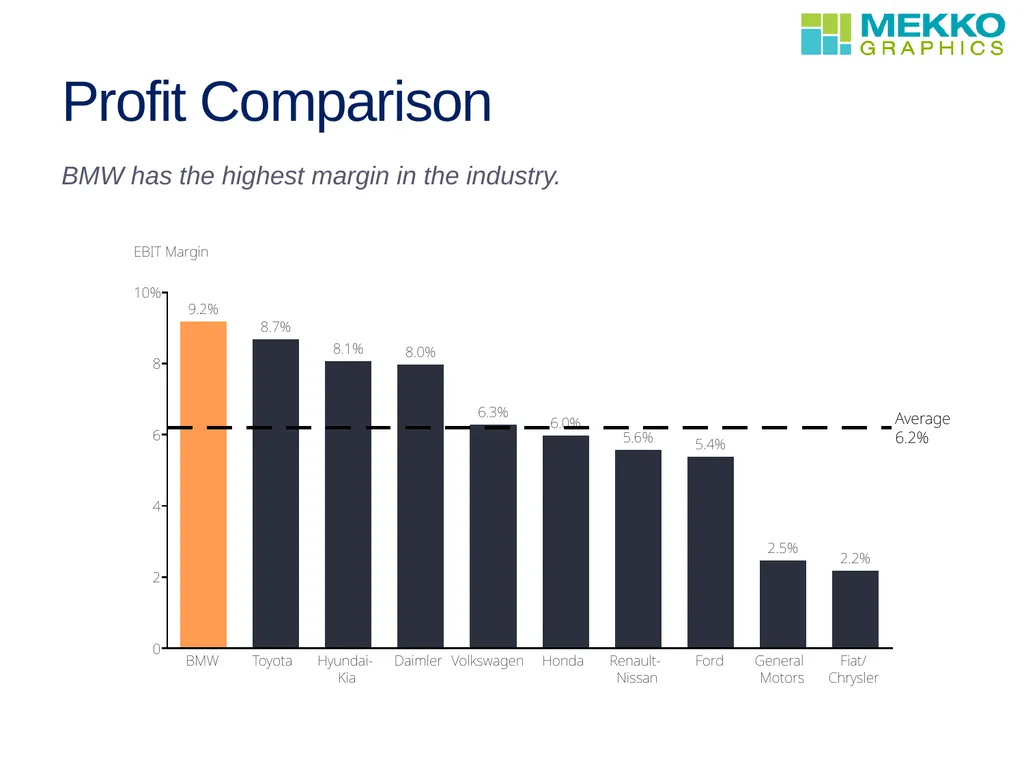
slide4. Profit Comparison BMW has the highest margin in the industry.<br>
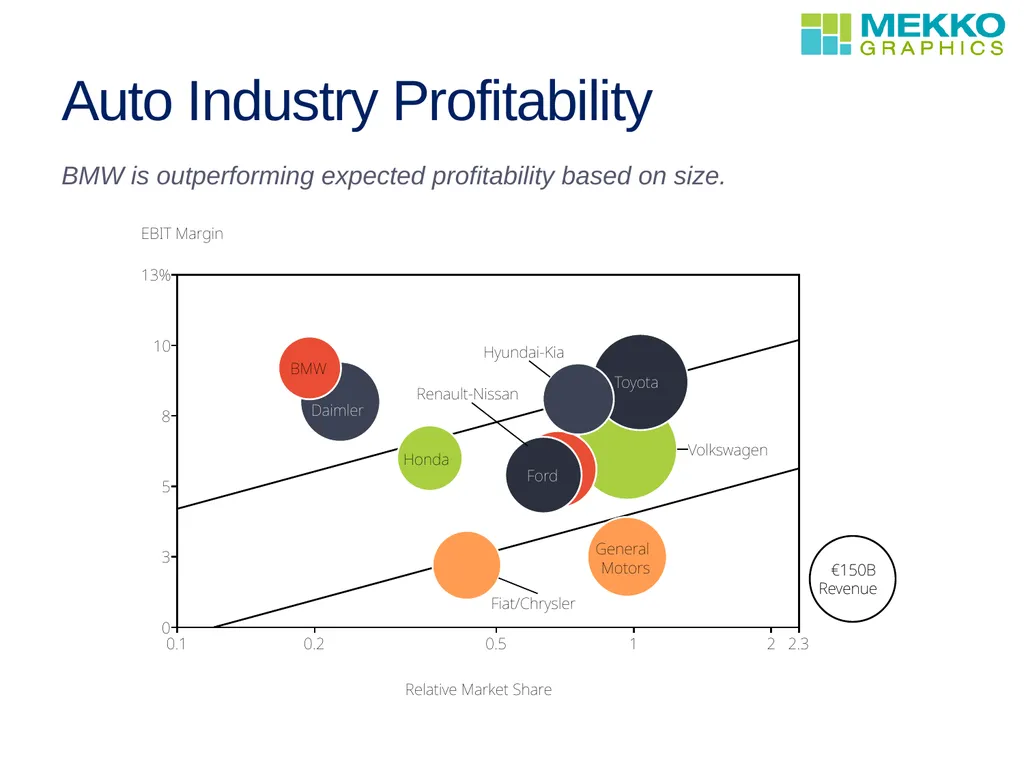
slide5. Auto Industry Profitability BMW is outperforming expected profitability based on size.<br>
slide6. Agenda Profit Snapshot Levers for Improvement Drill Down Profitability trends
Competitive comparison Show impact of profit improvement goals on profitability Revenue by region, product, segment, customer
Profitability by product, customer
Cost analysis and benchmarking<br>
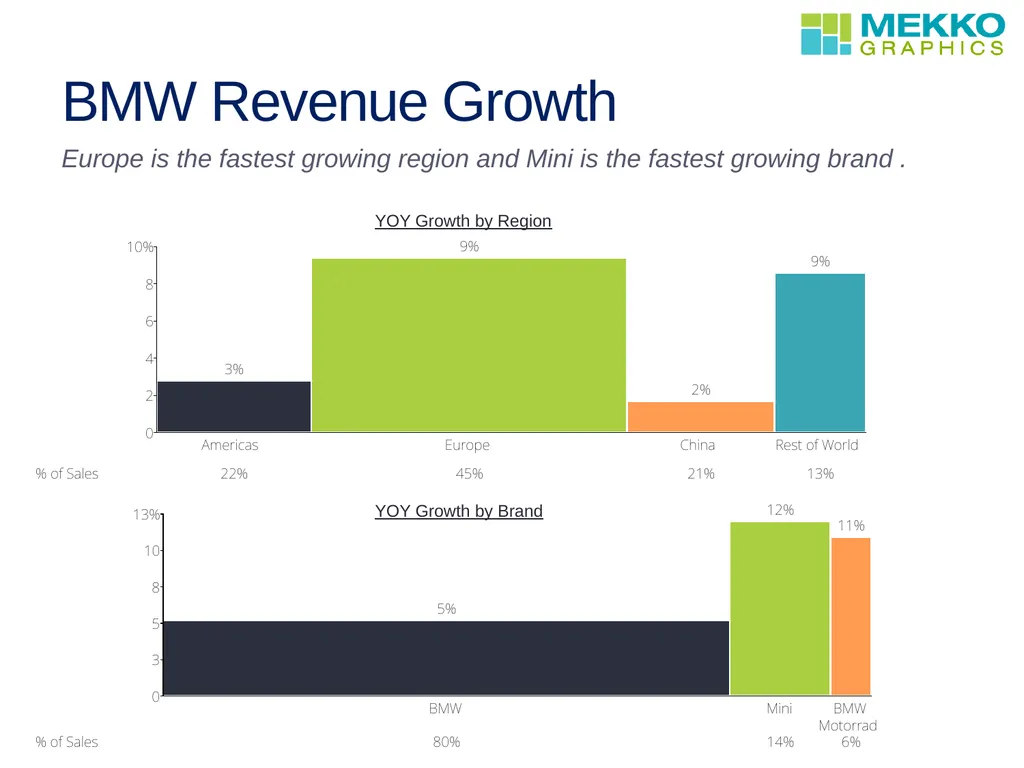
slide7. BMW Revenue Growth Europe is the fastest growing region and Mini is the fastest growing brand . YOY Growth by Region YOY Growth by Brand<br>
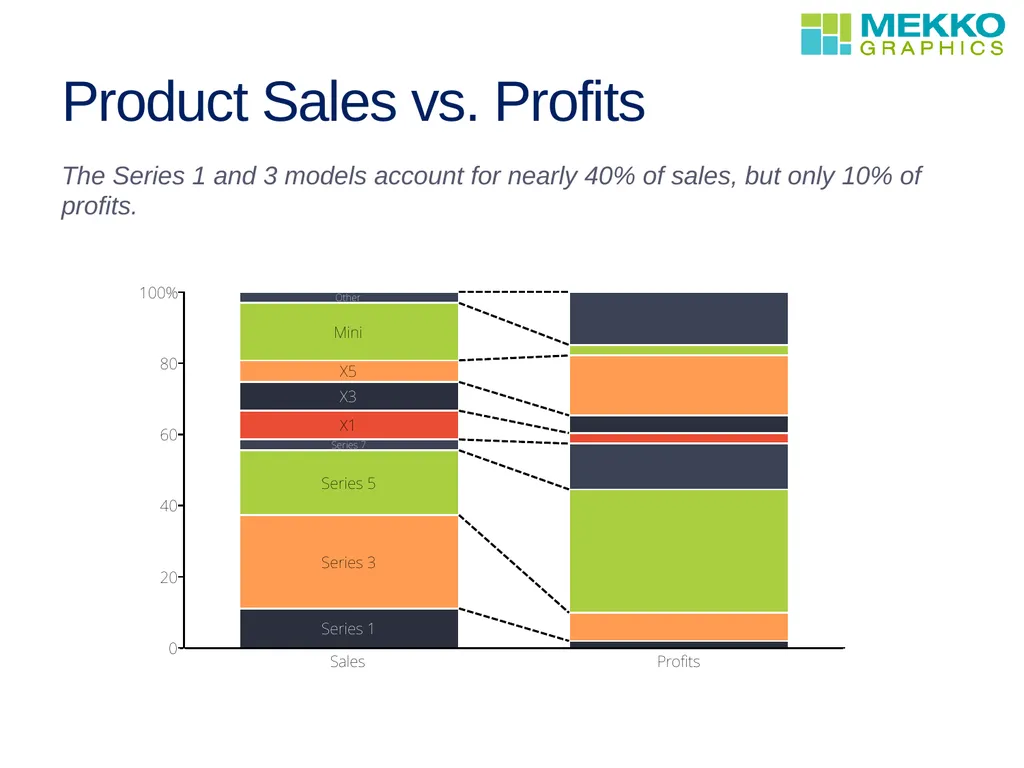
slide8. Product Sales vs. Profits The Series 1 and 3 models account for nearly 40% of sales, but only 10% of profits.<br>
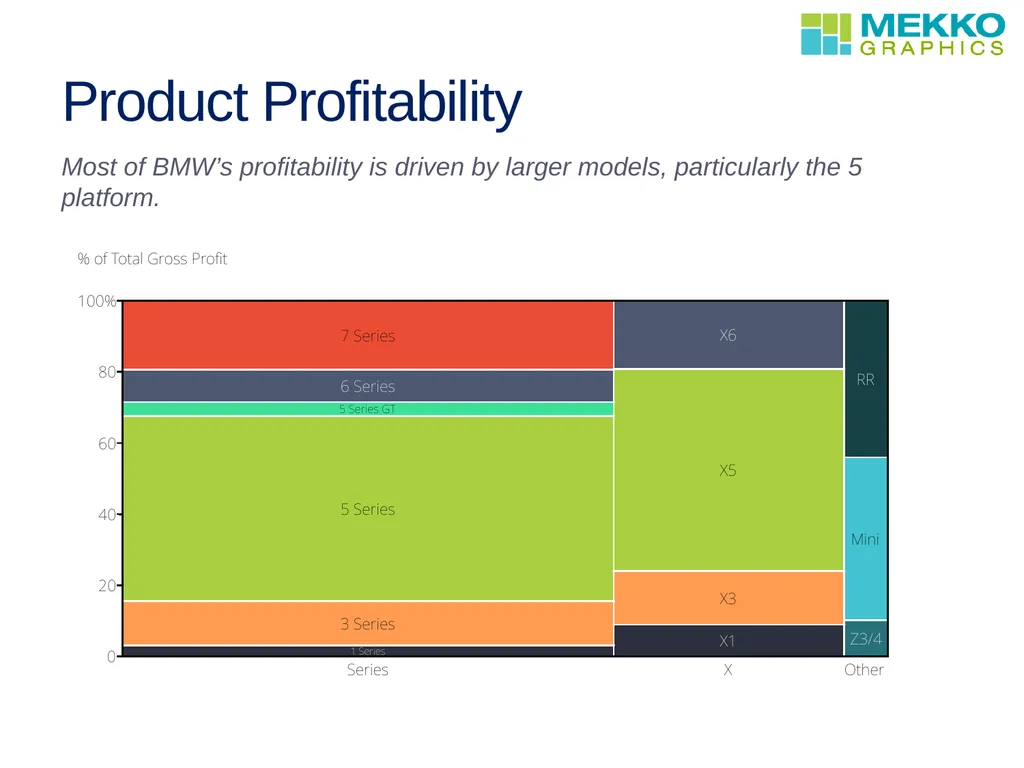
slide9. Product Profitability Most of BMW’s profitability is driven by larger models, particularly the 5 platform.<br>
slide10. Agenda Profit Snapshot Levers for Improvement Drill Down Profitability trends
Competitive comparison Show impact of profit improvement goals on profitability Revenue by region, product, segment, customer
Profitability by product, customer
Cost analysis and benchmarking<br>
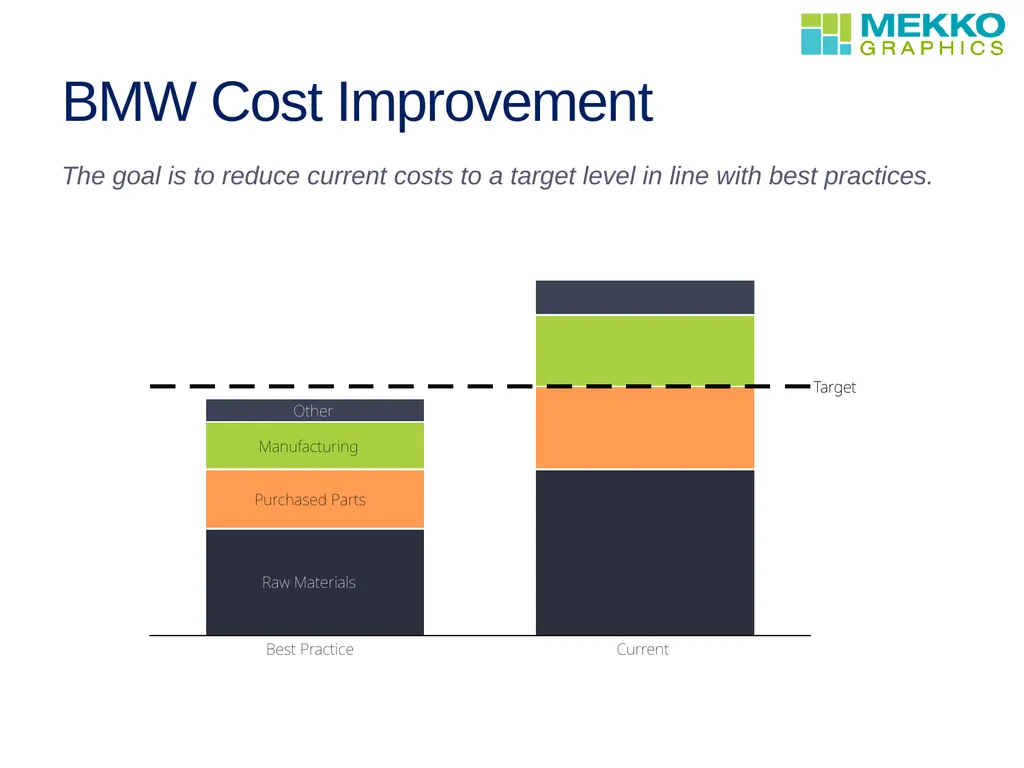
slide11. BMW Cost Improvement The goal is to reduce current costs to a target level in line with best practices.<br>
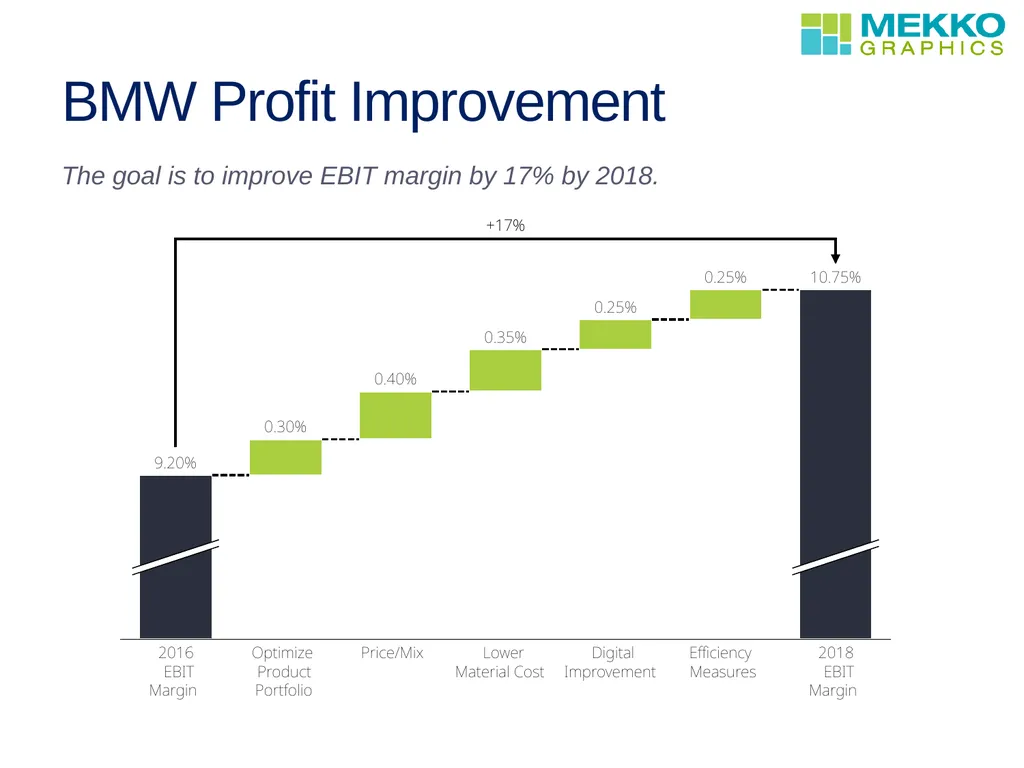
slide12. BMW Profit Improvement The goal is to improve EBIT margin by 17% by 2018.<br>
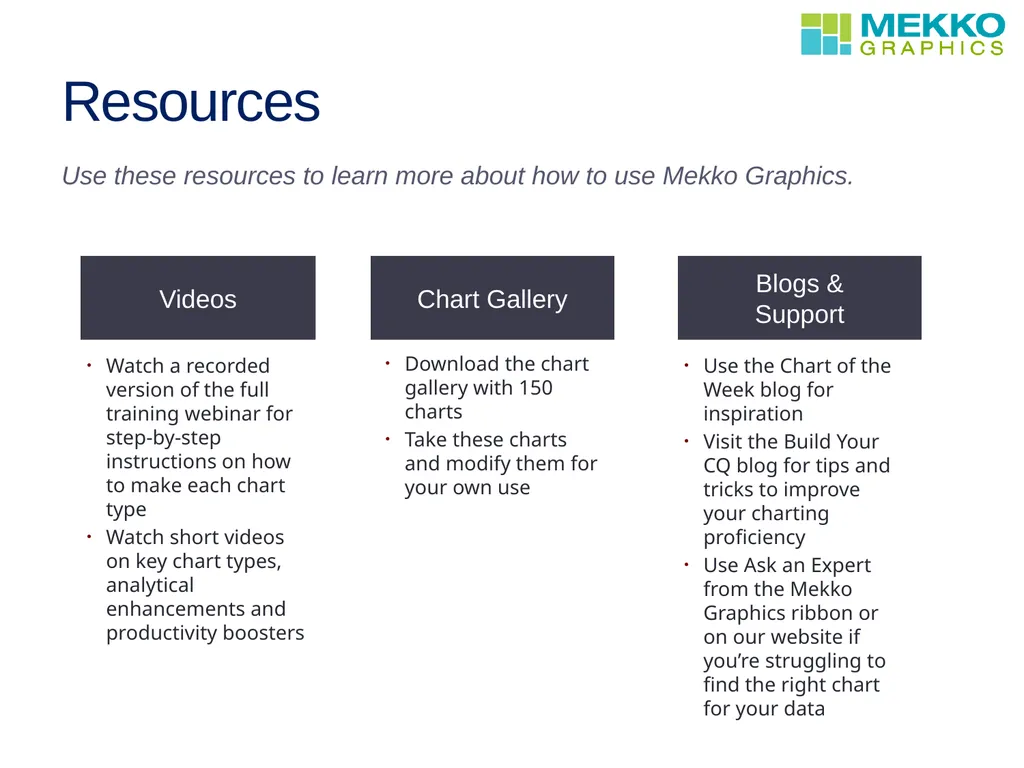
slide13. Resources Use these resources to learn more about how to use Mekko Graphics. Videos Blogs &
Support Chart Gallery Watch a recorded version of the full training webinar for step-by-step instructions on how to make each chart type
Watch short videos on key chart types, analytical enhancements and productivity boosters Use the Chart of the Week blog for inspiration
Visit the Build Your CQ blog for tips and tricks to improve your charting proficiency
Use Ask an Expert from the Mekko Graphics ribbon or on our website if you’re struggling to find the right chart for your data Download the chart gallery with 150 charts
Take these charts and modify them for your own use<br>
President, Mekko Graphics<br>
slide2. Agenda Profit Snapshot Levers for Improvement Drill Down Profitability trends
Competitive comparison Show impact of profit improvement goals on profitability Revenue by region, product, segment, customer
Profitability by product, customer
Cost analysis and benchmarking<br>
slide3. BMW Financial Trends Revenues are growing faster than profits.<br>
slide4. Profit Comparison BMW has the highest margin in the industry.<br>
slide5. Auto Industry Profitability BMW is outperforming expected profitability based on size.<br>
slide6. Agenda Profit Snapshot Levers for Improvement Drill Down Profitability trends
Competitive comparison Show impact of profit improvement goals on profitability Revenue by region, product, segment, customer
Profitability by product, customer
Cost analysis and benchmarking<br>
slide7. BMW Revenue Growth Europe is the fastest growing region and Mini is the fastest growing brand . YOY Growth by Region YOY Growth by Brand<br>
slide8. Product Sales vs. Profits The Series 1 and 3 models account for nearly 40% of sales, but only 10% of profits.<br>
slide9. Product Profitability Most of BMW’s profitability is driven by larger models, particularly the 5 platform.<br>
slide10. Agenda Profit Snapshot Levers for Improvement Drill Down Profitability trends
Competitive comparison Show impact of profit improvement goals on profitability Revenue by region, product, segment, customer
Profitability by product, customer
Cost analysis and benchmarking<br>
slide11. BMW Cost Improvement The goal is to reduce current costs to a target level in line with best practices.<br>
slide12. BMW Profit Improvement The goal is to improve EBIT margin by 17% by 2018.<br>
slide13. Resources Use these resources to learn more about how to use Mekko Graphics. Videos Blogs &
Support Chart Gallery Watch a recorded version of the full training webinar for step-by-step instructions on how to make each chart type
Watch short videos on key chart types, analytical enhancements and productivity boosters Use the Chart of the Week blog for inspiration
Visit the Build Your CQ blog for tips and tricks to improve your charting proficiency
Use Ask an Expert from the Mekko Graphics ribbon or on our website if you’re struggling to find the right chart for your data Download the chart gallery with 150 charts
Take these charts and modify them for your own use<br>