Puget Lowland Ecoregion Streams Status Trends Brandi Lubliner, SAM Coordinator; Rich Sheibley, USGS; Curtis DeGasperi, King County; Chad Larson, Ecology; Leska Fore, Puget Sound Partnership Study questions: Q1: What percent of streams
"Puget Lowland Ecoregion Streams Status & Trends" is the property of its rightful owner. Permission is granted to
download and print the materials on this website for personal, non-commercial use only, and to display it
on your personal computer provided you do not modify the materials and that you retain all copyright
notices contained in the materials. By downloading content from our website, you accept the terms of this
agreement.
Presentation Transcript
01
Puget Lowland Ecoregion Streams Status & Trends Brandi Lubliner, SAM Coordinator; Rich Sheibley, USGS; Curtis DeGasperi, King County; Chad Larson, Ecology; Leska Fore, Puget Sound Partnership<br>
02
Study questions: Q1: What percent of streams meet biological, water, and sediment quality standards for beneficial uses within and outside urban growth areas (UGAs)?
Q2 & Q3: What natural and human variables correlate with the status of streams within and outside the UGA?
Q4: How do SAM results compare to other monitoring programs in Puget Sound?
Q5: What parameters would be carried forward for trend assessment of SAM stream monitoring in the future, and at what timing and frequency?<br>
03
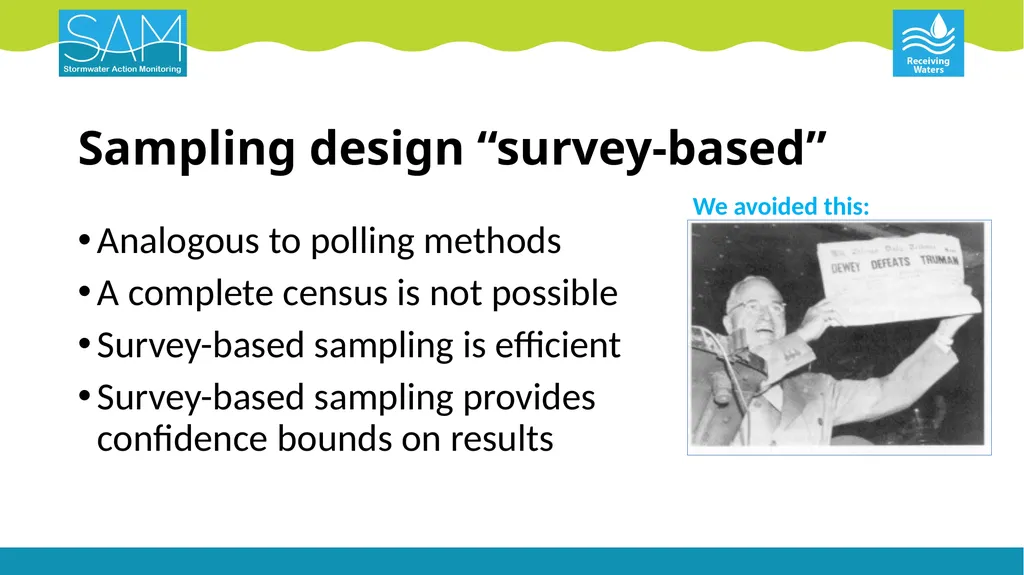
Sampling design “survey-based” Analogous to polling methods
A complete census is not possible
Survey-based sampling is efficient
Survey-based sampling provides confidence bounds on results We avoided this:<br>
04
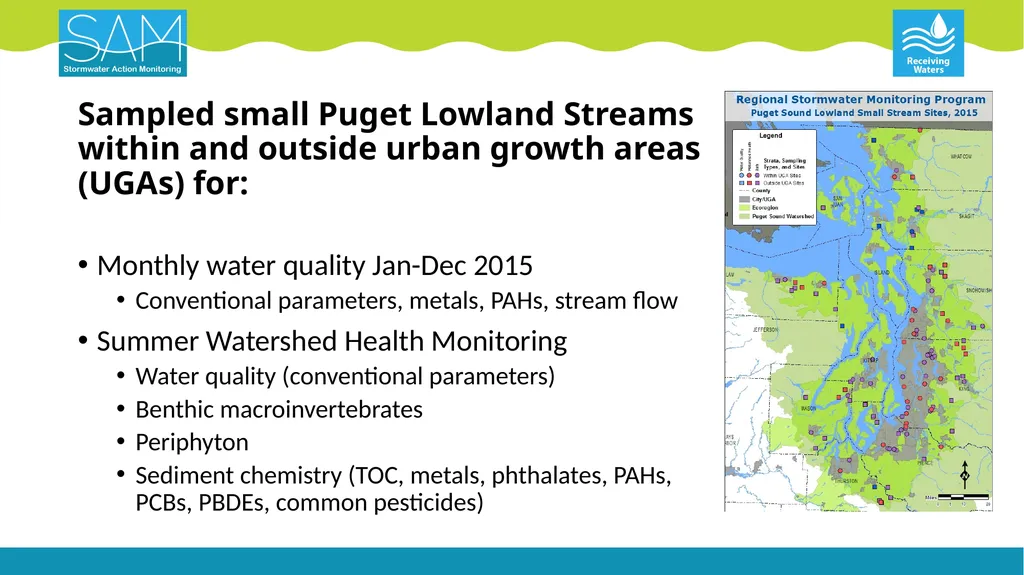
Sampled small Puget Lowland Streams within and outside urban growth areas (UGAs) for: Monthly water quality Jan-Dec 2015
Conventional parameters, metals, PAHs, stream flow
Summer Watershed Health Monitoring
Water quality (conventional parameters)
Benthic macroinvertebrates
Periphyton
Sediment chemistry (TOC, metals, phthalates, PAHs, PCBs, PBDEs, common pesticides)<br>
05
Included watershed and riparian GIS analysis Leveraged USGS NAWQA expertise (and USGS $) to derive land cover and other landscape parameters for all SAM PLES sites and 16 least-disturbed reference sites
Why? Because local riparian and upstream land cover shown to be important factor for biological communities<br>
06
Land cover summary within and outside UGAs<br>
07
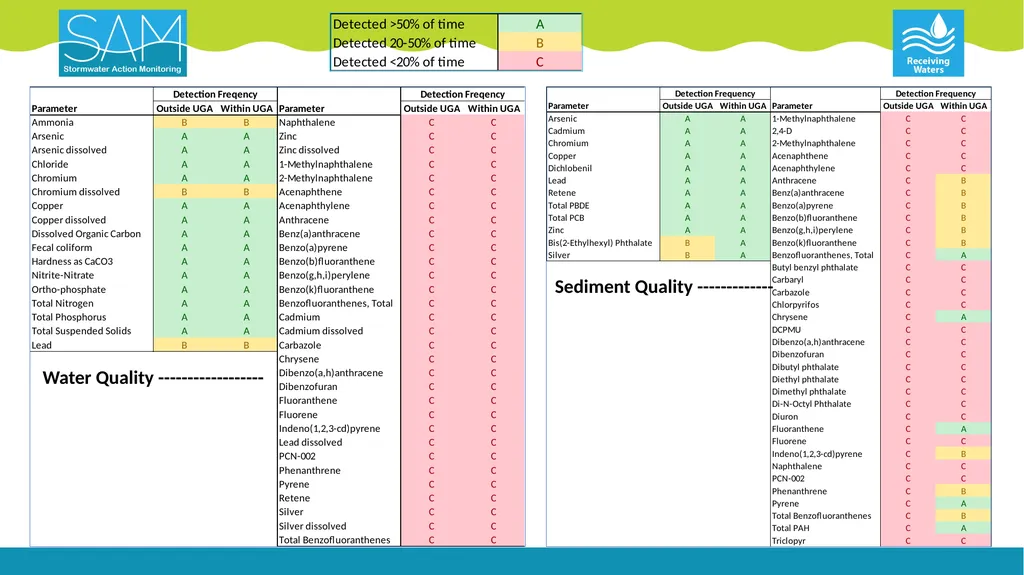
Water Quality ------------------ Sediment Quality -------------<br>
08
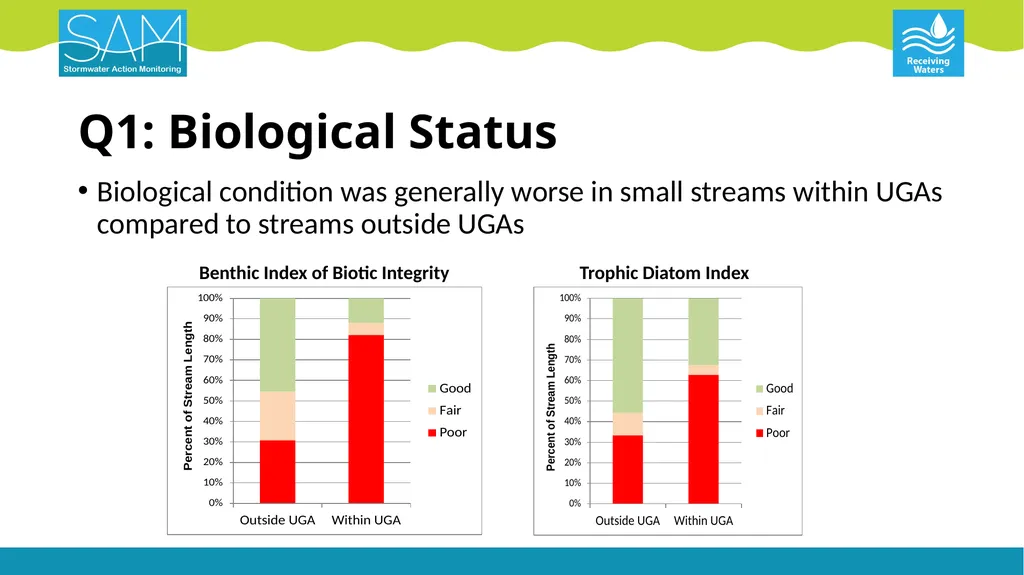
Q1: Biological Status Biological condition was generally worse in small streams within UGAs compared to streams outside UGAs Benthic Index of Biotic Integrity Trophic Diatom Index<br>
09
Q1: Comparison to water quality standards Higher frequency of exceedance of fecal coliform standard at sites within UGAs
Similar frequency of exceedance of temperature, pH, and dissolved oxygen standards at sites within and outside of UGAs
Measured metals concentrations did not typically exceed relevant acute or chronic standards for the protection of aquatic life.<br>
10
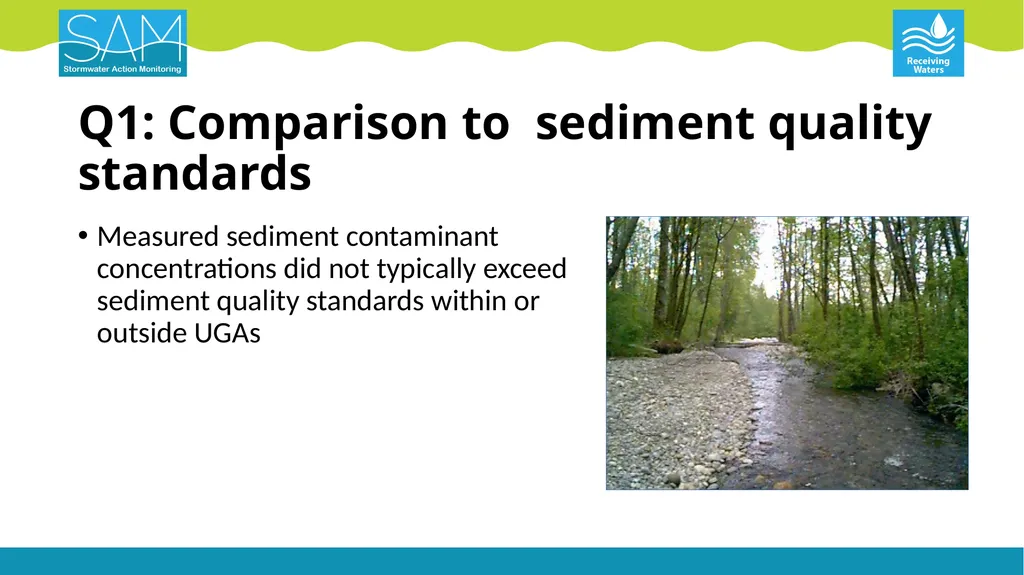
Q1: Comparison to sediment quality standards Measured sediment contaminant concentrations did not typically exceed sediment quality standards within or outside UGAs<br>
11
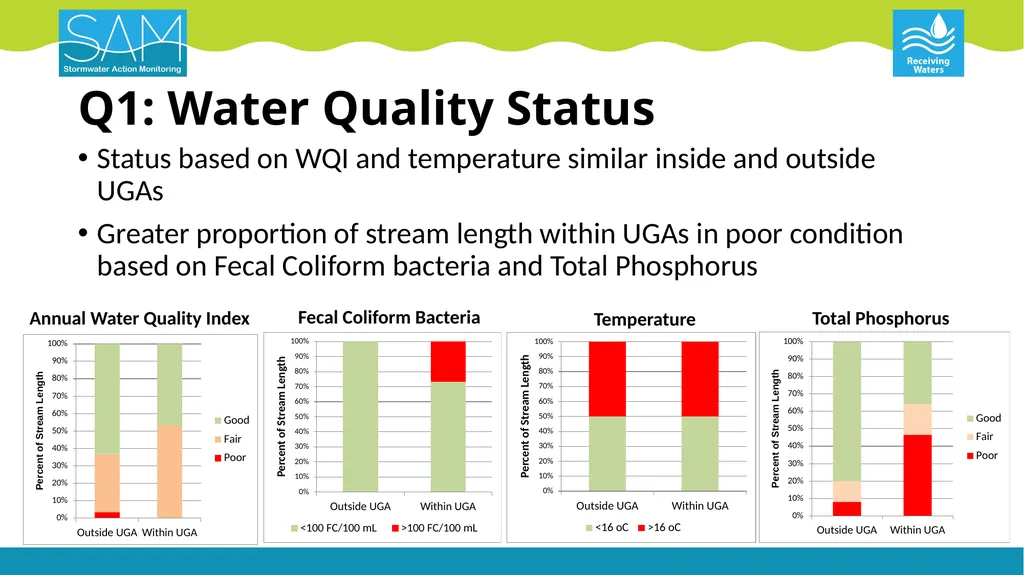
Q1: Water Quality Status Status based on WQI and temperature similar inside and outside UGAs
Greater proportion of stream length within UGAs in poor condition based on Fecal Coliform bacteria and Total Phosphorus Annual Water Quality Index Fecal Coliform Bacteria Temperature Total Phosphorus<br>
12
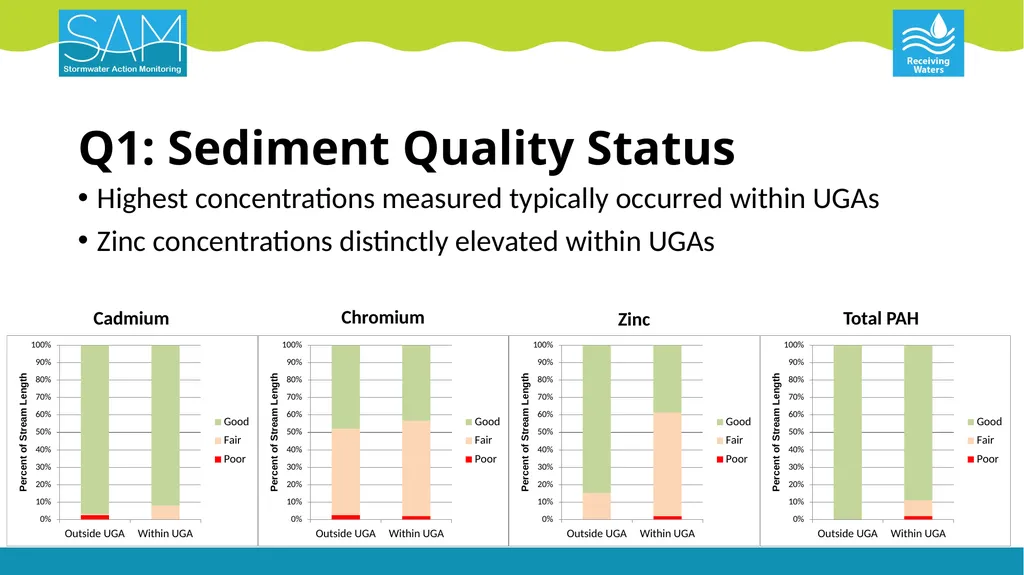
Q1: Sediment Quality Status Highest concentrations measured typically occurred within UGAs
Zinc concentrations distinctly elevated within UGAs Cadmium Chromium Zinc Total PAH<br>
13
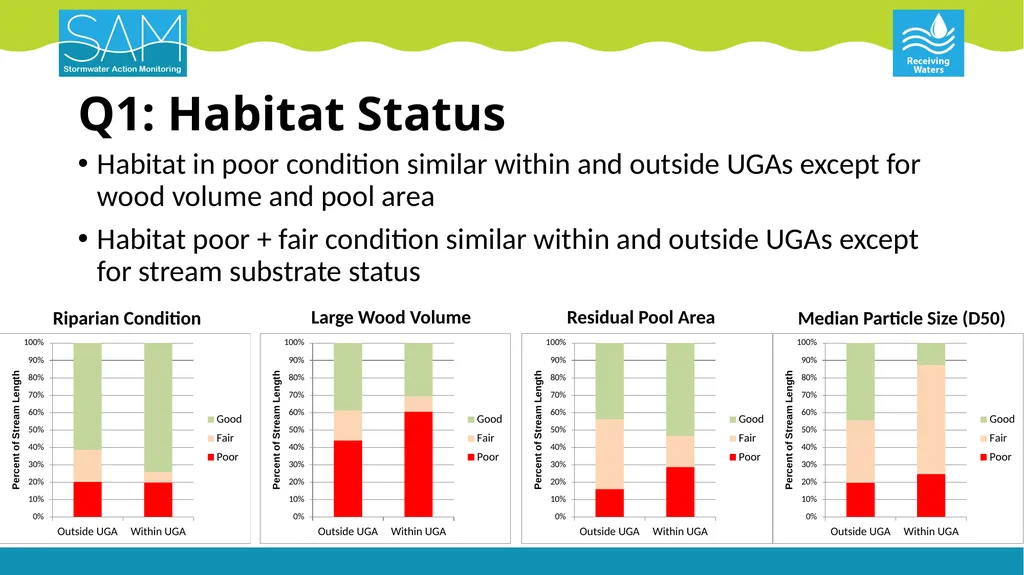
Q1: Habitat Status Habitat in poor condition similar within and outside UGAs except for wood volume and pool area
Habitat poor + fair condition similar within and outside UGAs except for stream substrate status Riparian Condition Large Wood Volume Residual Pool Area Median Particle Size (D50)<br>
14
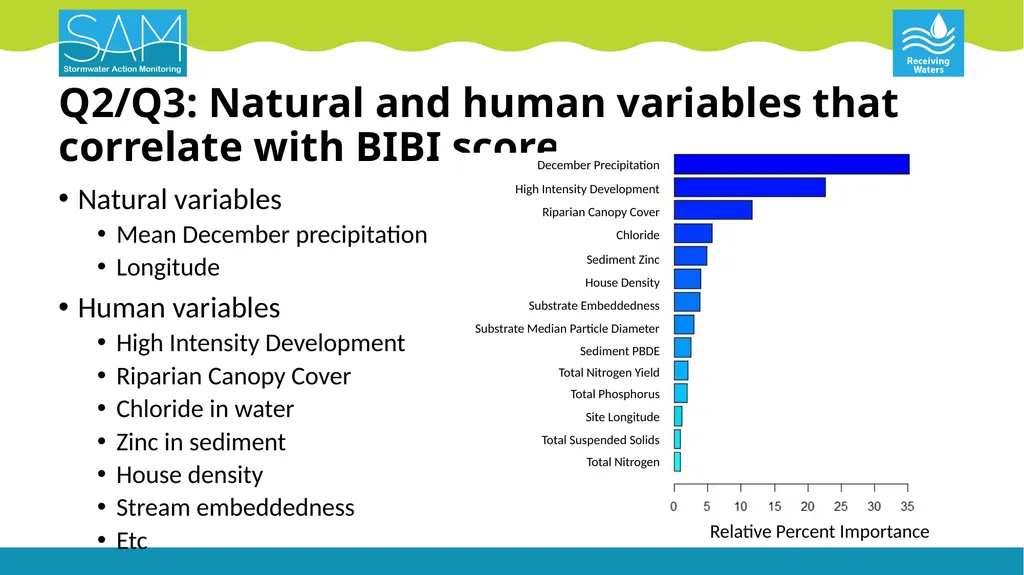
Natural variables
Mean December precipitation
Longitude
Human variables
High Intensity Development
Riparian Canopy Cover
Chloride in water
Zinc in sediment
House density
Stream embeddedness
Etc Q2/Q3: Natural and human variables that correlate with BIBI scores Relative Percent Importance December Precipitation
High Intensity Development
Riparian Canopy Cover
Chloride
Sediment Zinc
House Density
Substrate Embeddedness
Substrate Median Particle Diameter
Sediment PBDE
Total Nitrogen Yield
Total Phosphorus
Site Longitude
Total Suspended Solids
Total Nitrogen<br>
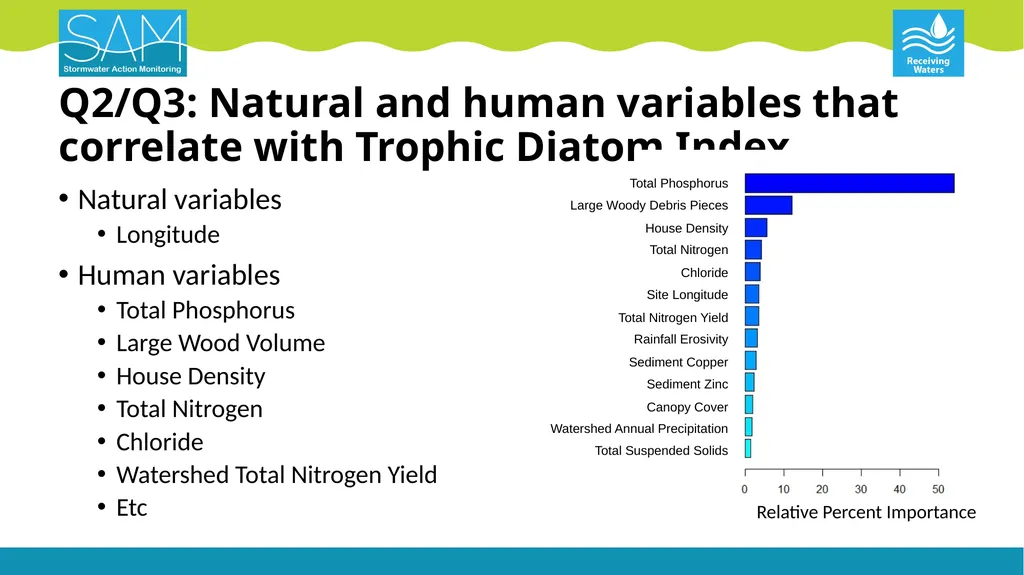
15
Natural variables
Longitude
Human variables
Total Phosphorus
Large Wood Volume
House Density
Total Nitrogen
Chloride
Watershed Total Nitrogen Yield
Etc Q2/Q3: Natural and human variables that correlate with Trophic Diatom Index Relative Percent Importance Total Phosphorus
Large Woody Debris Pieces
House Density
Total Nitrogen
Chloride
Site Longitude
Total Nitrogen Yield
Rainfall Erosivity
Sediment Copper
Sediment Zinc
Canopy Cover
Watershed Annual Precipitation
Total Suspended Solids<br>
16
Work on answering remaining questions in progress Q4: How does SAM results compare to other monitoring programs in Puget Sound?
Q5: What parameters would be carried forward for trend assessment of SAM stream monitoring in the future, and at what timing and frequency?<br>
17
SAM Puget Lowlands Streams Status & Trends Current Schedule Draft report in progress
Compete draft report for review by August 2017
Final report completed by December 2017<br>