
Python for Data Analysis Research Computing
Description: Python for Data Analysis Research Computing Services Katia Oleinik (koleinikbu.edu) Tutorial Content 2 Overview of Python Libraries for Data Scientists Reading Data; Selecting and Filtering the Data; Data manipulation, sorting, grouping,
Related Topics
Download Presentation
"Python for Data Analysis Research Computing" is the property of its rightful owner. Permission is granted to download and print the materials on this website for personal, non-commercial use only, and to display it on your personal computer provided you do not modify the materials and that you retain all copyright notices contained in the materials. By downloading content from our website, you accept the terms of this agreement.
Presentation Transcript
slide1. Python for Data Analysis Research Computing Services
Katia Oleinik (koleinik@bu.edu)<br>
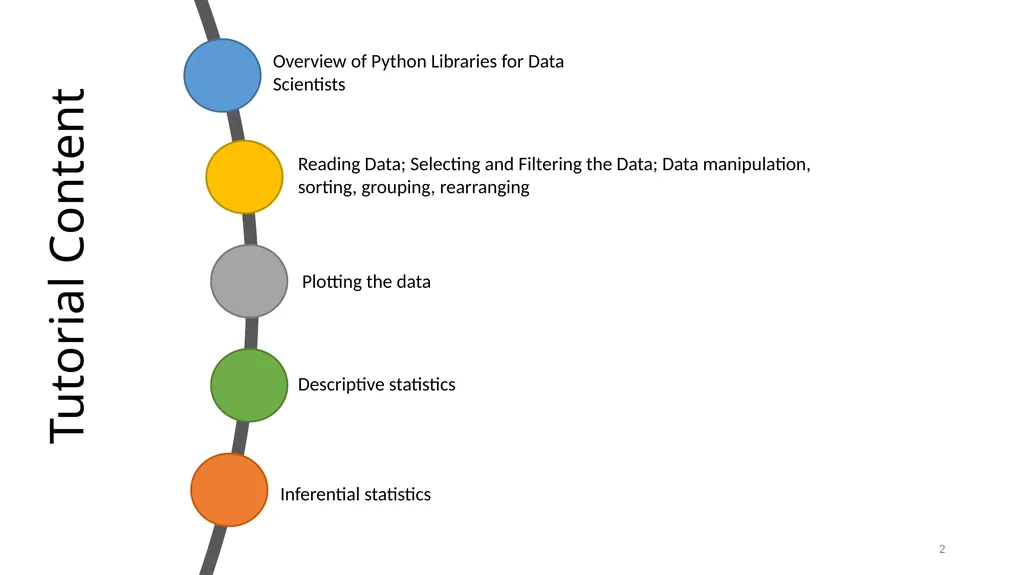
slide2. Tutorial Content 2 Overview of Python Libraries for Data Scientists Reading Data; Selecting and Filtering the Data; Data manipulation, sorting, grouping, rearranging Plotting the data Descriptive statistics Inferential statistics<br>
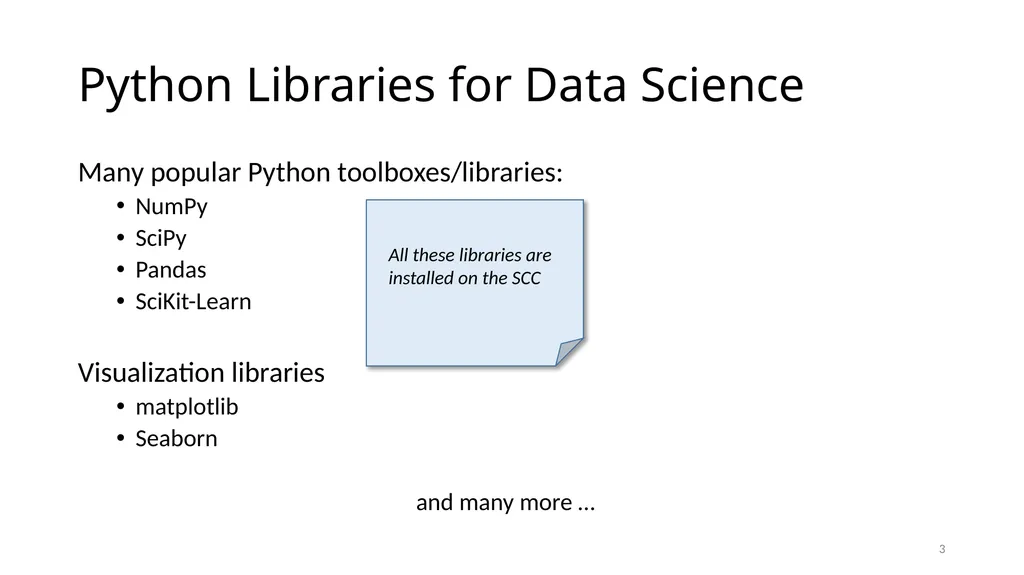
slide3. Python Libraries for Data Science Many popular Python toolboxes/libraries:
NumPy
SciPy
Pandas
SciKit-Learn
Visualization libraries
matplotlib
Seaborn
and many more … 3 All these libraries are installed on the SCC<br>
slide4. Python Libraries for Data Science NumPy:
introduces objects for multidimensional arrays and matrices, as well as functions that allow to easily perform advanced mathematical and statistical operations on those objects
provides vectorization of mathematical operations on arrays and matrices which significantly improves the performance
many other python libraries are built on NumPy 4 Link: http://www.numpy.org/<br>
slide5. Python Libraries for Data Science SciPy:
collection of algorithms for linear algebra, differential equations, numerical integration, optimization, statistics and more
part of SciPy Stack
built on NumPy 5 Link: https://www.scipy.org/scipylib/<br>
slide6. Python Libraries for Data Science Pandas:
adds data structures and tools designed to work with table-like data (similar to Series and Data Frames in R)
provides tools for data manipulation: reshaping, merging, sorting, slicing, aggregation etc.
allows handling missing data 6 Link: http://pandas.pydata.org/<br>
slide7. Link: http://scikit-learn.org/ Python Libraries for Data Science SciKit-Learn:
provides machine learning algorithms: classification, regression, clustering, model validation etc.
built on NumPy, SciPy and matplotlib 7<br>
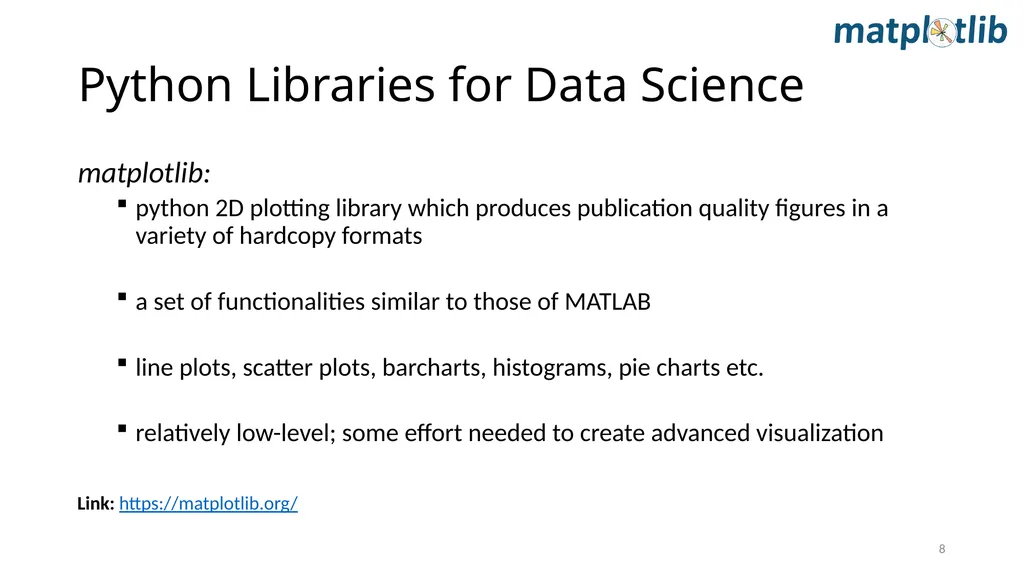
slide8. matplotlib:
python 2D plotting library which produces publication quality figures in a variety of hardcopy formats
a set of functionalities similar to those of MATLAB
line plots, scatter plots, barcharts, histograms, pie charts etc.
relatively low-level; some effort needed to create advanced visualization Link: https://matplotlib.org/ Python Libraries for Data Science 8<br>
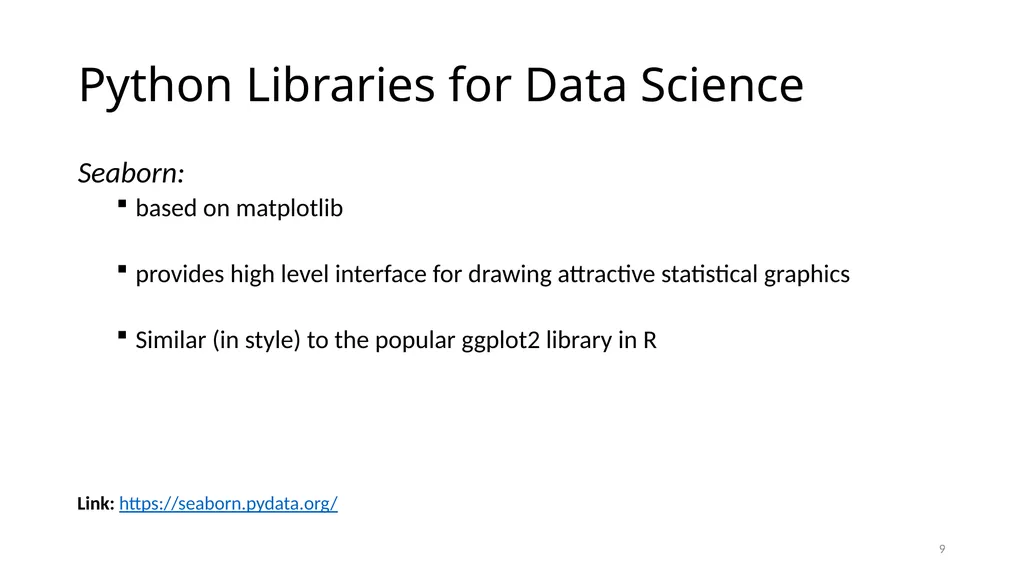
slide9. Seaborn:
based on matplotlib
provides high level interface for drawing attractive statistical graphics
Similar (in style) to the popular ggplot2 library in R Link: https://seaborn.pydata.org/ Python Libraries for Data Science 9<br>
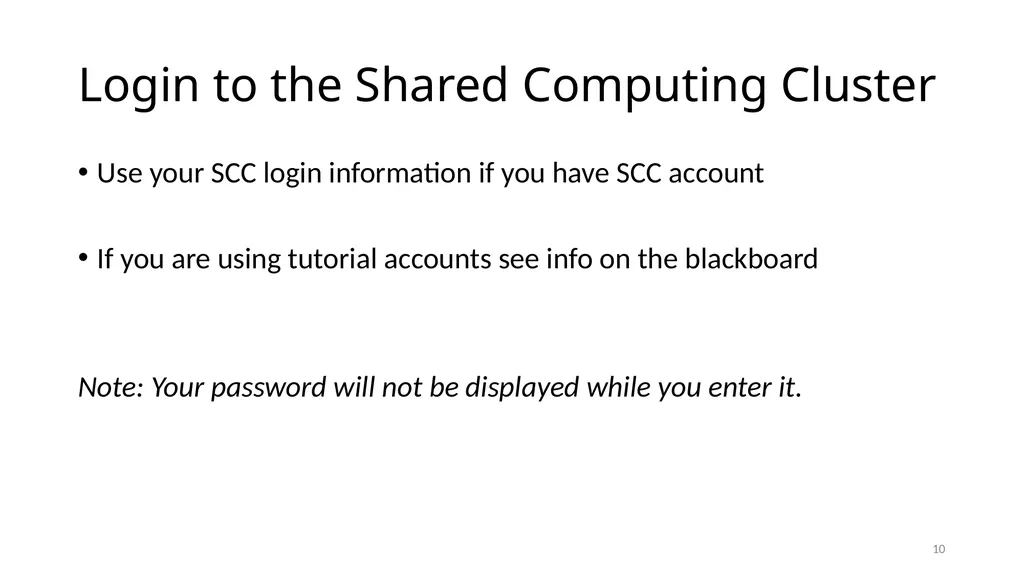
slide10. Login to the Shared Computing Cluster Use your SCC login information if you have SCC account
If you are using tutorial accounts see info on the blackboard
Note: Your password will not be displayed while you enter it. 10<br>
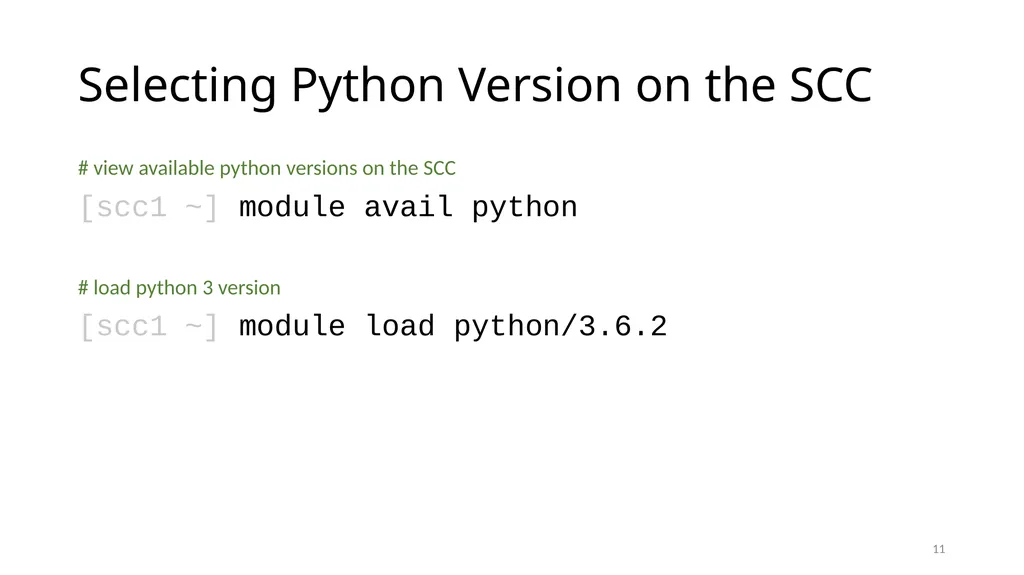
slide11. Selecting Python Version on the SCC # view available python versions on the SCC
[scc1 ~] module avail python
# load python 3 version
[scc1 ~] module load python/3.6.2 11<br>
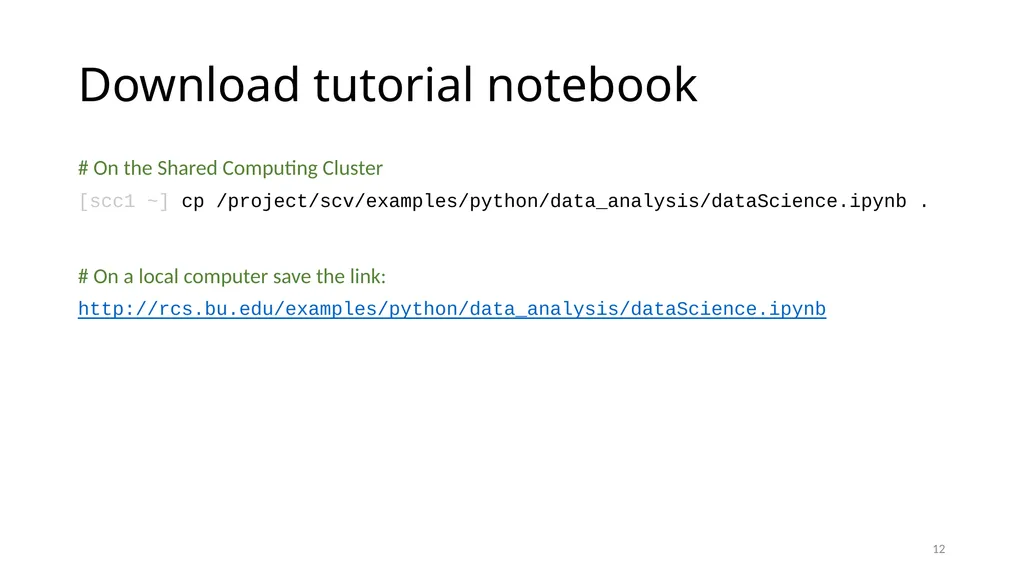
slide12. Download tutorial notebook # On the Shared Computing Cluster
[scc1 ~] cp /project/scv/examples/python/data_analysis/dataScience.ipynb .
# On a local computer save the link:
http://rcs.bu.edu/examples/python/data_analysis/dataScience.ipynb 12<br>
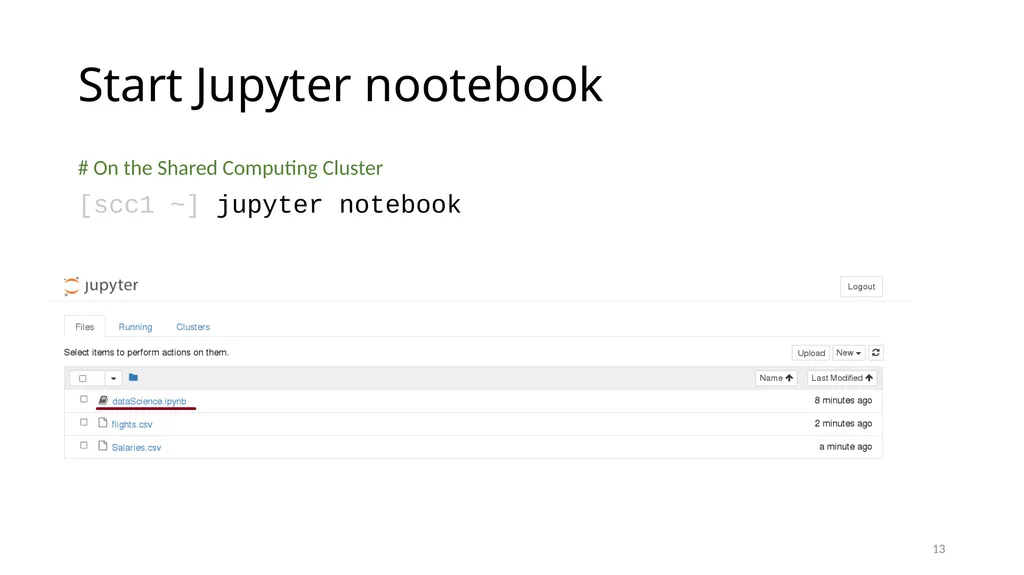
slide13. Start Jupyter nootebook # On the Shared Computing Cluster
[scc1 ~] jupyter notebook 13<br>
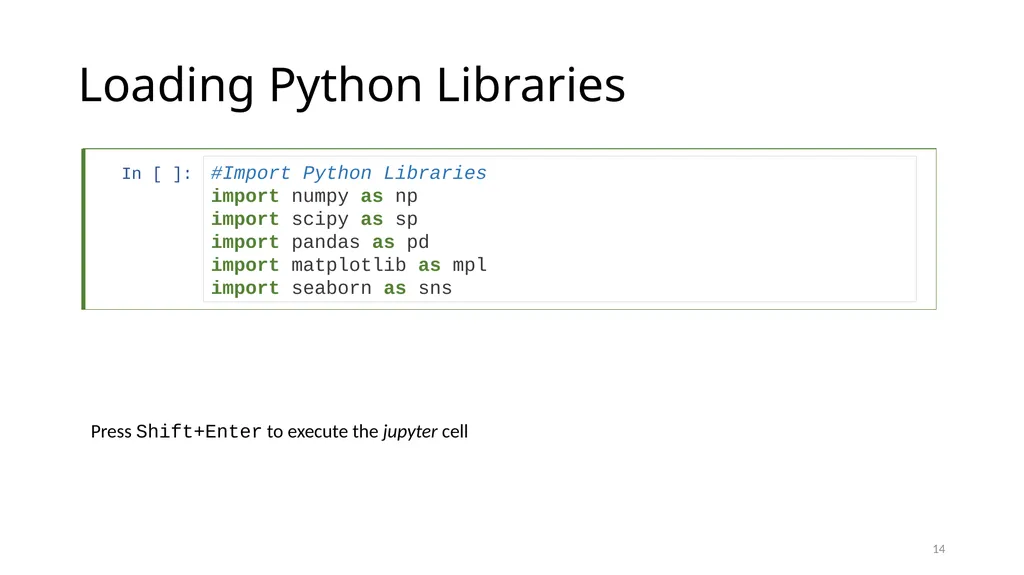
slide14. In [ ]: Loading Python Libraries 14 #Import Python Libraries
import numpy as np
import scipy as sp
import pandas as pd
import matplotlib as mpl
import seaborn as sns Press Shift+Enter to execute the jupyter cell<br>
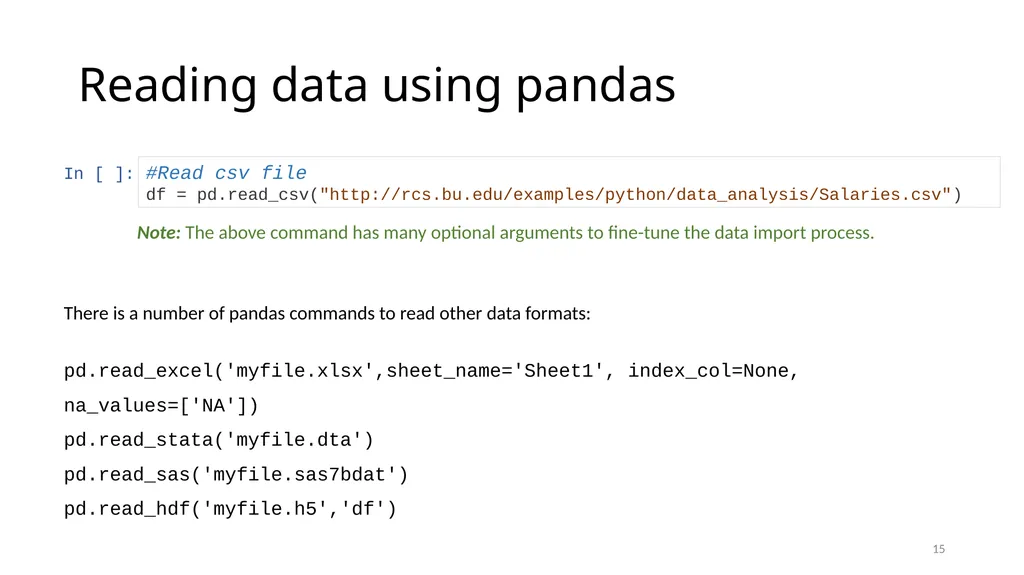
slide15. In [ ]: Reading data using pandas 15 #Read csv file
df = pd.read_csv("http://rcs.bu.edu/examples/python/data_analysis/Salaries.csv") There is a number of pandas commands to read other data formats:
pd.read_excel('myfile.xlsx',sheet_name='Sheet1', index_col=None, na_values=['NA'])
pd.read_stata('myfile.dta')
pd.read_sas('myfile.sas7bdat')
pd.read_hdf('myfile.h5','df') Note: The above command has many optional arguments to fine-tune the data import process.<br>
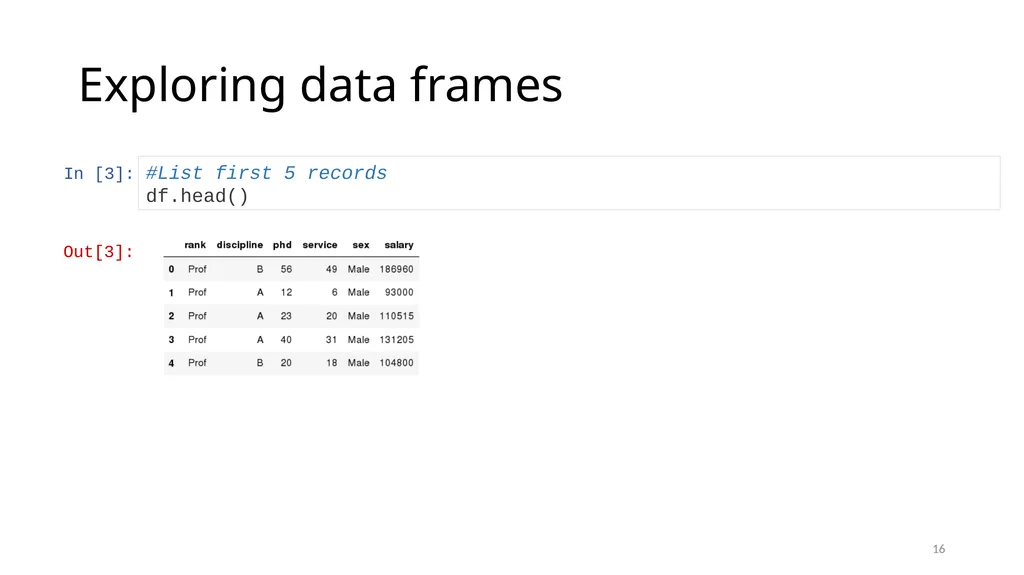
slide16. In [3]: Exploring data frames 16 #List first 5 records
df.head() Out[3]:<br>
slide17. Hands-on exercises 17 Try to read the first 10, 20, 50 records;
Can you guess how to view the last few records; Hint:<br>
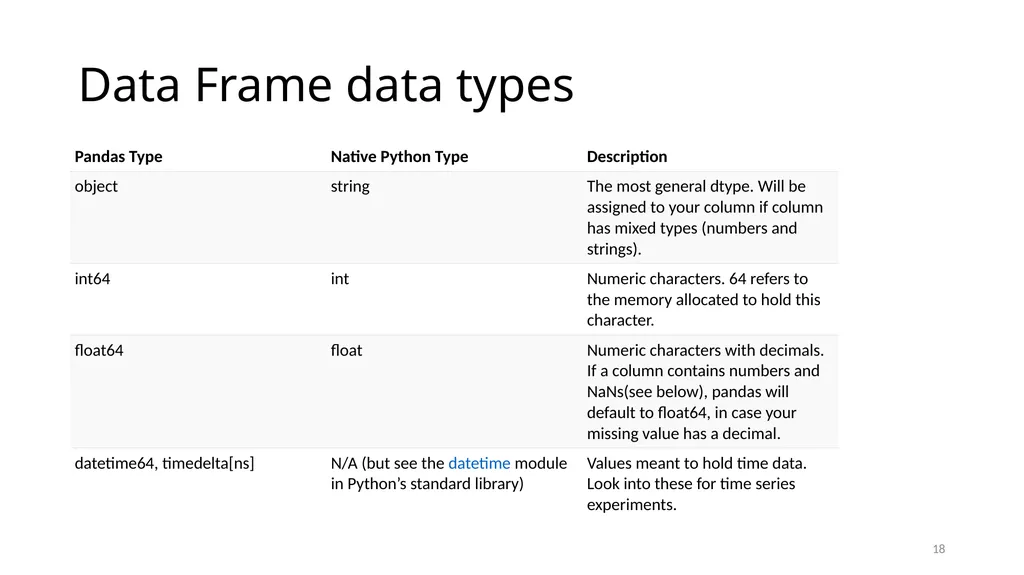
slide18. Data Frame data types 18<br>
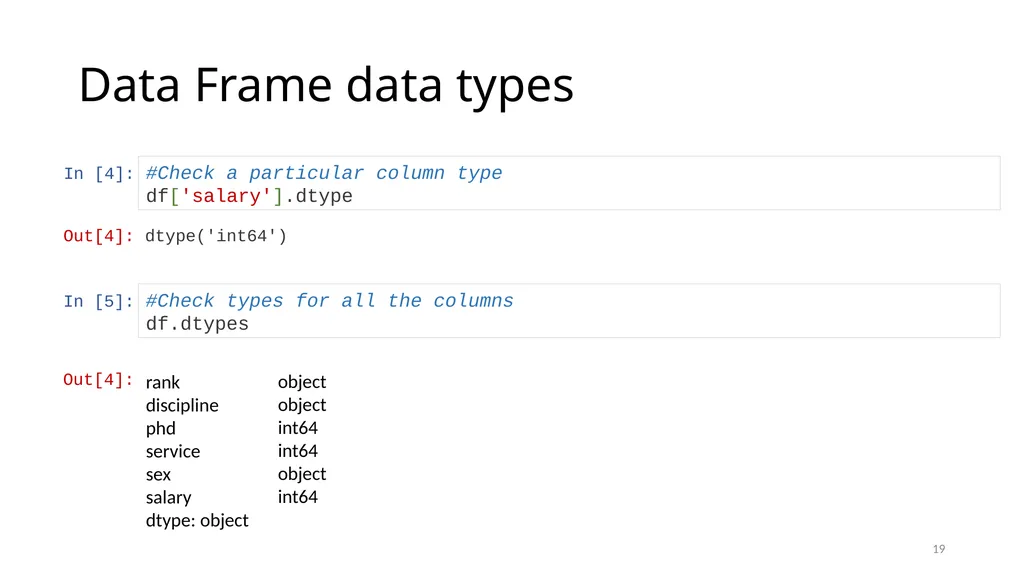
slide19. In [4]: Data Frame data types 19 #Check a particular column type
df['salary'].dtype Out[4]: dtype('int64') In [5]: #Check types for all the columns
df.dtypes Out[4]: rank
discipline
phd
service
sex
salary
dtype: object object
object
int64
int64
object
int64<br>
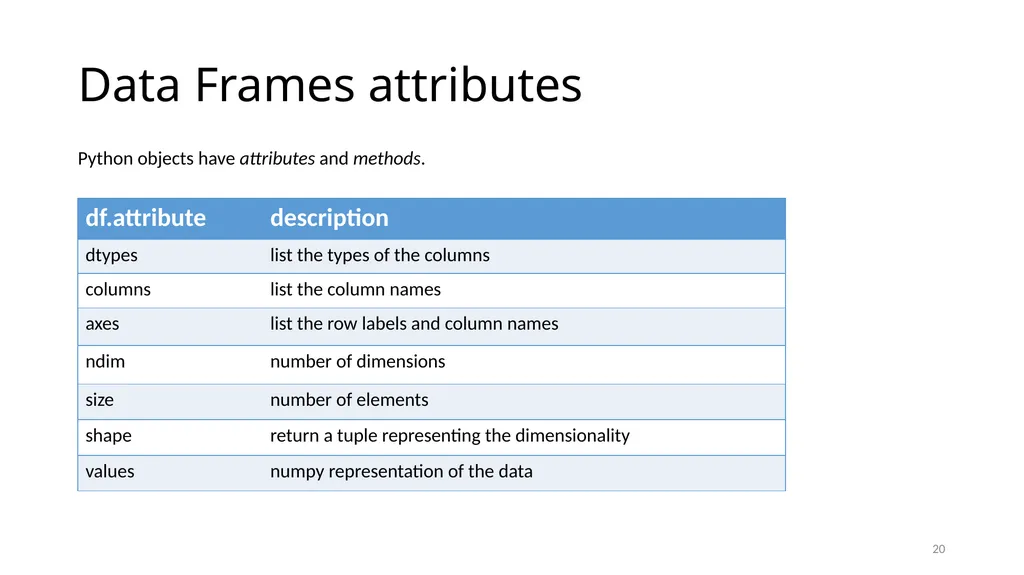
slide20. Data Frames attributes 20 Python objects have attributes and methods.<br>
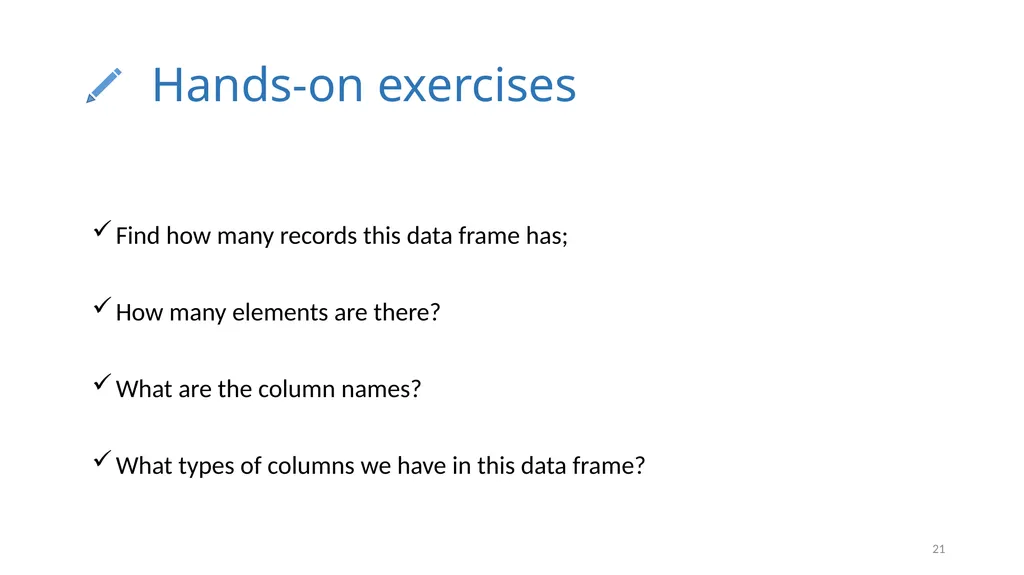
slide21. Hands-on exercises 21 Find how many records this data frame has;
How many elements are there?
What are the column names?
What types of columns we have in this data frame?<br>
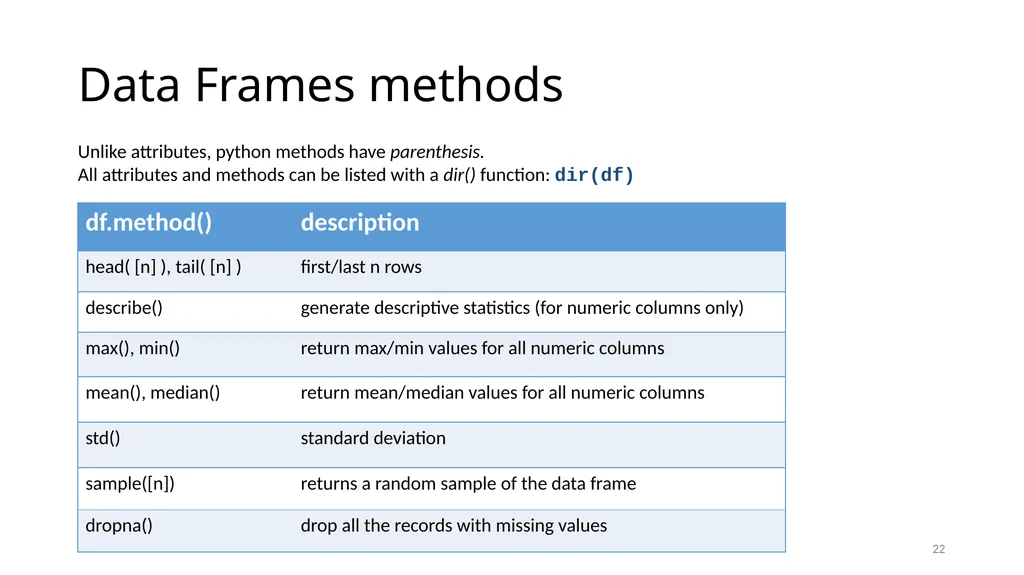
slide22. Data Frames methods 22 Unlike attributes, python methods have parenthesis.
All attributes and methods can be listed with a dir() function: dir(df)<br>
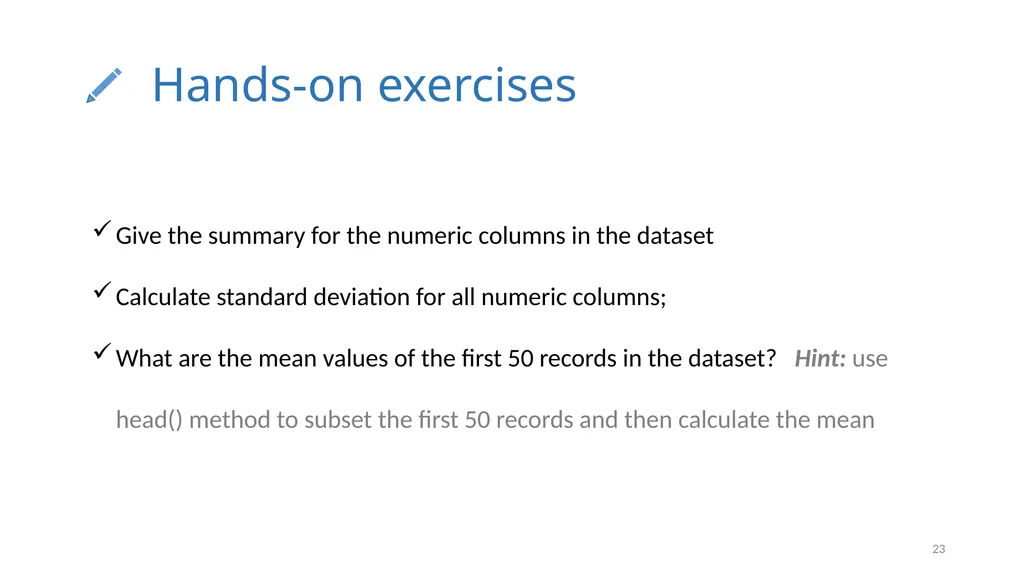
slide23. Hands-on exercises 23 Give the summary for the numeric columns in the dataset
Calculate standard deviation for all numeric columns;
What are the mean values of the first 50 records in the dataset? Hint: use head() method to subset the first 50 records and then calculate the mean<br>
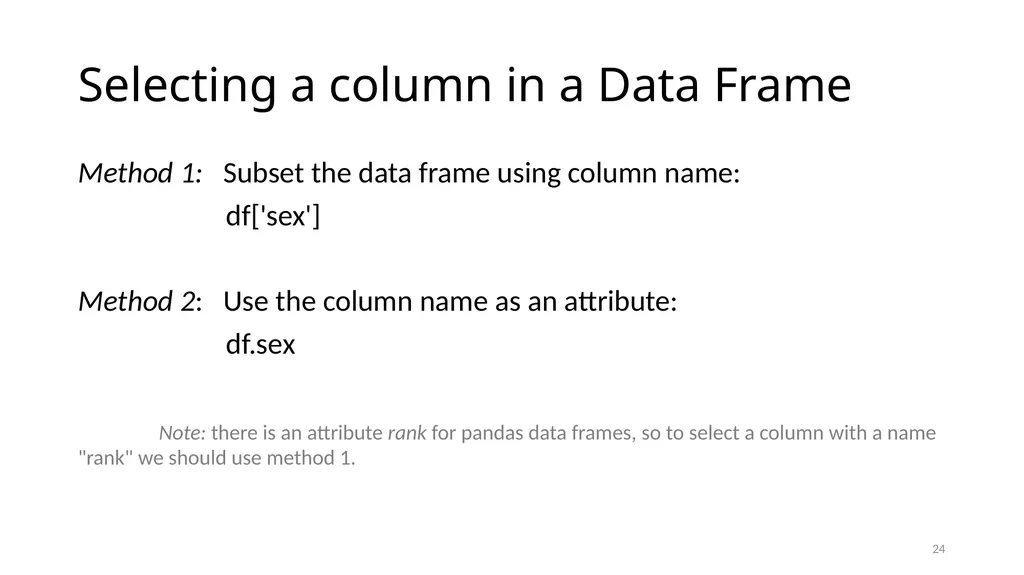
slide24. Selecting a column in a Data Frame Method 1: Subset the data frame using column name:
df['sex']
Method 2: Use the column name as an attribute:
df.sex
Note: there is an attribute rank for pandas data frames, so to select a column with a name "rank" we should use method 1. 24<br>
slide25. Hands-on exercises 25 Calculate the basic statistics for the salary column;
Find how many values in the salary column (use count method);
Calculate the average salary;<br>
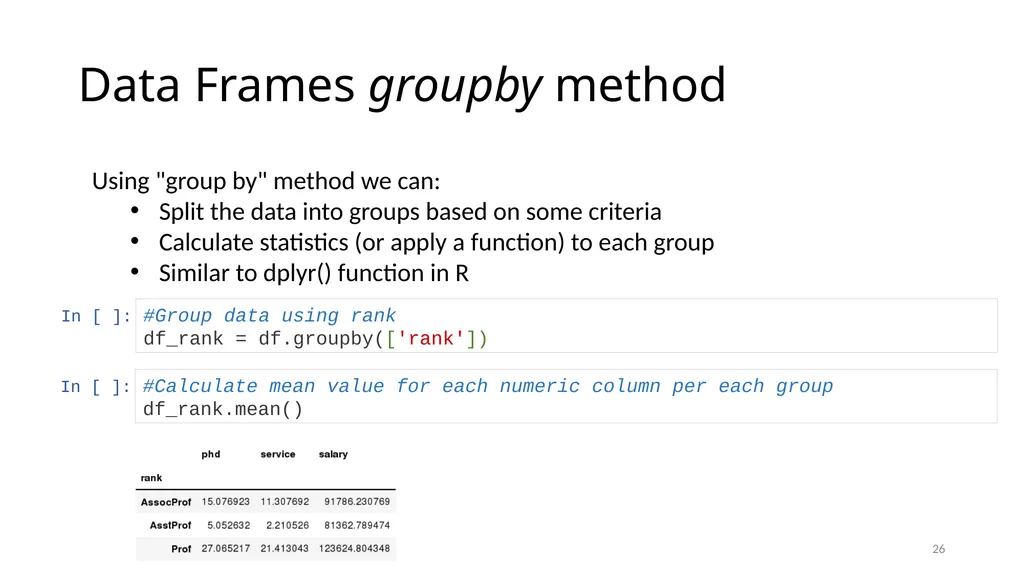
slide26. Data Frames groupby method 26 Using "group by" method we can:
Split the data into groups based on some criteria
Calculate statistics (or apply a function) to each group
Similar to dplyr() function in R In [ ]: #Group data using rank
df_rank = df.groupby(['rank']) In [ ]: #Calculate mean value for each numeric column per each group
df_rank.mean()<br>
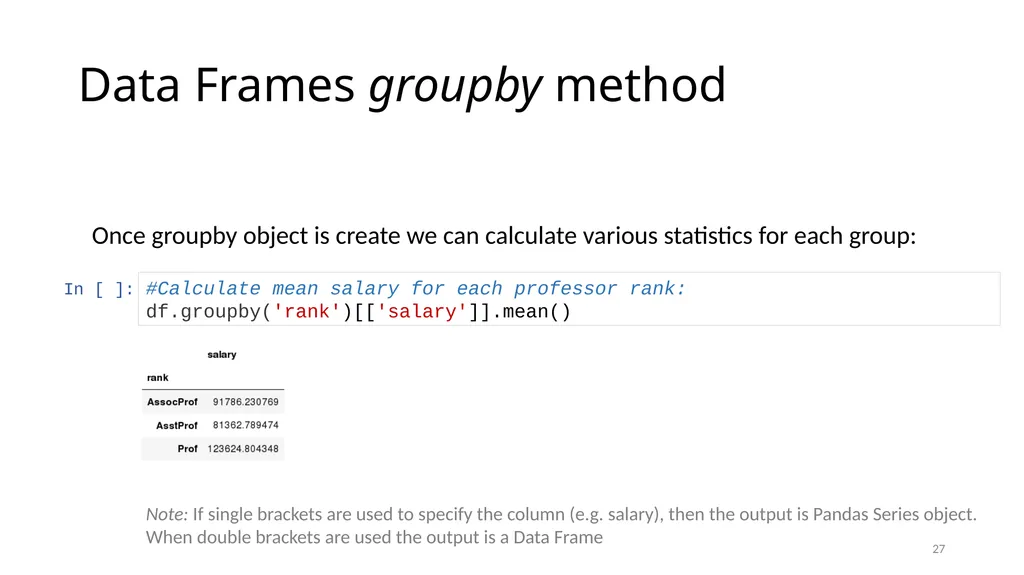
slide27. Data Frames groupby method 27 Once groupby object is create we can calculate various statistics for each group: In [ ]: #Calculate mean salary for each professor rank:
df.groupby('rank')[['salary']].mean() Note: If single brackets are used to specify the column (e.g. salary), then the output is Pandas Series object. When double brackets are used the output is a Data Frame<br>
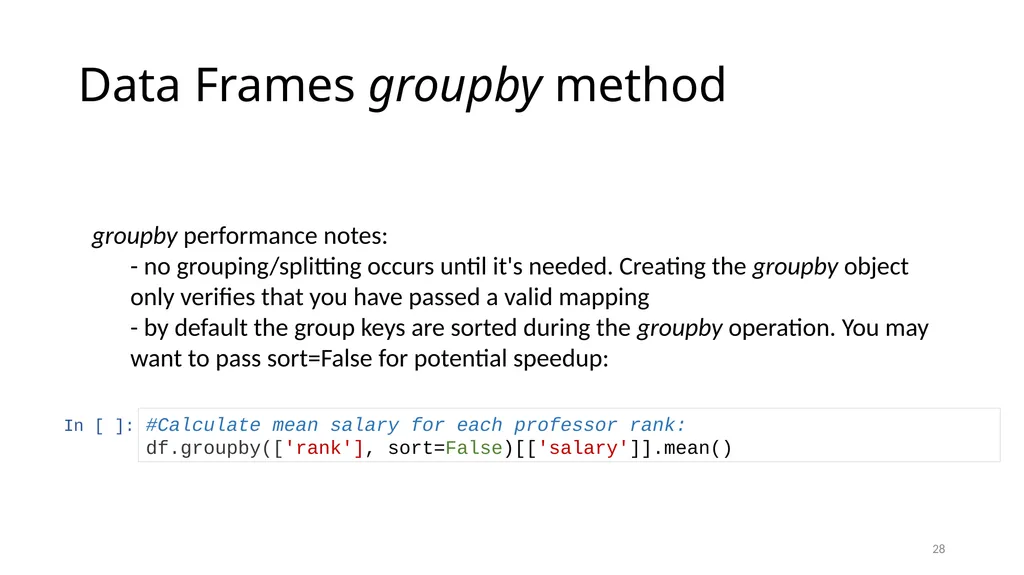
slide28. Data Frames groupby method 28 groupby performance notes:
- no grouping/splitting occurs until it's needed. Creating the groupby object only verifies that you have passed a valid mapping
- by default the group keys are sorted during the groupby operation. You may want to pass sort=False for potential speedup: In [ ]: #Calculate mean salary for each professor rank:
df.groupby(['rank'], sort=False)[['salary']].mean()<br>
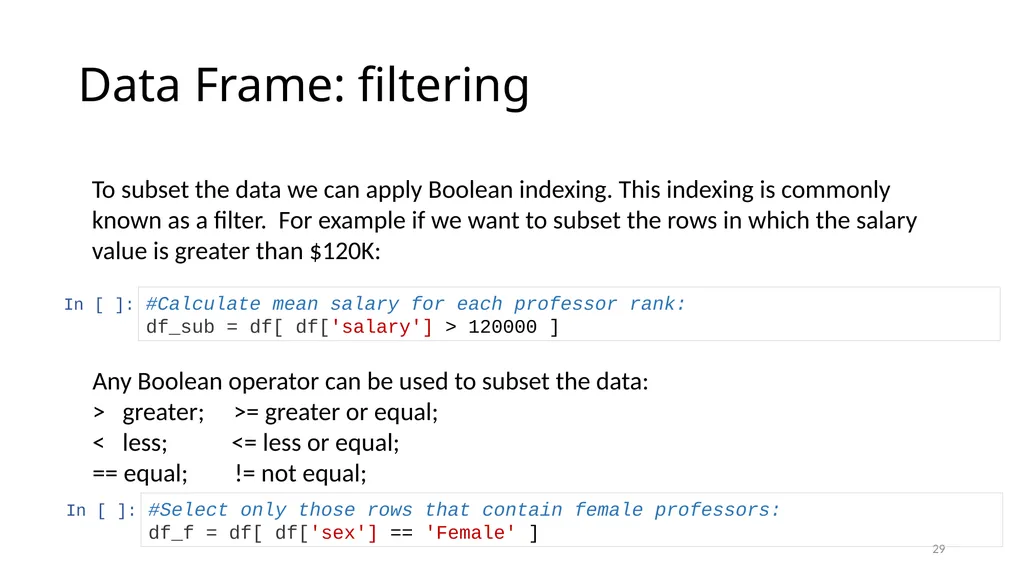
slide29. Data Frame: filtering 29 To subset the data we can apply Boolean indexing. This indexing is commonly known as a filter. For example if we want to subset the rows in which the salary value is greater than $120K: In [ ]: #Calculate mean salary for each professor rank:
df_sub = df[ df['salary'] > 120000 ] In [ ]: #Select only those rows that contain female professors:
df_f = df[ df['sex'] == 'Female' ] Any Boolean operator can be used to subset the data:
> greater; >= greater or equal;
< less; <= less or equal;
== equal; != not equal;<br>
slide30. Data Frames: Slicing 30 There are a number of ways to subset the Data Frame:
one or more columns
one or more rows
a subset of rows and columns
Rows and columns can be selected by their position or label<br>
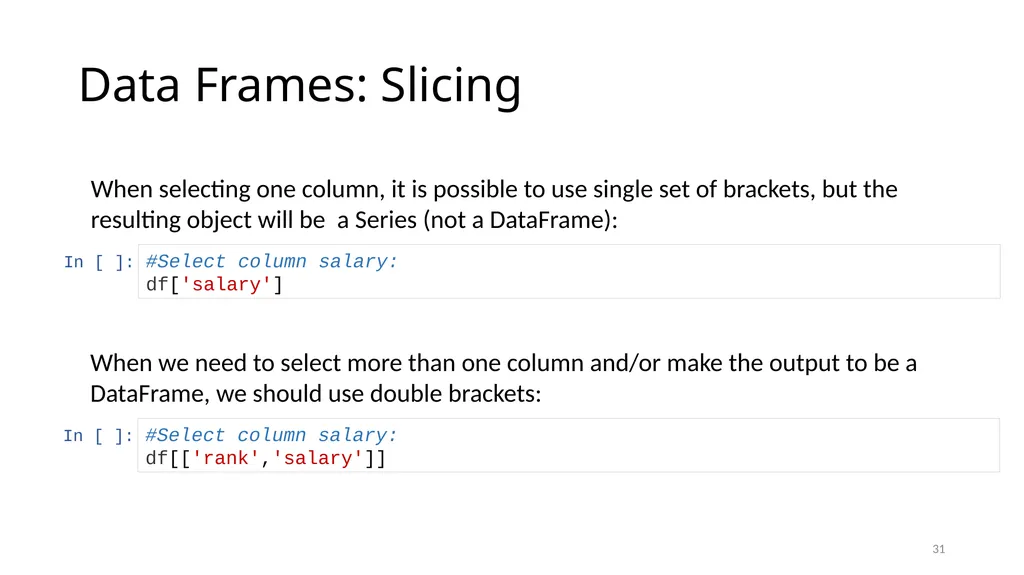
slide31. Data Frames: Slicing 31 When selecting one column, it is possible to use single set of brackets, but the resulting object will be a Series (not a DataFrame): In [ ]: #Select column salary:
df['salary'] When we need to select more than one column and/or make the output to be a DataFrame, we should use double brackets: In [ ]: #Select column salary:
df[['rank','salary']]<br>
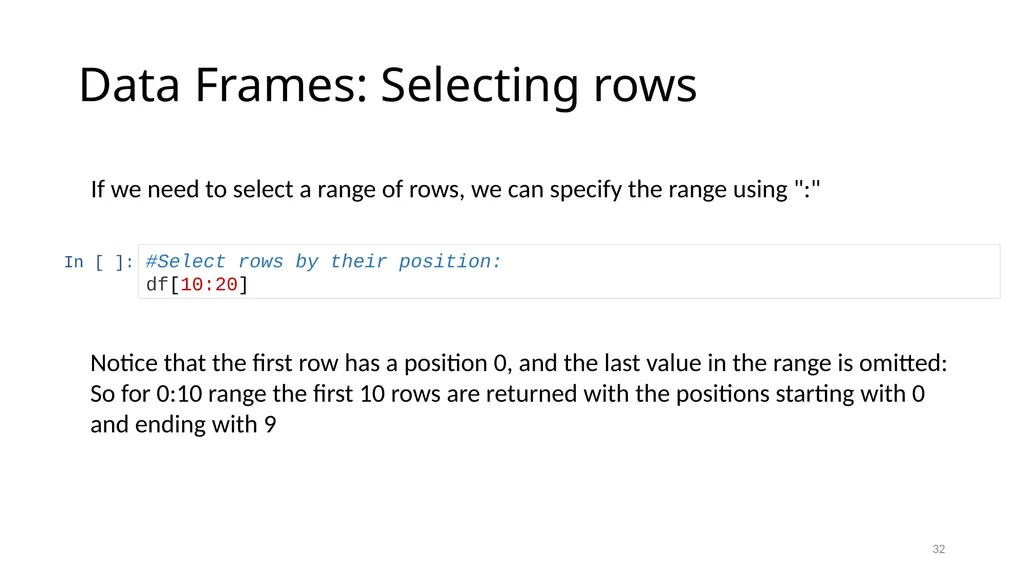
slide32. Data Frames: Selecting rows 32 If we need to select a range of rows, we can specify the range using ":" In [ ]: #Select rows by their position:
df[10:20] Notice that the first row has a position 0, and the last value in the range is omitted:
So for 0:10 range the first 10 rows are returned with the positions starting with 0 and ending with 9<br>
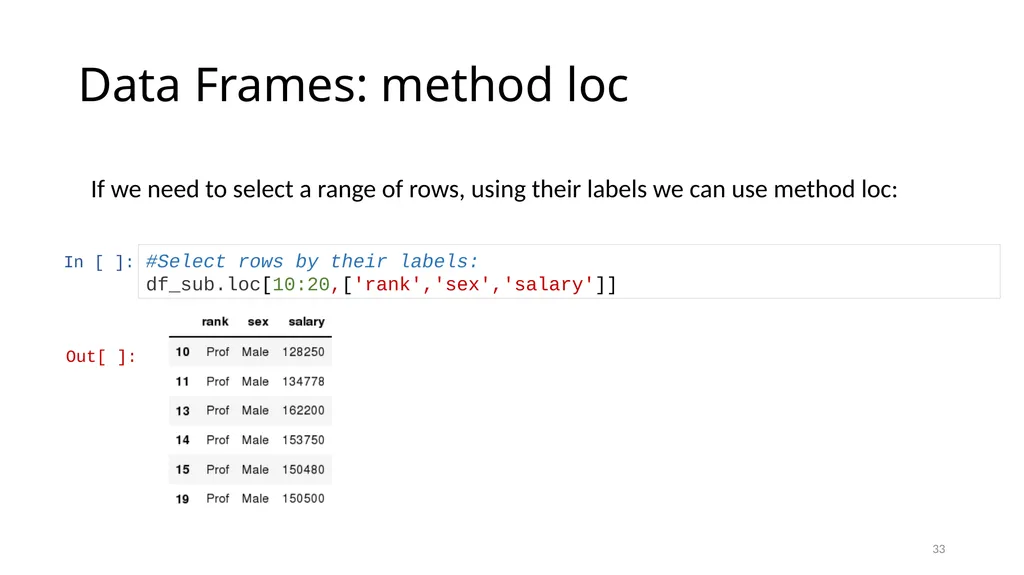
slide33. Data Frames: method loc 33 If we need to select a range of rows, using their labels we can use method loc: In [ ]: #Select rows by their labels:
df_sub.loc[10:20,['rank','sex','salary']] Out[ ]:<br>
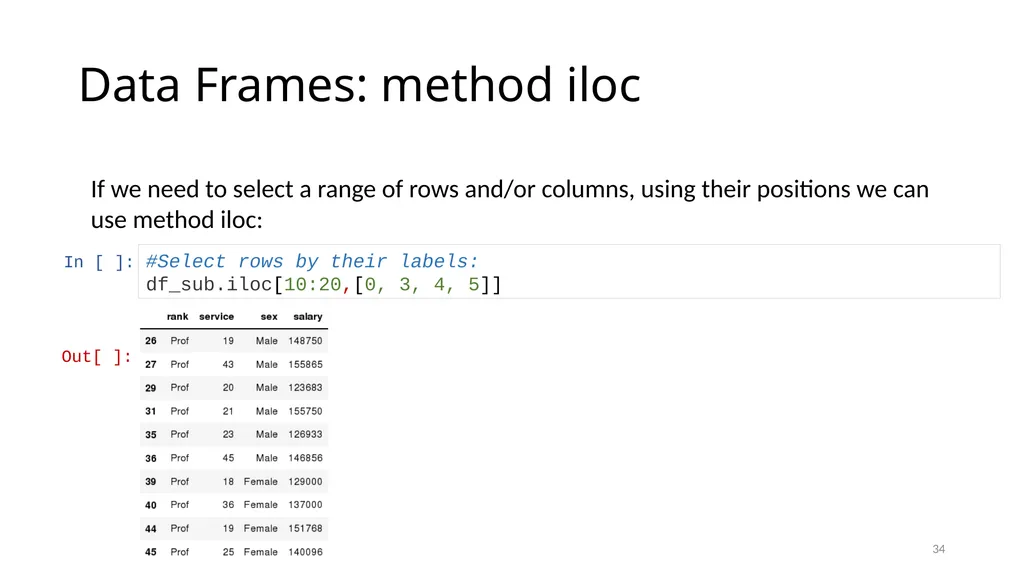
slide34. Data Frames: method iloc 34 If we need to select a range of rows and/or columns, using their positions we can use method iloc: In [ ]: #Select rows by their labels:
df_sub.iloc[10:20,[0, 3, 4, 5]] Out[ ]:<br>
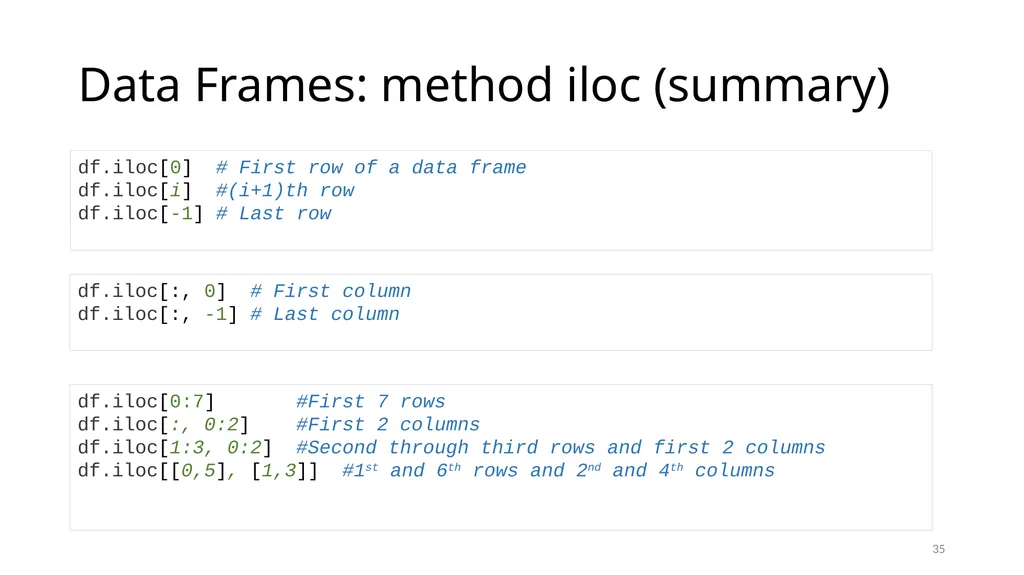
slide35. Data Frames: method iloc (summary) 35 df.iloc[0] # First row of a data frame
df.iloc[i] #(i+1)th row
df.iloc[-1] # Last row df.iloc[:, 0] # First column
df.iloc[:, -1] # Last column df.iloc[0:7] #First 7 rows
df.iloc[:, 0:2] #First 2 columns
df.iloc[1:3, 0:2] #Second through third rows and first 2 columns
df.iloc[[0,5], [1,3]] #1st and 6th rows and 2nd and 4th columns<br>
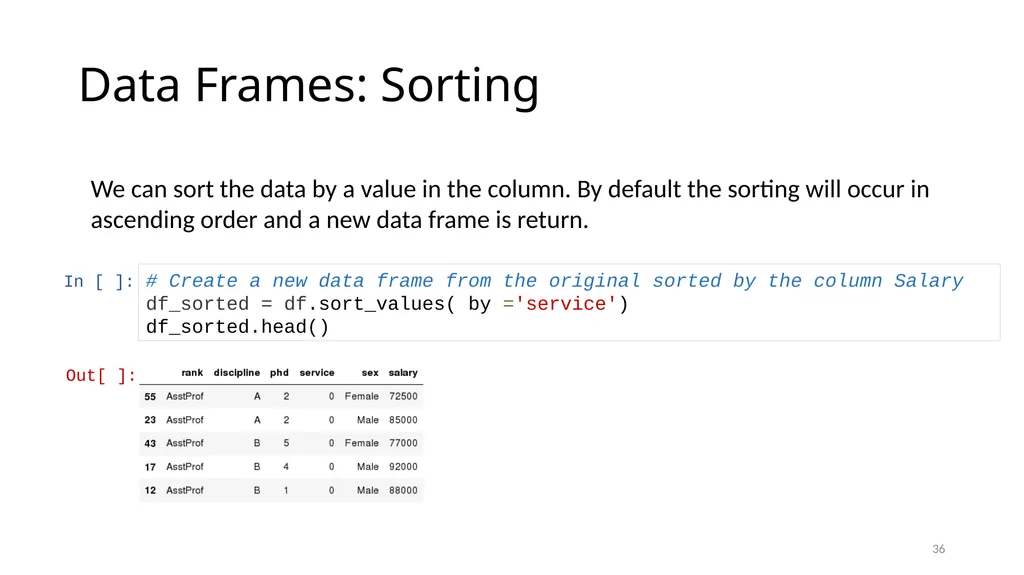
slide36. Data Frames: Sorting 36 We can sort the data by a value in the column. By default the sorting will occur in ascending order and a new data frame is return. In [ ]: # Create a new data frame from the original sorted by the column Salary
df_sorted = df.sort_values( by ='service')
df_sorted.head() Out[ ]:<br>
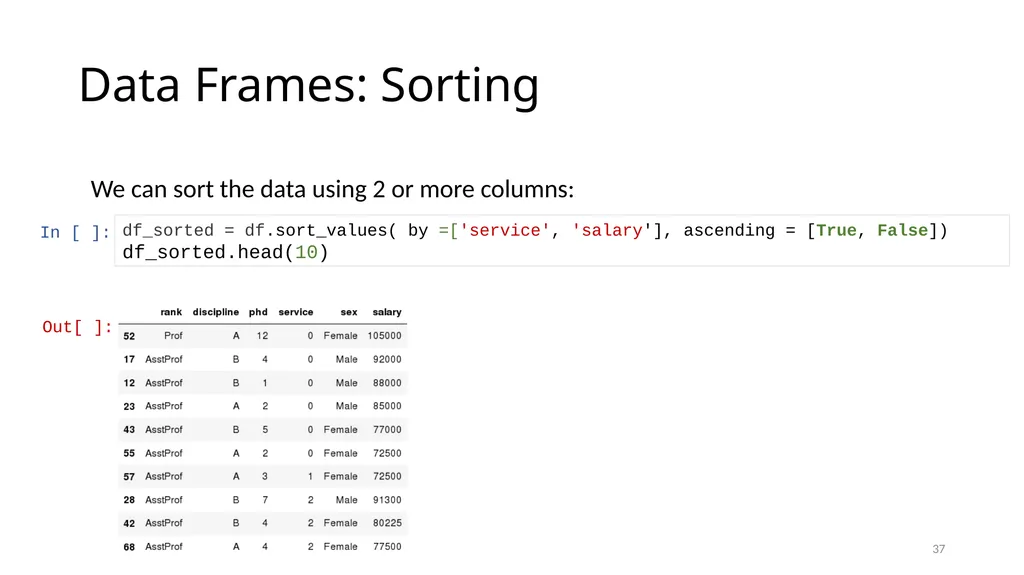
slide37. Data Frames: Sorting 37 We can sort the data using 2 or more columns: In [ ]: df_sorted = df.sort_values( by =['service', 'salary'], ascending = [True, False])
df_sorted.head(10) Out[ ]:<br>
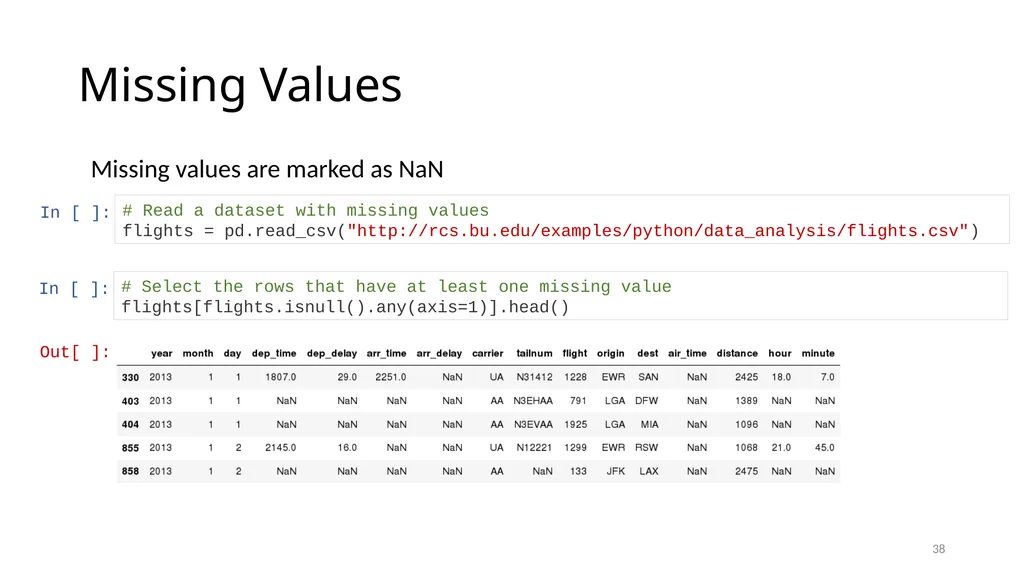
slide38. Missing Values 38 Missing values are marked as NaN In [ ]: # Read a dataset with missing values
flights = pd.read_csv("http://rcs.bu.edu/examples/python/data_analysis/flights.csv") In [ ]: # Select the rows that have at least one missing value
flights[flights.isnull().any(axis=1)].head() Out[ ]:<br>
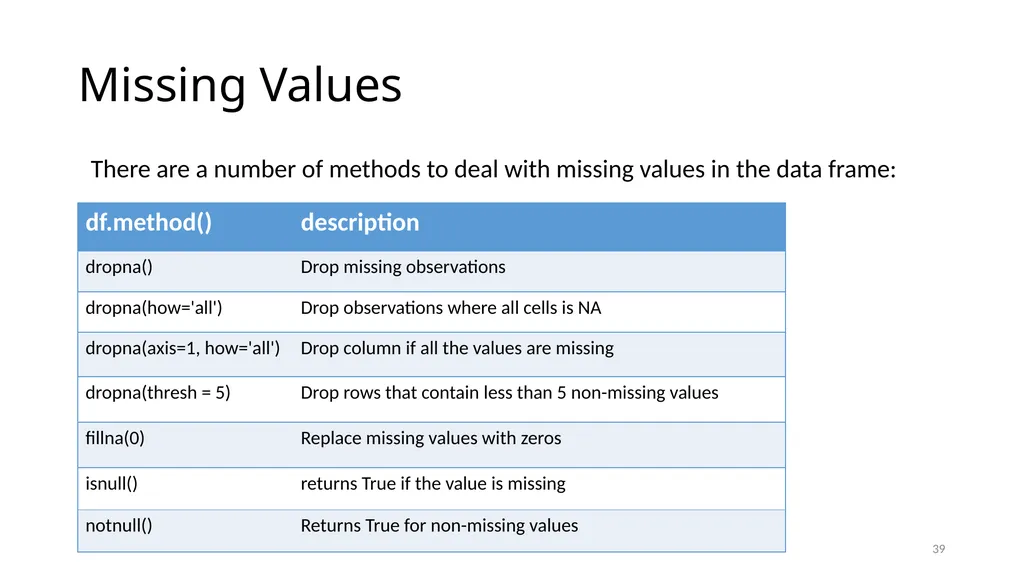
slide39. Missing Values 39 There are a number of methods to deal with missing values in the data frame:<br>
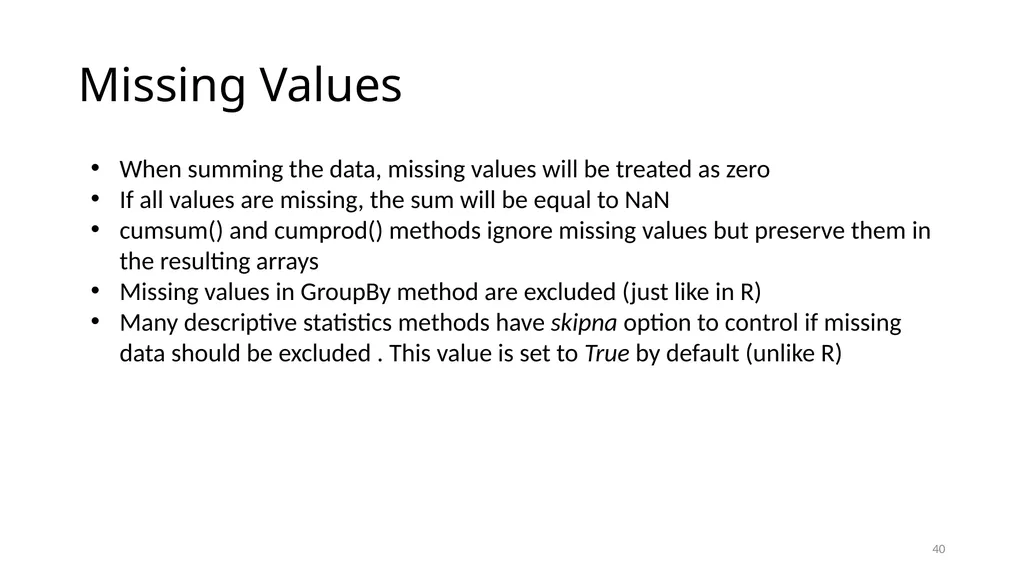
slide40. Missing Values 40 When summing the data, missing values will be treated as zero
If all values are missing, the sum will be equal to NaN
cumsum() and cumprod() methods ignore missing values but preserve them in the resulting arrays
Missing values in GroupBy method are excluded (just like in R)
Many descriptive statistics methods have skipna option to control if missing data should be excluded . This value is set to True by default (unlike R)<br>
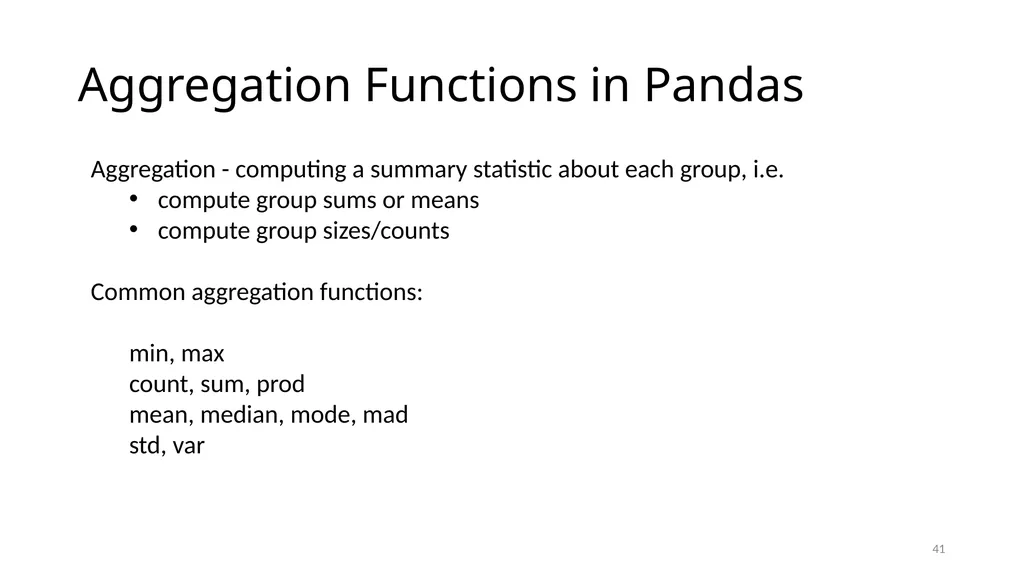
slide41. Aggregation Functions in Pandas 41 Aggregation - computing a summary statistic about each group, i.e.
compute group sums or means
compute group sizes/counts
Common aggregation functions:
min, max
count, sum, prod
mean, median, mode, mad
std, var<br>
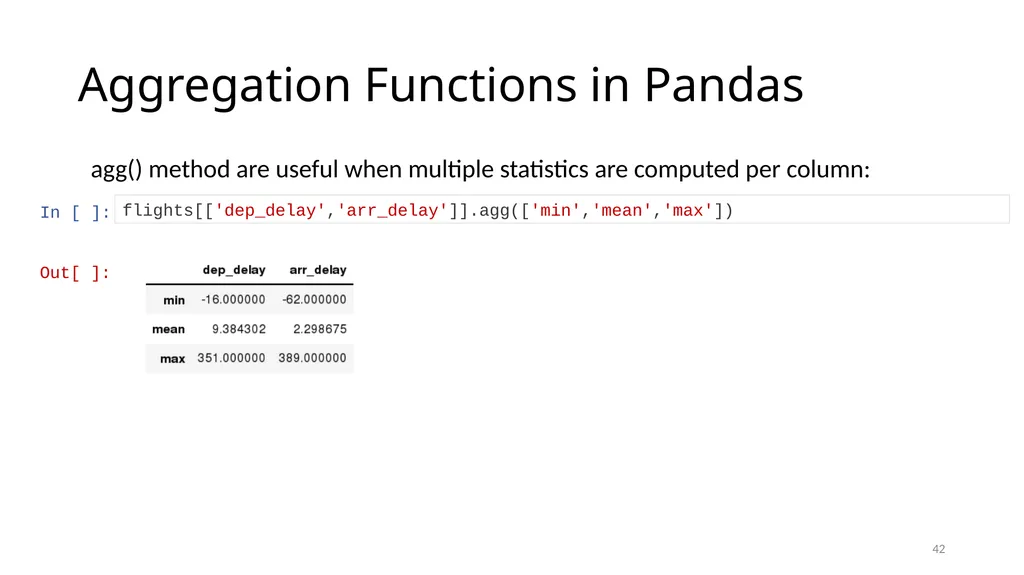
slide42. Aggregation Functions in Pandas 42 agg() method are useful when multiple statistics are computed per column: In [ ]: flights[['dep_delay','arr_delay']].agg(['min','mean','max']) Out[ ]:<br>
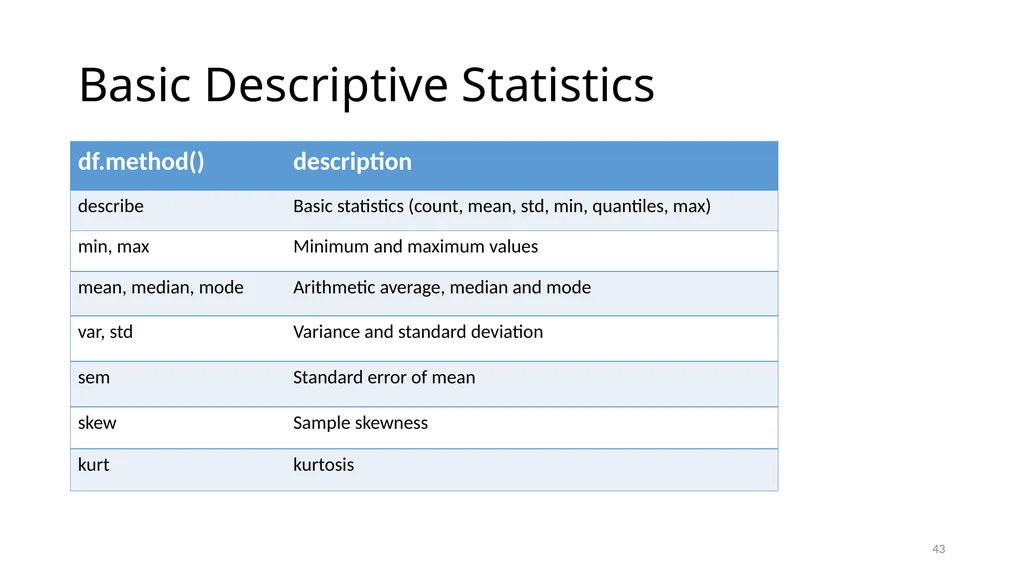
slide43. Basic Descriptive Statistics 43<br>
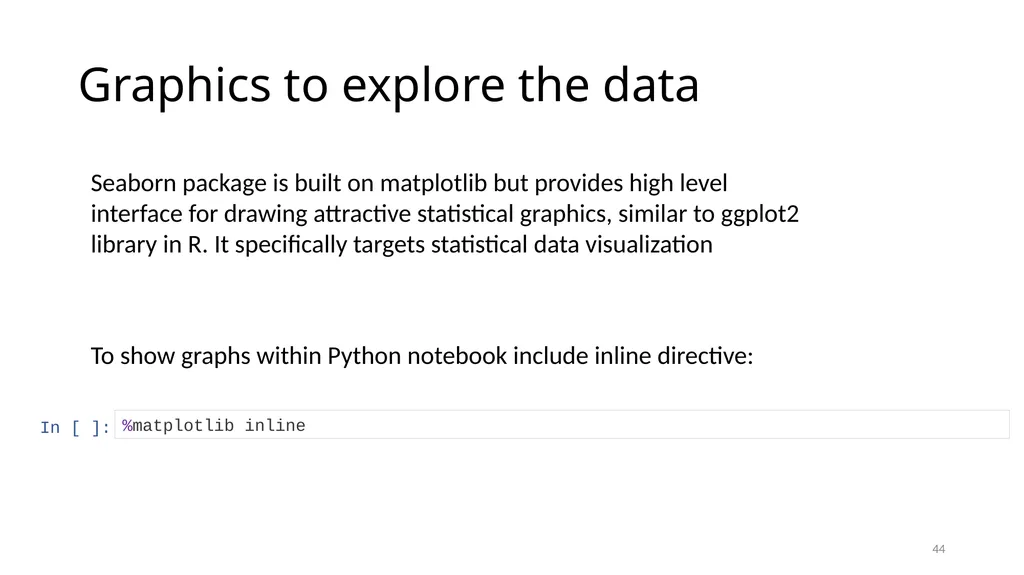
slide44. Graphics to explore the data 44 To show graphs within Python notebook include inline directive: In [ ]: %matplotlib inline Seaborn package is built on matplotlib but provides high level interface for drawing attractive statistical graphics, similar to ggplot2 library in R. It specifically targets statistical data visualization<br>
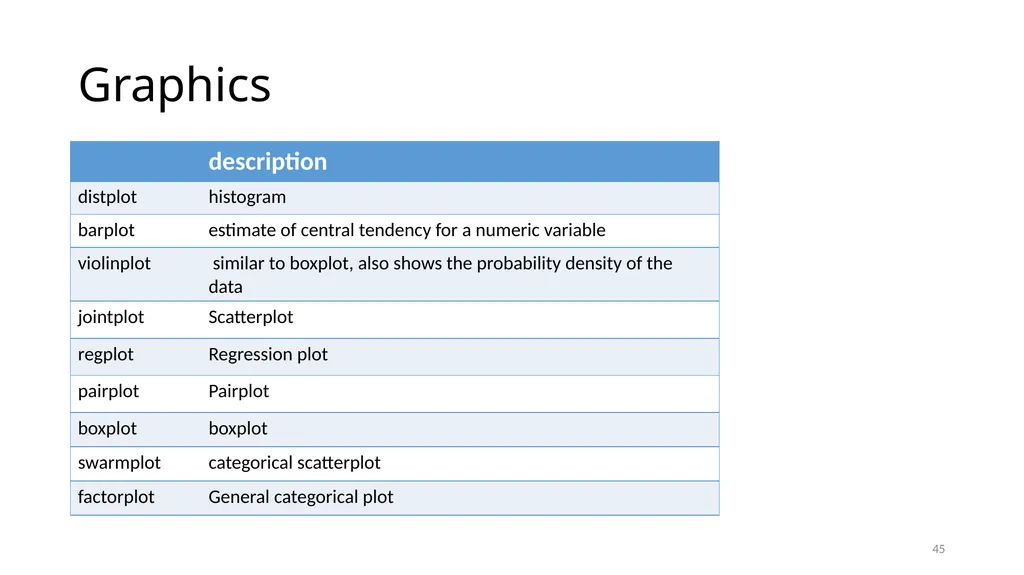
slide45. Graphics 45<br>
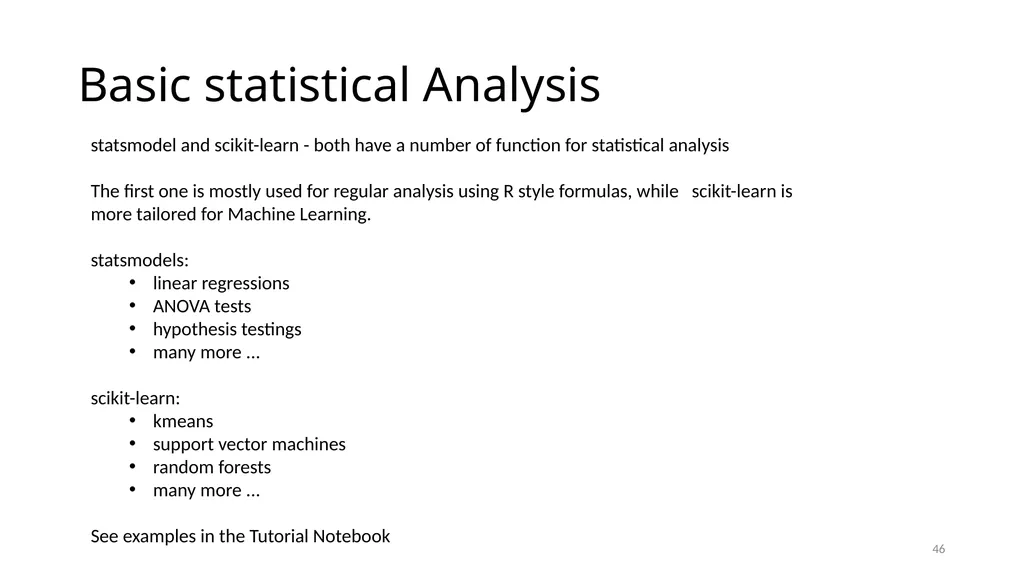
slide46. Basic statistical Analysis 46 statsmodel and scikit-learn - both have a number of function for statistical analysis
The first one is mostly used for regular analysis using R style formulas, while scikit-learn is more tailored for Machine Learning.
statsmodels:
linear regressions
ANOVA tests
hypothesis testings
many more ...
scikit-learn:
kmeans
support vector machines
random forests
many more ...
See examples in the Tutorial Notebook<br>
slide47. Conclusion Thank you for attending the tutorial.
Please fill the evaluation form:
http://scv.bu.edu/survey/tutorial_evaluation.html
Questions:
email: koleinik@bu.edu (Katia Oleinik) 47<br>
Katia Oleinik (koleinik@bu.edu)<br>
slide2. Tutorial Content 2 Overview of Python Libraries for Data Scientists Reading Data; Selecting and Filtering the Data; Data manipulation, sorting, grouping, rearranging Plotting the data Descriptive statistics Inferential statistics<br>
slide3. Python Libraries for Data Science Many popular Python toolboxes/libraries:
NumPy
SciPy
Pandas
SciKit-Learn
Visualization libraries
matplotlib
Seaborn
and many more … 3 All these libraries are installed on the SCC<br>
slide4. Python Libraries for Data Science NumPy:
introduces objects for multidimensional arrays and matrices, as well as functions that allow to easily perform advanced mathematical and statistical operations on those objects
provides vectorization of mathematical operations on arrays and matrices which significantly improves the performance
many other python libraries are built on NumPy 4 Link: http://www.numpy.org/<br>
slide5. Python Libraries for Data Science SciPy:
collection of algorithms for linear algebra, differential equations, numerical integration, optimization, statistics and more
part of SciPy Stack
built on NumPy 5 Link: https://www.scipy.org/scipylib/<br>
slide6. Python Libraries for Data Science Pandas:
adds data structures and tools designed to work with table-like data (similar to Series and Data Frames in R)
provides tools for data manipulation: reshaping, merging, sorting, slicing, aggregation etc.
allows handling missing data 6 Link: http://pandas.pydata.org/<br>
slide7. Link: http://scikit-learn.org/ Python Libraries for Data Science SciKit-Learn:
provides machine learning algorithms: classification, regression, clustering, model validation etc.
built on NumPy, SciPy and matplotlib 7<br>
slide8. matplotlib:
python 2D plotting library which produces publication quality figures in a variety of hardcopy formats
a set of functionalities similar to those of MATLAB
line plots, scatter plots, barcharts, histograms, pie charts etc.
relatively low-level; some effort needed to create advanced visualization Link: https://matplotlib.org/ Python Libraries for Data Science 8<br>
slide9. Seaborn:
based on matplotlib
provides high level interface for drawing attractive statistical graphics
Similar (in style) to the popular ggplot2 library in R Link: https://seaborn.pydata.org/ Python Libraries for Data Science 9<br>
slide10. Login to the Shared Computing Cluster Use your SCC login information if you have SCC account
If you are using tutorial accounts see info on the blackboard
Note: Your password will not be displayed while you enter it. 10<br>
slide11. Selecting Python Version on the SCC # view available python versions on the SCC
[scc1 ~] module avail python
# load python 3 version
[scc1 ~] module load python/3.6.2 11<br>
slide12. Download tutorial notebook # On the Shared Computing Cluster
[scc1 ~] cp /project/scv/examples/python/data_analysis/dataScience.ipynb .
# On a local computer save the link:
http://rcs.bu.edu/examples/python/data_analysis/dataScience.ipynb 12<br>
slide13. Start Jupyter nootebook # On the Shared Computing Cluster
[scc1 ~] jupyter notebook 13<br>
slide14. In [ ]: Loading Python Libraries 14 #Import Python Libraries
import numpy as np
import scipy as sp
import pandas as pd
import matplotlib as mpl
import seaborn as sns Press Shift+Enter to execute the jupyter cell<br>
slide15. In [ ]: Reading data using pandas 15 #Read csv file
df = pd.read_csv("http://rcs.bu.edu/examples/python/data_analysis/Salaries.csv") There is a number of pandas commands to read other data formats:
pd.read_excel('myfile.xlsx',sheet_name='Sheet1', index_col=None, na_values=['NA'])
pd.read_stata('myfile.dta')
pd.read_sas('myfile.sas7bdat')
pd.read_hdf('myfile.h5','df') Note: The above command has many optional arguments to fine-tune the data import process.<br>
slide16. In [3]: Exploring data frames 16 #List first 5 records
df.head() Out[3]:<br>
slide17. Hands-on exercises 17 Try to read the first 10, 20, 50 records;
Can you guess how to view the last few records; Hint:<br>
slide18. Data Frame data types 18<br>
slide19. In [4]: Data Frame data types 19 #Check a particular column type
df['salary'].dtype Out[4]: dtype('int64') In [5]: #Check types for all the columns
df.dtypes Out[4]: rank
discipline
phd
service
sex
salary
dtype: object object
object
int64
int64
object
int64<br>
slide20. Data Frames attributes 20 Python objects have attributes and methods.<br>
slide21. Hands-on exercises 21 Find how many records this data frame has;
How many elements are there?
What are the column names?
What types of columns we have in this data frame?<br>
slide22. Data Frames methods 22 Unlike attributes, python methods have parenthesis.
All attributes and methods can be listed with a dir() function: dir(df)<br>
slide23. Hands-on exercises 23 Give the summary for the numeric columns in the dataset
Calculate standard deviation for all numeric columns;
What are the mean values of the first 50 records in the dataset? Hint: use head() method to subset the first 50 records and then calculate the mean<br>
slide24. Selecting a column in a Data Frame Method 1: Subset the data frame using column name:
df['sex']
Method 2: Use the column name as an attribute:
df.sex
Note: there is an attribute rank for pandas data frames, so to select a column with a name "rank" we should use method 1. 24<br>
slide25. Hands-on exercises 25 Calculate the basic statistics for the salary column;
Find how many values in the salary column (use count method);
Calculate the average salary;<br>
slide26. Data Frames groupby method 26 Using "group by" method we can:
Split the data into groups based on some criteria
Calculate statistics (or apply a function) to each group
Similar to dplyr() function in R In [ ]: #Group data using rank
df_rank = df.groupby(['rank']) In [ ]: #Calculate mean value for each numeric column per each group
df_rank.mean()<br>
slide27. Data Frames groupby method 27 Once groupby object is create we can calculate various statistics for each group: In [ ]: #Calculate mean salary for each professor rank:
df.groupby('rank')[['salary']].mean() Note: If single brackets are used to specify the column (e.g. salary), then the output is Pandas Series object. When double brackets are used the output is a Data Frame<br>
slide28. Data Frames groupby method 28 groupby performance notes:
- no grouping/splitting occurs until it's needed. Creating the groupby object only verifies that you have passed a valid mapping
- by default the group keys are sorted during the groupby operation. You may want to pass sort=False for potential speedup: In [ ]: #Calculate mean salary for each professor rank:
df.groupby(['rank'], sort=False)[['salary']].mean()<br>
slide29. Data Frame: filtering 29 To subset the data we can apply Boolean indexing. This indexing is commonly known as a filter. For example if we want to subset the rows in which the salary value is greater than $120K: In [ ]: #Calculate mean salary for each professor rank:
df_sub = df[ df['salary'] > 120000 ] In [ ]: #Select only those rows that contain female professors:
df_f = df[ df['sex'] == 'Female' ] Any Boolean operator can be used to subset the data:
> greater; >= greater or equal;
< less; <= less or equal;
== equal; != not equal;<br>
slide30. Data Frames: Slicing 30 There are a number of ways to subset the Data Frame:
one or more columns
one or more rows
a subset of rows and columns
Rows and columns can be selected by their position or label<br>
slide31. Data Frames: Slicing 31 When selecting one column, it is possible to use single set of brackets, but the resulting object will be a Series (not a DataFrame): In [ ]: #Select column salary:
df['salary'] When we need to select more than one column and/or make the output to be a DataFrame, we should use double brackets: In [ ]: #Select column salary:
df[['rank','salary']]<br>
slide32. Data Frames: Selecting rows 32 If we need to select a range of rows, we can specify the range using ":" In [ ]: #Select rows by their position:
df[10:20] Notice that the first row has a position 0, and the last value in the range is omitted:
So for 0:10 range the first 10 rows are returned with the positions starting with 0 and ending with 9<br>
slide33. Data Frames: method loc 33 If we need to select a range of rows, using their labels we can use method loc: In [ ]: #Select rows by their labels:
df_sub.loc[10:20,['rank','sex','salary']] Out[ ]:<br>
slide34. Data Frames: method iloc 34 If we need to select a range of rows and/or columns, using their positions we can use method iloc: In [ ]: #Select rows by their labels:
df_sub.iloc[10:20,[0, 3, 4, 5]] Out[ ]:<br>
slide35. Data Frames: method iloc (summary) 35 df.iloc[0] # First row of a data frame
df.iloc[i] #(i+1)th row
df.iloc[-1] # Last row df.iloc[:, 0] # First column
df.iloc[:, -1] # Last column df.iloc[0:7] #First 7 rows
df.iloc[:, 0:2] #First 2 columns
df.iloc[1:3, 0:2] #Second through third rows and first 2 columns
df.iloc[[0,5], [1,3]] #1st and 6th rows and 2nd and 4th columns<br>
slide36. Data Frames: Sorting 36 We can sort the data by a value in the column. By default the sorting will occur in ascending order and a new data frame is return. In [ ]: # Create a new data frame from the original sorted by the column Salary
df_sorted = df.sort_values( by ='service')
df_sorted.head() Out[ ]:<br>
slide37. Data Frames: Sorting 37 We can sort the data using 2 or more columns: In [ ]: df_sorted = df.sort_values( by =['service', 'salary'], ascending = [True, False])
df_sorted.head(10) Out[ ]:<br>
slide38. Missing Values 38 Missing values are marked as NaN In [ ]: # Read a dataset with missing values
flights = pd.read_csv("http://rcs.bu.edu/examples/python/data_analysis/flights.csv") In [ ]: # Select the rows that have at least one missing value
flights[flights.isnull().any(axis=1)].head() Out[ ]:<br>
slide39. Missing Values 39 There are a number of methods to deal with missing values in the data frame:<br>
slide40. Missing Values 40 When summing the data, missing values will be treated as zero
If all values are missing, the sum will be equal to NaN
cumsum() and cumprod() methods ignore missing values but preserve them in the resulting arrays
Missing values in GroupBy method are excluded (just like in R)
Many descriptive statistics methods have skipna option to control if missing data should be excluded . This value is set to True by default (unlike R)<br>
slide41. Aggregation Functions in Pandas 41 Aggregation - computing a summary statistic about each group, i.e.
compute group sums or means
compute group sizes/counts
Common aggregation functions:
min, max
count, sum, prod
mean, median, mode, mad
std, var<br>
slide42. Aggregation Functions in Pandas 42 agg() method are useful when multiple statistics are computed per column: In [ ]: flights[['dep_delay','arr_delay']].agg(['min','mean','max']) Out[ ]:<br>
slide43. Basic Descriptive Statistics 43<br>
slide44. Graphics to explore the data 44 To show graphs within Python notebook include inline directive: In [ ]: %matplotlib inline Seaborn package is built on matplotlib but provides high level interface for drawing attractive statistical graphics, similar to ggplot2 library in R. It specifically targets statistical data visualization<br>
slide45. Graphics 45<br>
slide46. Basic statistical Analysis 46 statsmodel and scikit-learn - both have a number of function for statistical analysis
The first one is mostly used for regular analysis using R style formulas, while scikit-learn is more tailored for Machine Learning.
statsmodels:
linear regressions
ANOVA tests
hypothesis testings
many more ...
scikit-learn:
kmeans
support vector machines
random forests
many more ...
See examples in the Tutorial Notebook<br>
slide47. Conclusion Thank you for attending the tutorial.
Please fill the evaluation form:
http://scv.bu.edu/survey/tutorial_evaluation.html
Questions:
email: koleinik@bu.edu (Katia Oleinik) 47<br>