
Q1 Performance Report Presentation to the PCD&MV



Description: Q1 Performance Report Presentation to the PCDMV of 02 September 2020 DEPARTMENT OF DEFENCE 202021 Aim Information brief to the Portfolio Committee on Defence and Military Veterans on the DOD Q1 Performance Report for FY202021 2
Related Topics
Download Presentation
"Q1 Performance Report Presentation to the PCD&MV" is the property of its rightful owner. Permission is granted to download and print the materials on this website for personal, non-commercial use only, and to display it on your personal computer provided you do not modify the materials and that you retain all copyright notices contained in the materials. By downloading content from our website, you accept the terms of this agreement.
Presentation Transcript
slide1. Q1 Performance Report Presentation to the PCD&MV of 02 September 2020 DEPARTMENT OF DEFENCE 2020/21<br>
slide2. Aim Information brief to the
Portfolio Committee on Defence and Military Veterans
on the DOD Q1 Performance Report
for FY2020/21 2<br>
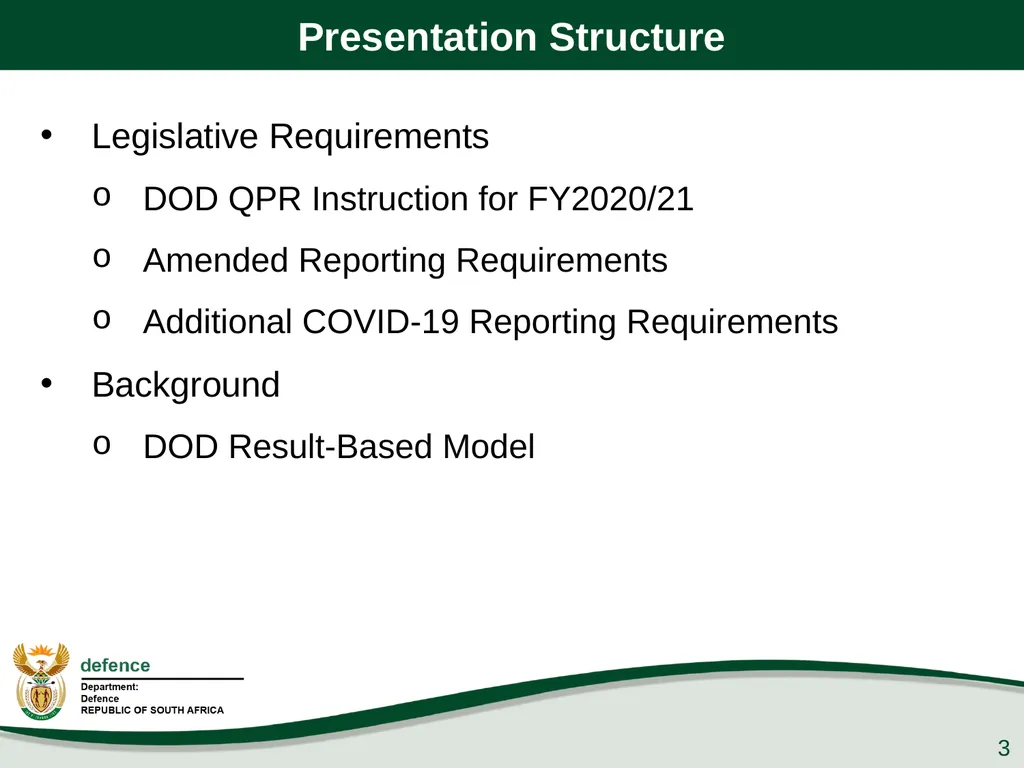
slide3. Presentation Structure Legislative Requirements
DOD QPR Instruction for FY2020/21
Amended Reporting Requirements
Additional COVID-19 Reporting Requirements
Background
DOD Result-Based Model 3<br>
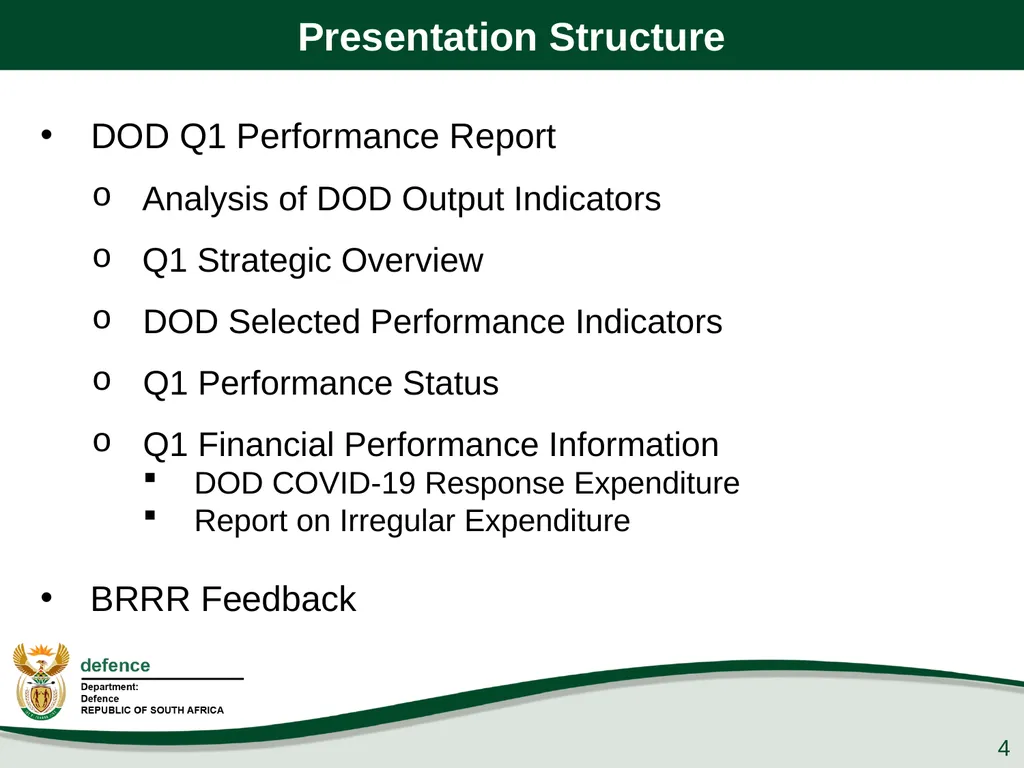
slide4. Presentation Structure DOD Q1 Performance Report
Analysis of DOD Output Indicators
Q1 Strategic Overview
DOD Selected Performance Indicators
Q1 Performance Status
Q1 Financial Performance Information
DOD COVID-19 Response Expenditure
Report on Irregular Expenditure
BRRR Feedback 4<br>
slide5. Legislative Requirements In terms of Section 38(1)(a)(i) and (ii) of the PFMA, 1999 as amended, the “Accounting Officer for a department must ensure that the department has and maintains effective, efficient and transparent systems of financial and risk management and internal control; and a system of internal audit under the control and direction of an audit committee”.
The Treasury Regulations, section 5.3.1 states that, the Accounting Officer of an institution must establish procedures for quarterly reporting to the Executive Authority to facilitate effective performance monitoring, evaluation and corrective action. 5<br>
slide6. Legislative Requirements The Revised NT Framework for Strategic Plans and Annual Performance Plans, states that QPRs “give information about progress on implementing an institution’s APP on a quarterly basis, with particular reference to performance against outputs”
The DOD Quarterly Performance Report Instruction No 0014/2020 gave effect to the legislative framework applicable on QPRs, and provided DOD unique guidelines for the compilation of respective QPRs. 6<br>
slide7. Amended Legislative Requirements The DPME 2020/21 Guidelines for National Quarterly Reports states that:
“Reporting on both financial and non-financial performance is important in measuring the performance of government institutions. Non-financial information is essential for assessing progress towards predetermined service delivery performance targets”.
“Performance information allows for a results-based management approach, where results or performance can be regularly measured in order to recognise success and failure, and to adjust strategy accordingly”. 7<br>
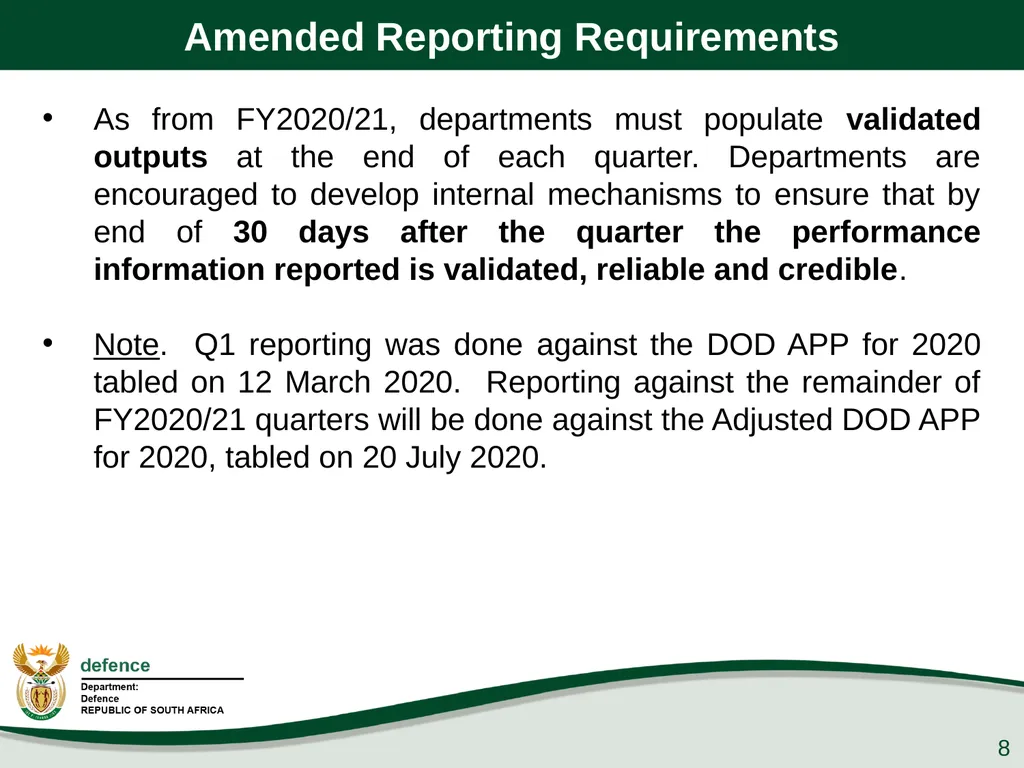
slide8. Amended Reporting Requirements As from FY2020/21, departments must populate validated outputs at the end of each quarter. Departments are encouraged to develop internal mechanisms to ensure that by end of 30 days after the quarter the performance information reported is validated, reliable and credible.
Note. Q1 reporting was done against the DOD APP for 2020 tabled on 12 March 2020. Reporting against the remainder of FY2020/21 quarters will be done against the Adjusted DOD APP for 2020, tabled on 20 July 2020. 8<br>
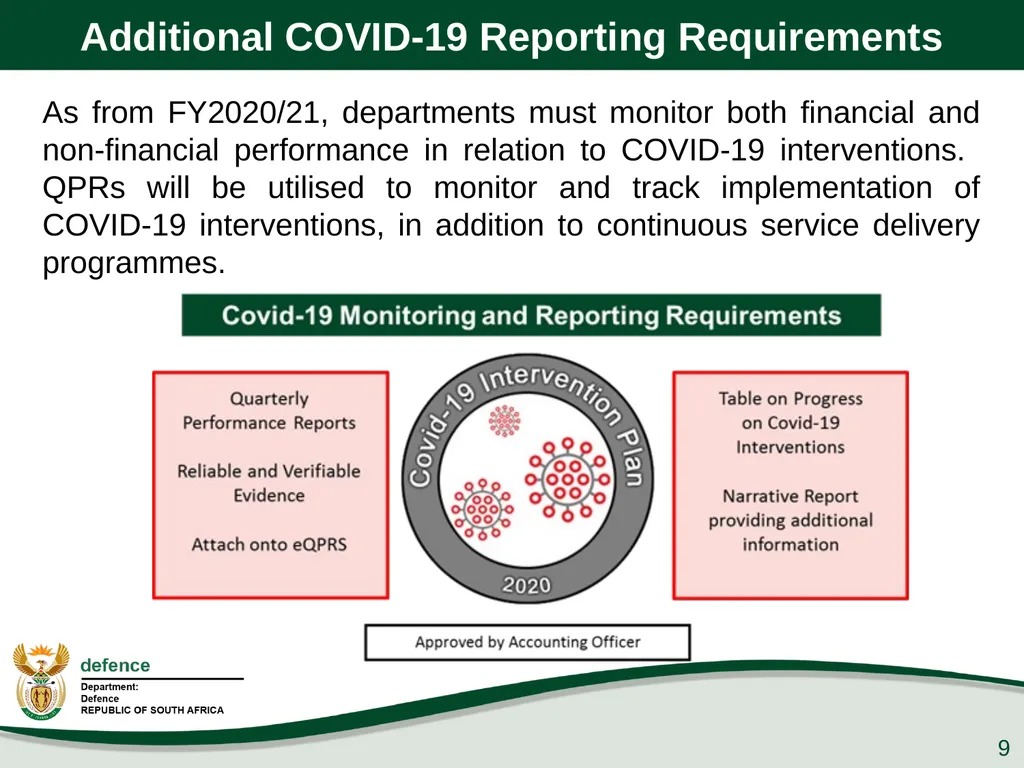
slide9. Additional COVID-19 Reporting Requirements As from FY2020/21, departments must monitor both financial and non-financial performance in relation to COVID-19 interventions. QPRs will be utilised to monitor and track implementation of COVID-19 interventions, in addition to continuous service delivery programmes. 9<br>
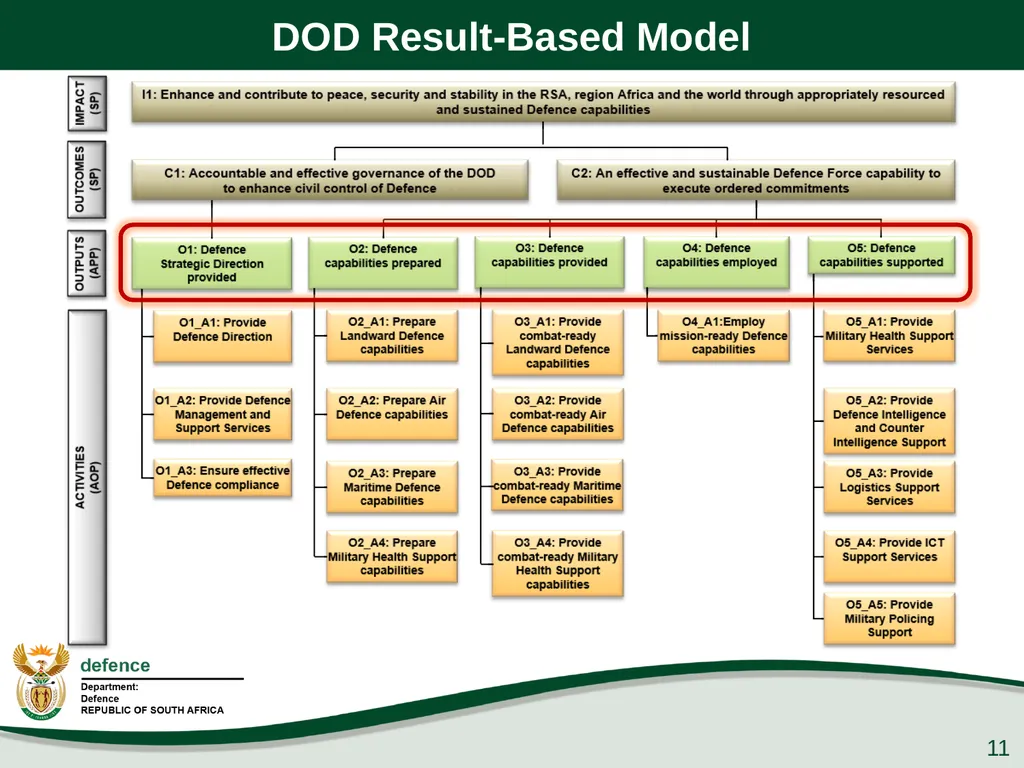
slide10. Background The DOD institutionalised the Result-Based Management Framework as prescribed in the Revised Framework with effect from FY2020/21 as a tool to ensure that the Department fulfils its Constitutional mandate as expressed in terms of the intended impact, outcomes and outputs. 10<br>
slide11. DOD Result-Based Model 11<br>
slide12. DOD Q1 Performance
Report<br>
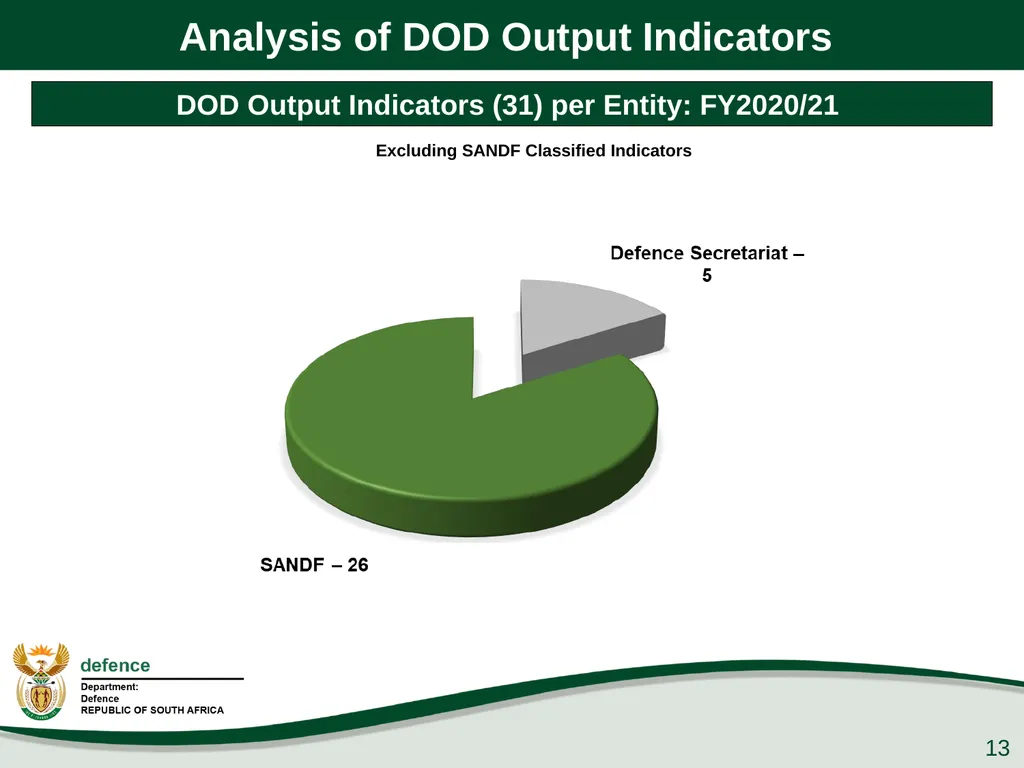
slide13. Analysis of DOD Output Indicators 13 DOD Output Indicators (31) per Entity: FY2020/21 Excluding SANDF Classified Indicators<br>
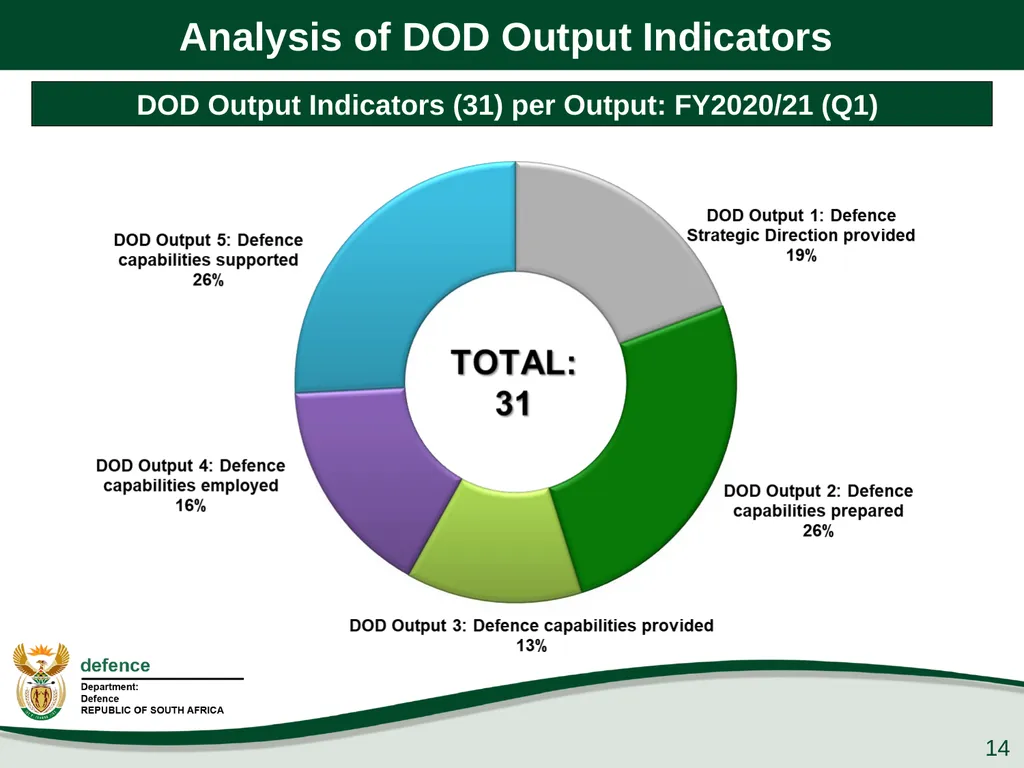
slide14. Analysis of DOD Output Indicators 14 DOD Output Indicators (31) per Output: FY2020/21 (Q1)<br>
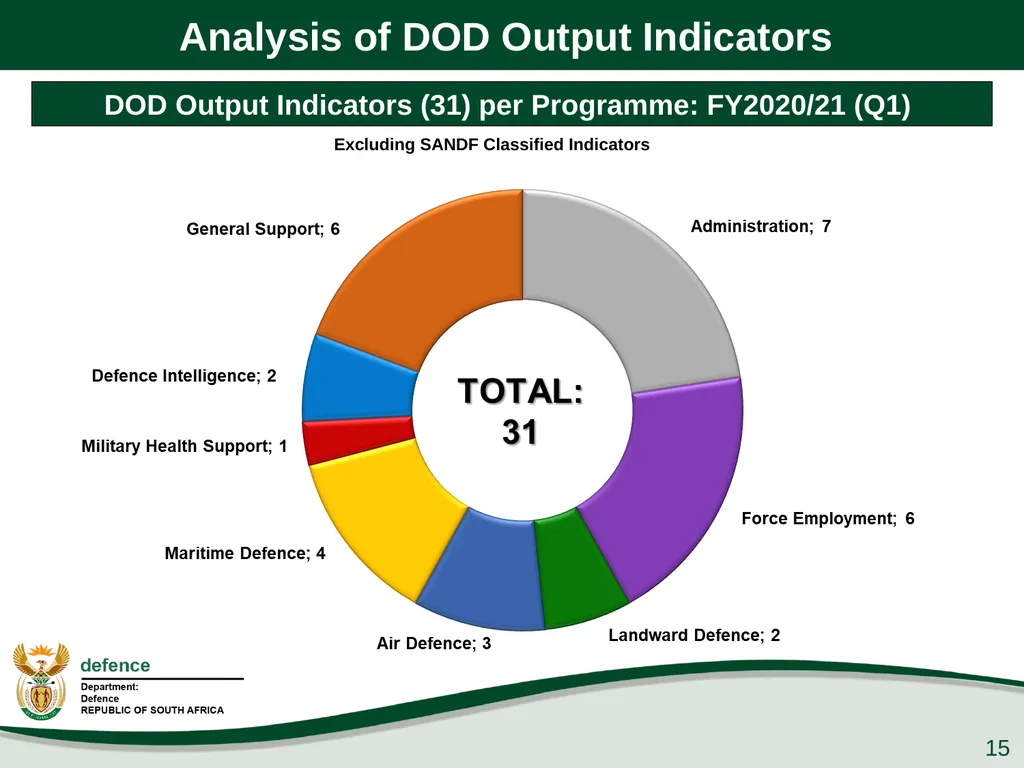
slide15. Analysis of DOD Output Indicators 15 Excluding SANDF Classified Indicators DOD Output Indicators (31) per Programme: FY2020/21 (Q1)<br>
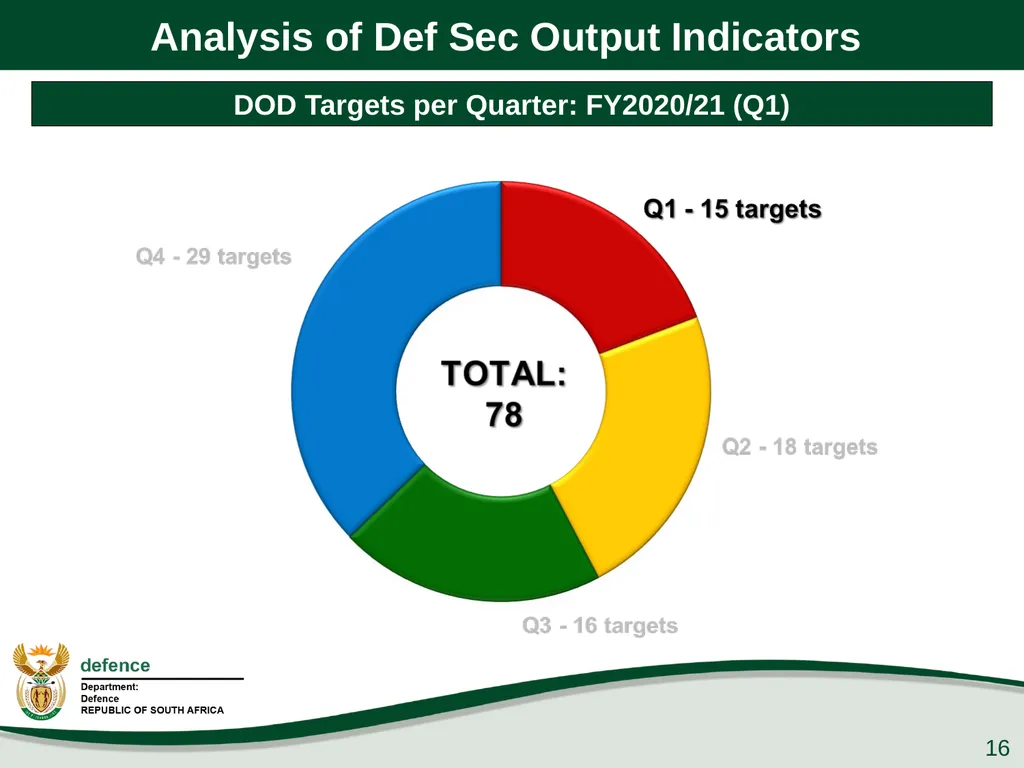
slide16. Analysis of Def Sec Output Indicators 16 DOD Targets per Quarter: FY2020/21 (Q1)<br>
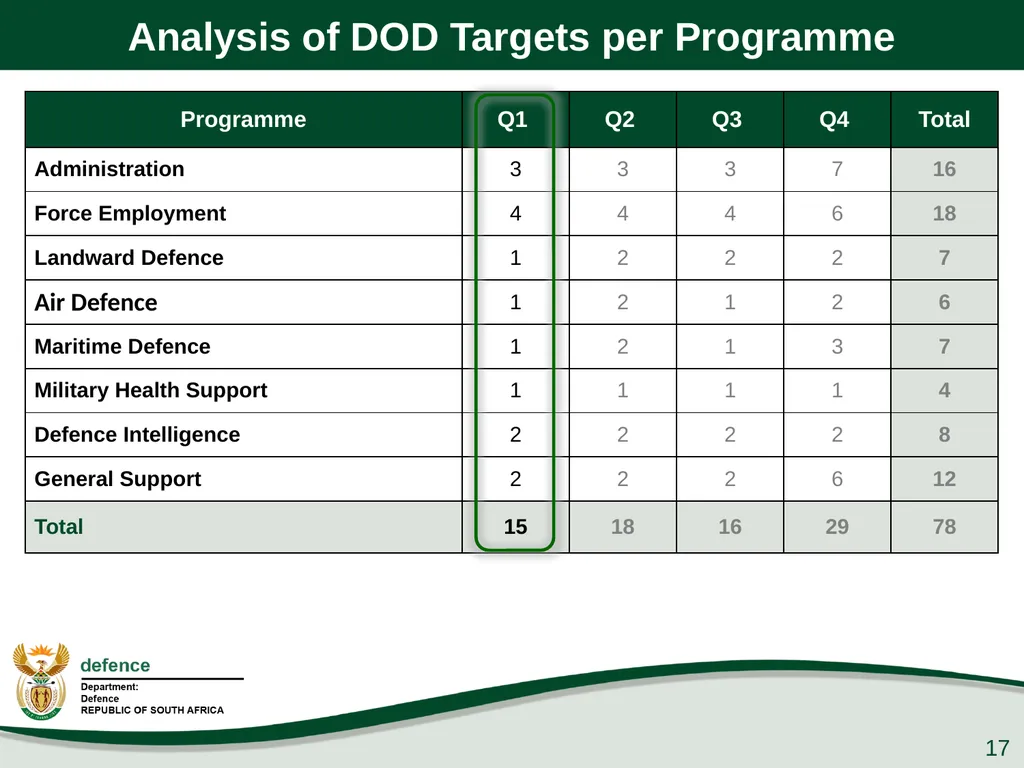
slide17. Analysis of DOD Targets per Programme 17<br>
slide18. Q1 Strategic Overview<br>
slide19. Corporate Governance and Accountability During the period under review, the Secretary for Defence provided strategic direction to the DOD through various governance activities and interventions.
These included timely decision-making on strategic and defence diplomacy matters, effective management and processing of official departmental documents, chairing of various DOD management bodies, as well as the attendance of Director-Generals’ meetings, Cabinet Lekgotlas and Government Clusters. 19<br>
slide20. Corporate Governance and Accountability The declaration of a ‘National State of Disaster’ in terms of the Disaster Management Act, 2002, required government to provide an integrated and coordinated disaster management mechanism that would focus on managing and mitigating the impact of the COVID-19 Coronavirus pandemic.
To this end, the President appointed the JCPS Cluster Co-Chairpersons to coordinate, facilitate and integrate the ‘all of government approach’ to the efforts of the key work groups that would be established to focus on COVID-19.
In addition, the President instructed that the National Joint Operational and Intelligence Structure would serve as the custodian of all reports during this crisis. 20<br>
slide21. Corporate Governance and Accountability These work groups were made up of communication experts, educators, actuaries, scientists, health specialists, engineers, disaster management centre representatives, legal advisors, the top-level leadership of the country’s intelligence, security and law-enforcement agencies as well as teams from the departments that constitute the economic and social clusters of the FOSAD.
The Secretary for Defence was responsible to Co-Chair the JCPS Cluster of Government at DG level. 21<br>
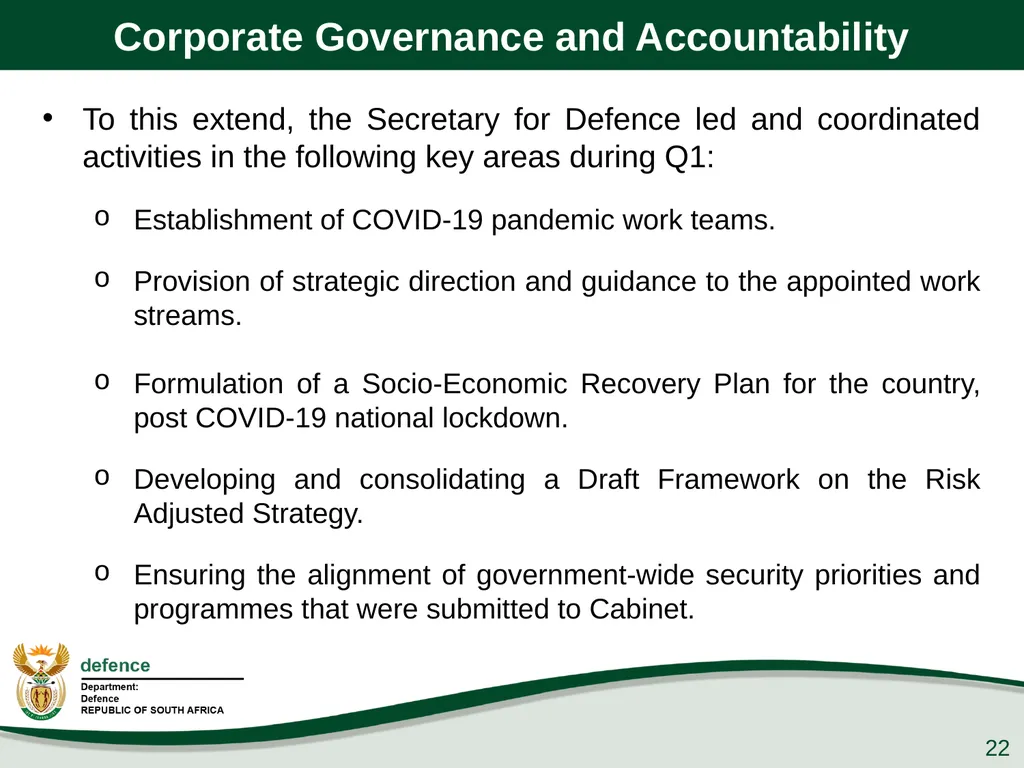
slide22. Corporate Governance and Accountability To this extend, the Secretary for Defence led and coordinated activities in the following key areas during Q1:
Establishment of COVID-19 pandemic work teams.
Provision of strategic direction and guidance to the appointed work streams.
Formulation of a Socio-Economic Recovery Plan for the country, post COVID-19 national lockdown.
Developing and consolidating a Draft Framework on the Risk Adjusted Strategy.
Ensuring the alignment of government-wide security priorities and programmes that were submitted to Cabinet. 22<br>
slide23. Corporate Human Resource Status The DOD requires an average HR strength of 77 000. In order to assure a more sustainable defence capability, an average HR strength of 75 000 will be maintained during FY2020/21, supplemented by planned Reserve Force mandays of 2 695 963.
This will result in a projected shortfall of Rb3,017 on the CoE budget for FY2020/21.
The DOD’s actual strength as at 30 June 2020 was 73 595, which was below the planned average strength of 75 227 for June 2020. 23<br>
slide24. Corporate Human Resource Status The NT letter: “Request to Increase the Compensation of Employees’ Budget Limit of the DOD by Rb2,625 in FY2019/20” dated 17 March 2020, indicated that the request from the DOD to increase the FY2019/20 CoE ceiling was not supported.
The DOD received an additional allocation via the 2020 Special Adjustment Budget of Rm763,4, in support of its COVID-19 response. This allocation is specifically and exclusively appropriated and is aligned to the expenditure in terms of allowances paid and projected payments.
It is projected that the funded HR strength will continue to decrease due to higher than anticipated attrition within the Department. 24<br>
slide25. Command of Forces MTSF 2019 – 2024 Priorities
During the quarter under review, the SANDF supported the following MTSF Priorities:
Priority 6: “Social Cohesion and Safer Communities”
(Support to the People)
Priority 7: “A Better Africa and a Better World”
(Regional Security) 25<br>
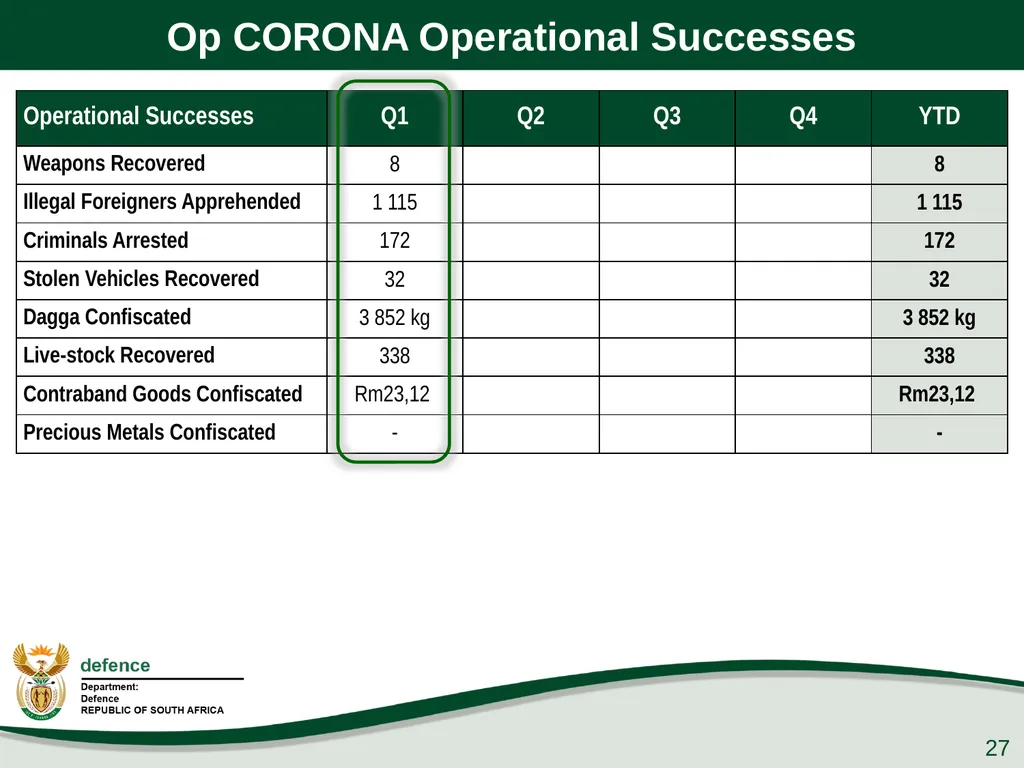
slide26. Command of Forces In terms of Support to the People, the SANDF deployed 15 sub-units to execute Op CORONA (Border Safeguarding) in Limpopo, Mpumalanga, KwaZulu-Natal, Free State, Eastern Cape, Northern Cape and North-West Provinces.
Efforts to contribute towards Op PHAKISA objectives continued through the conduct of two Op CORONA coastal patrols during Q1. 26<br>
slide27. Op CORONA Operational Successes 27<br>
slide28. Command of Forces In support to Government Departments (Op PROSPER), the SANDF operational concept for Safety and Security Support is to employ multi-rolled military capabilities on request and according to the prescripts of the Defence Act 42 of 2002. The SANDF was not requested to provide assistance during Q1.
In terms of Disaster Aid and Relief (Op CHARIOT), the SANDF was not requested to provide assistance during Q1. 28<br>
slide29. Command of Forces In terms of search and rescue (Op ARABELLA), the SANDF provided assistance in the:
The CASEVAC of a passenger who suffered a heart attack aboard the Queen Mary 2, 216nm South West of the Coast of Durban. An Oryx helicopter from 15 Squadron successfully retrieved the patient in challenging conditions and delivered him safely to hospital for urgent treatment on 02 April 2020.
On 06 May 2020, an Oryx helicopter from 15 Squadron conducted a CASEVAC 7nm offshore of Park Rynie in the KwaZulu-Natal South Coast. A sailor on board a bulk motor carrier fell ill and had to be evacuated to a hospital facility in Durban.
The SANDF supported to the national effort to mitigate the spread of COVID-19 (Op NOTLELA) from 24 March 2020 to date. 29<br>
slide30. Command of Forces In terms of Regional Security the SANDF continued to provide Force Structure Elements to the United Nations PSO in the DRC (Op MISTRAL). These included:
SANDF Specialist Contingent in Kinshasa
Force Intervention Battalion Group in Sake Base
Composite Helicopter Unit in Goma
Due to the need to harness the limited number of operationally available SA Navy platforms for deployment in Op NOTLELA, it was decided that there will be no Op COPPER long range deployment in the Mozambique Channel during Q1. 30<br>
slide31. DOD Selected
(included in the ENE) Performance Indicators<br>
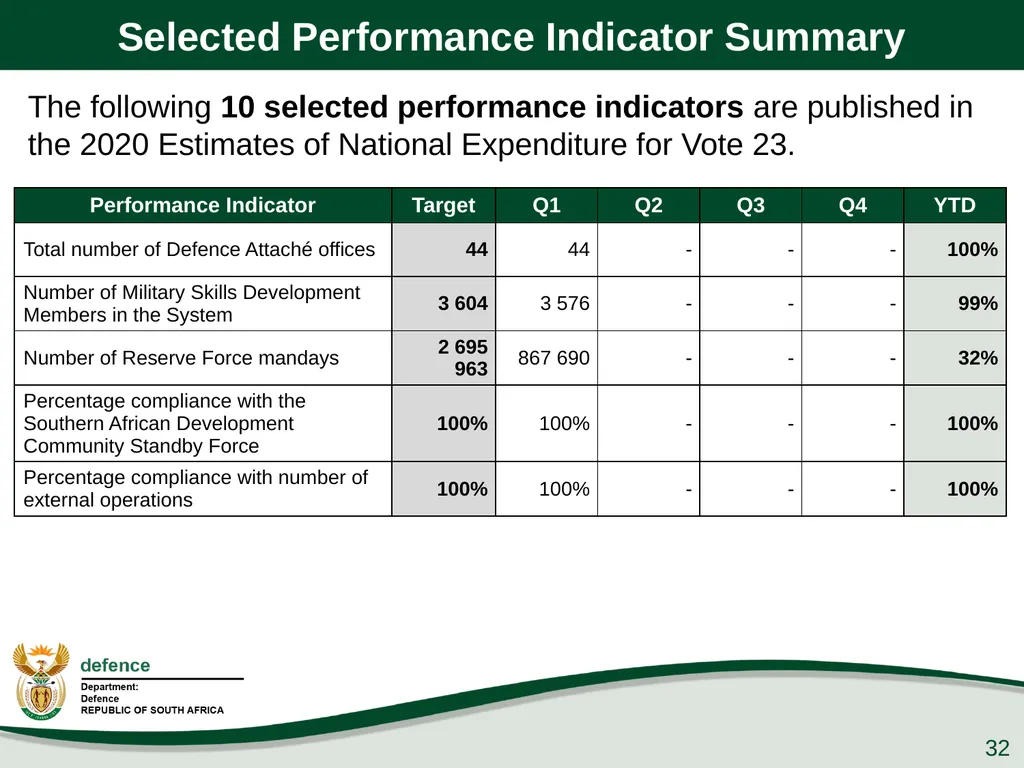
slide32. Selected Performance Indicator Summary 32 The following 10 selected performance indicators are published in the 2020 Estimates of National Expenditure for Vote 23.<br>
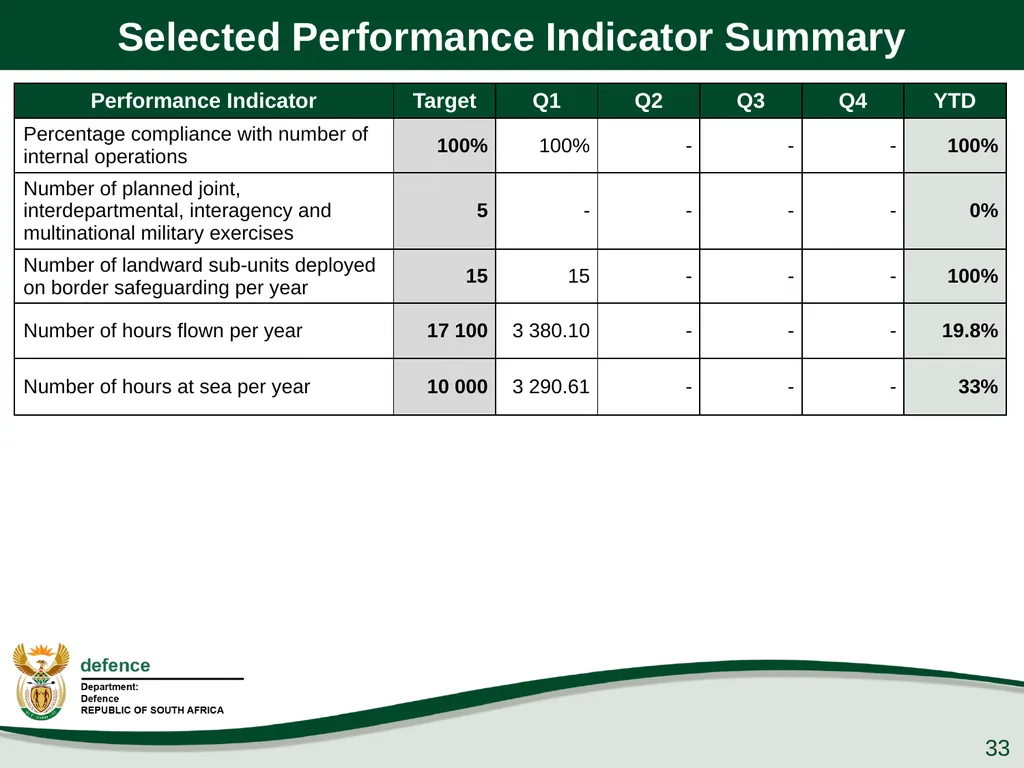
slide33. Selected Performance Indicator Summary 33<br>
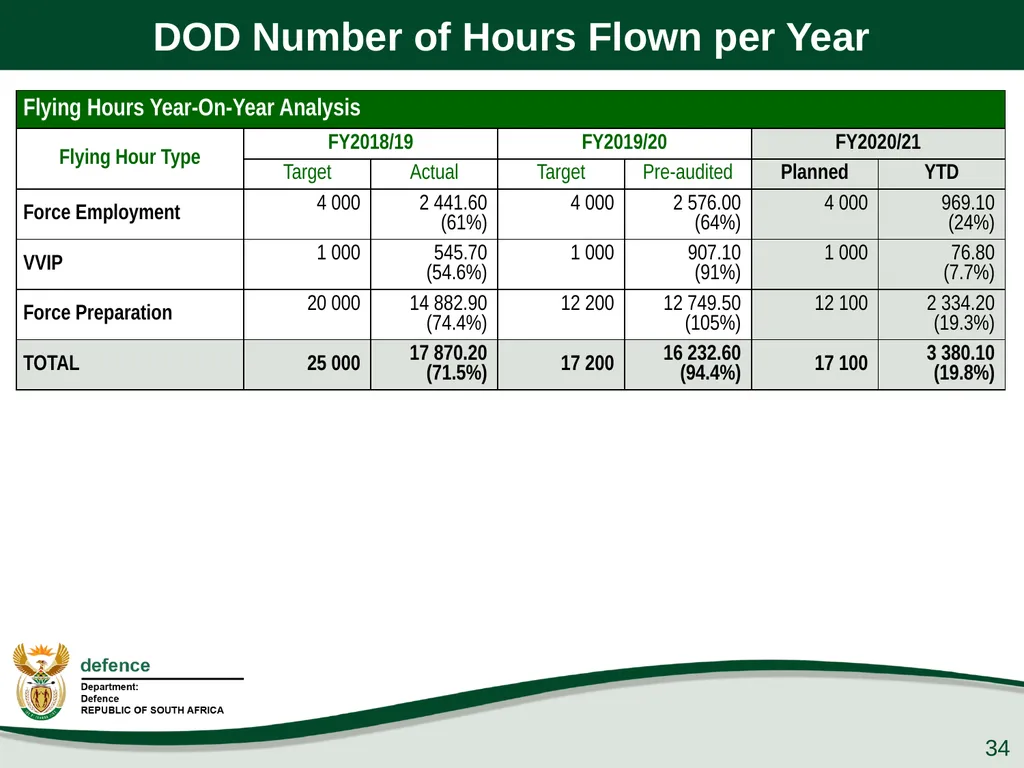
slide34. DOD Number of Hours Flown per Year 34<br>
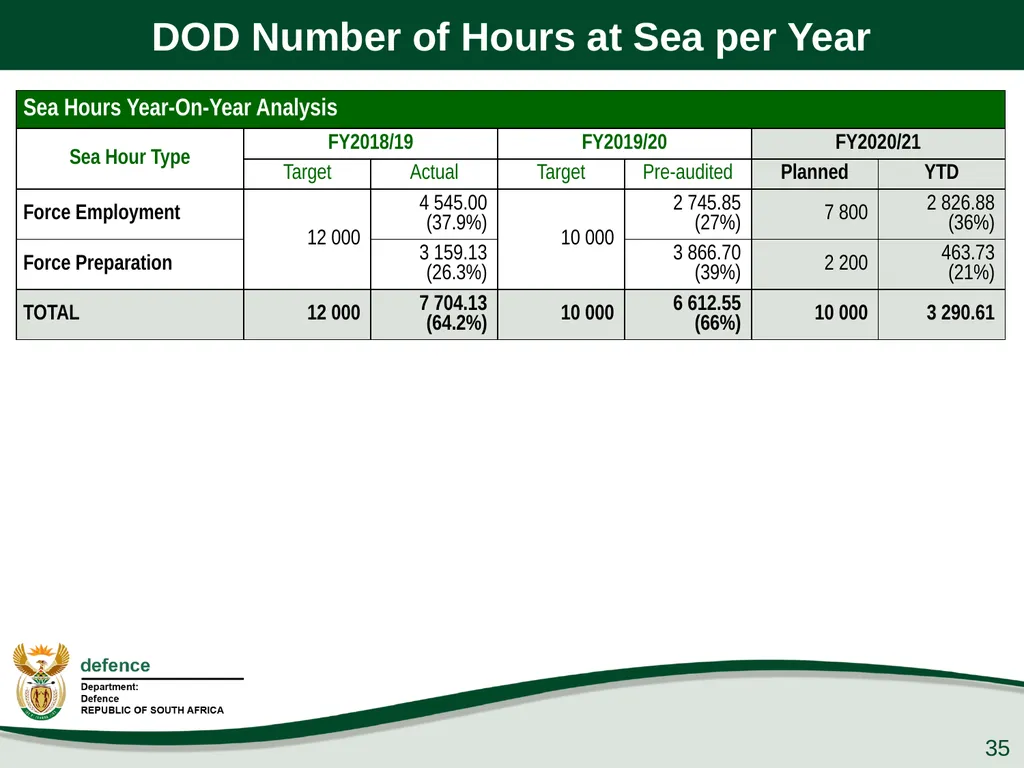
slide35. DOD Number of Hours at Sea per Year 35<br>
slide36. Q1 Performance Status<br>
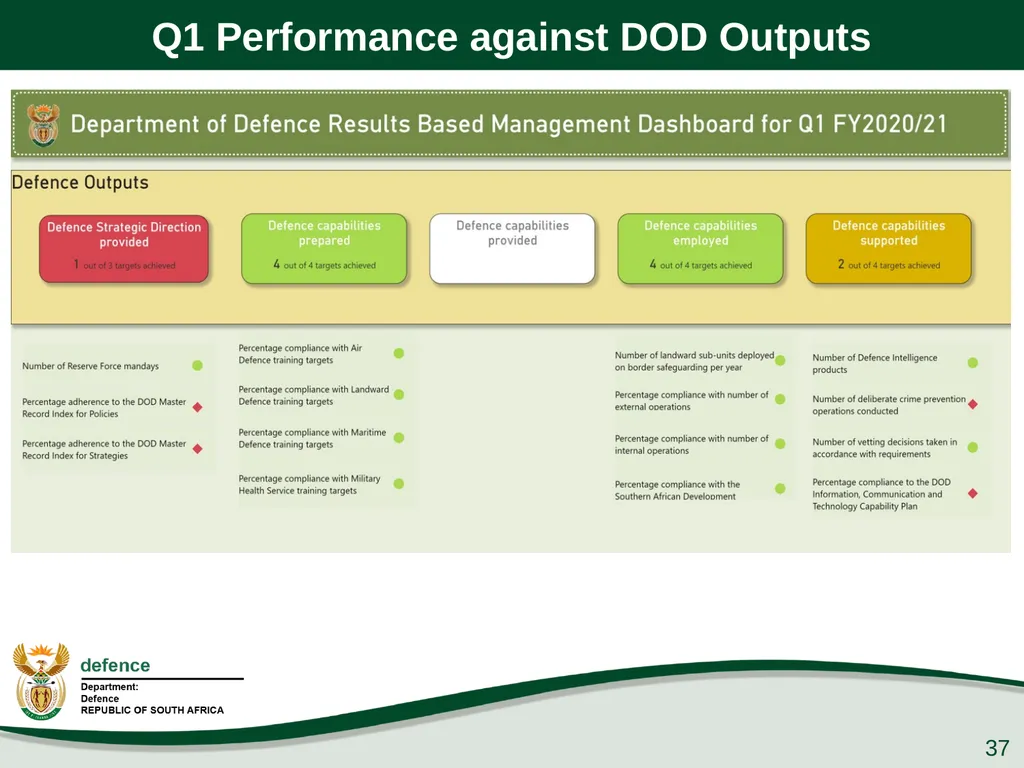
slide37. Q1 Performance against DOD Outputs 37<br>
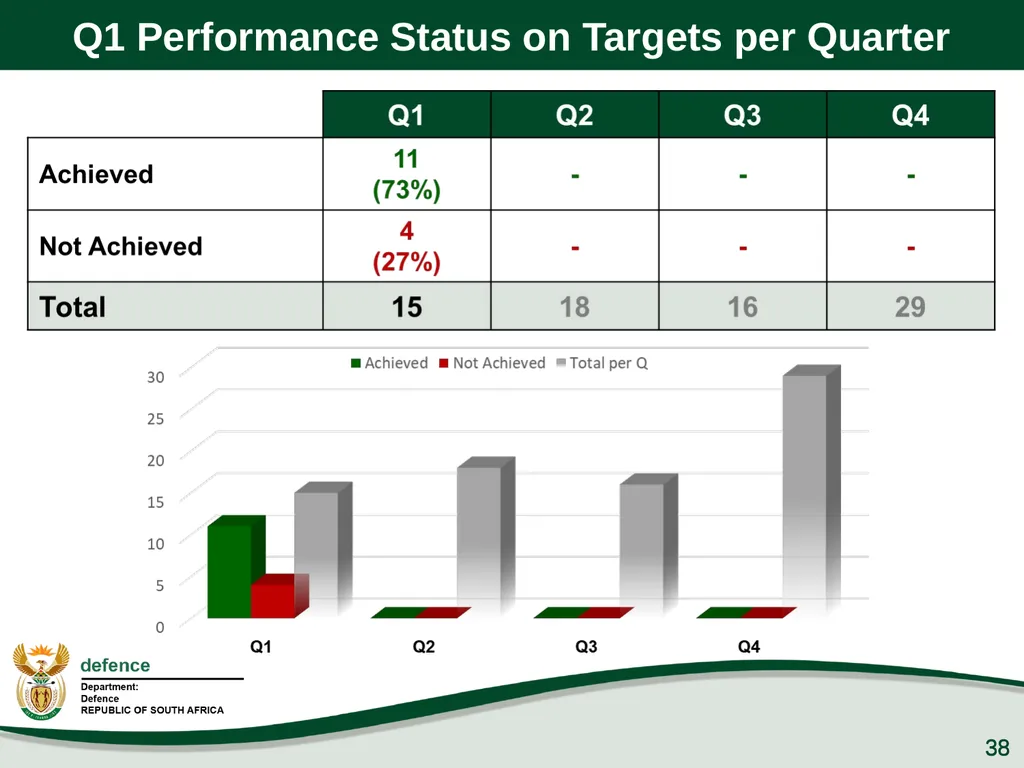
slide38. Q1 Performance Status on Targets per Quarter 38 38<br>
slide39. Q1 Financial Performance Information<br>
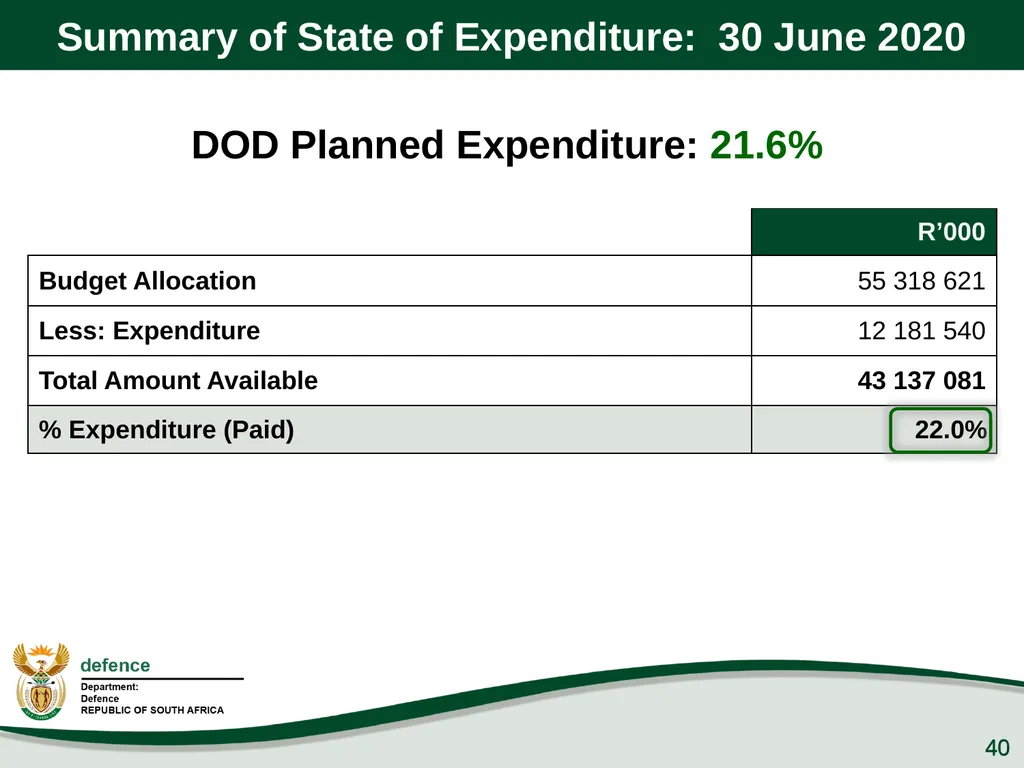
slide40. Summary of State of Expenditure: 30 June 2020 40 40 DOD Planned Expenditure: 21.6%<br>
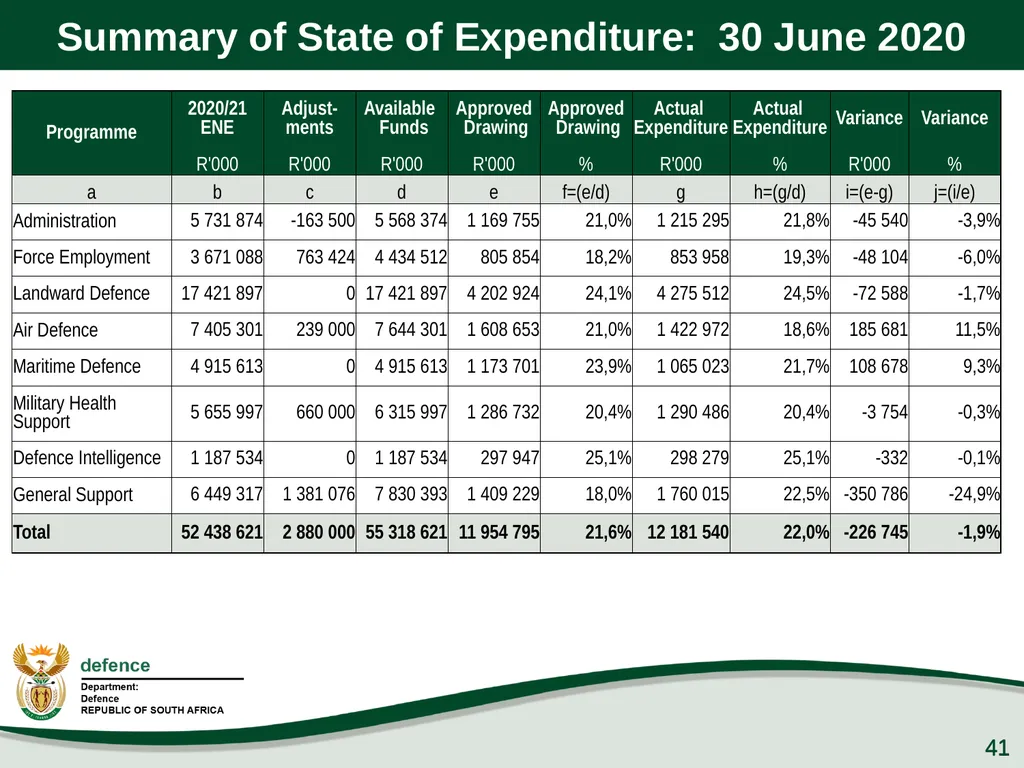
slide41. Summary of State of Expenditure: 30 June 2020 41 41<br>
slide42. Comments on of State of Expenditure per
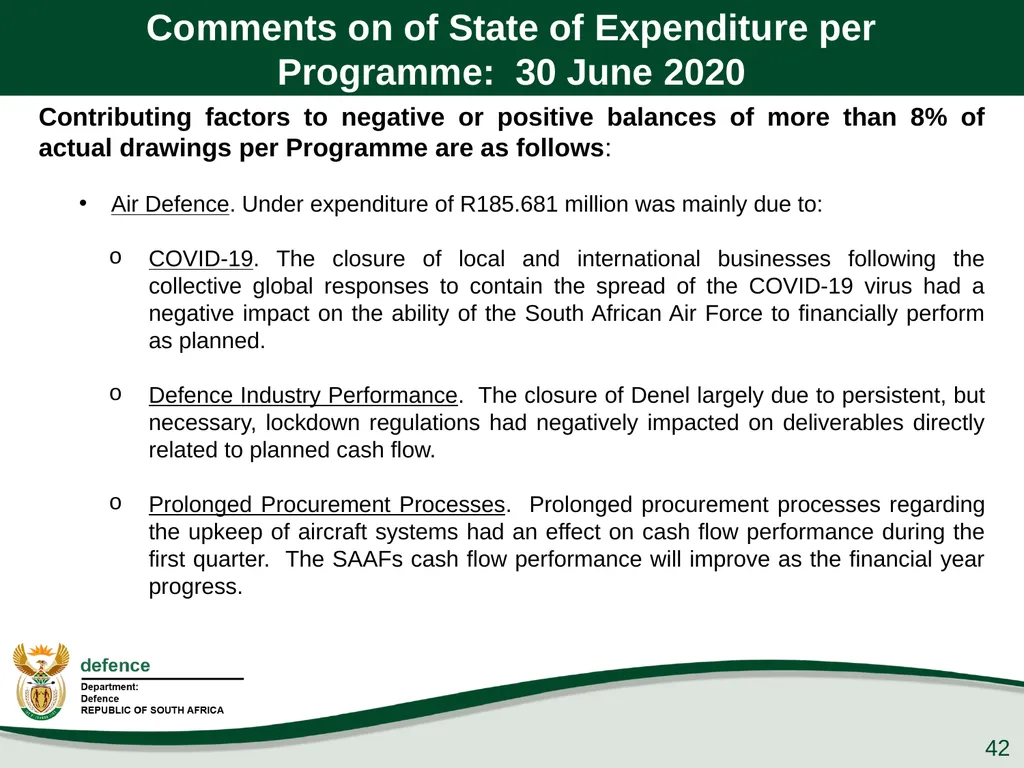
Programme: 30 June 2020 42 Contributing factors to negative or positive balances of more than 8% of actual drawings per Programme are as follows:
Air Defence. Under expenditure of R185.681 million was mainly due to:
COVID-19. The closure of local and international businesses following the collective global responses to contain the spread of the COVID-19 virus had a negative impact on the ability of the South African Air Force to financially perform as planned.
Defence Industry Performance. The closure of Denel largely due to persistent, but necessary, lockdown regulations had negatively impacted on deliverables directly related to planned cash flow.
Prolonged Procurement Processes. Prolonged procurement processes regarding the upkeep of aircraft systems had an effect on cash flow performance during the first quarter. The SAAFs cash flow performance will improve as the financial year progress.<br>
slide43. Comments on of State of Expenditure per
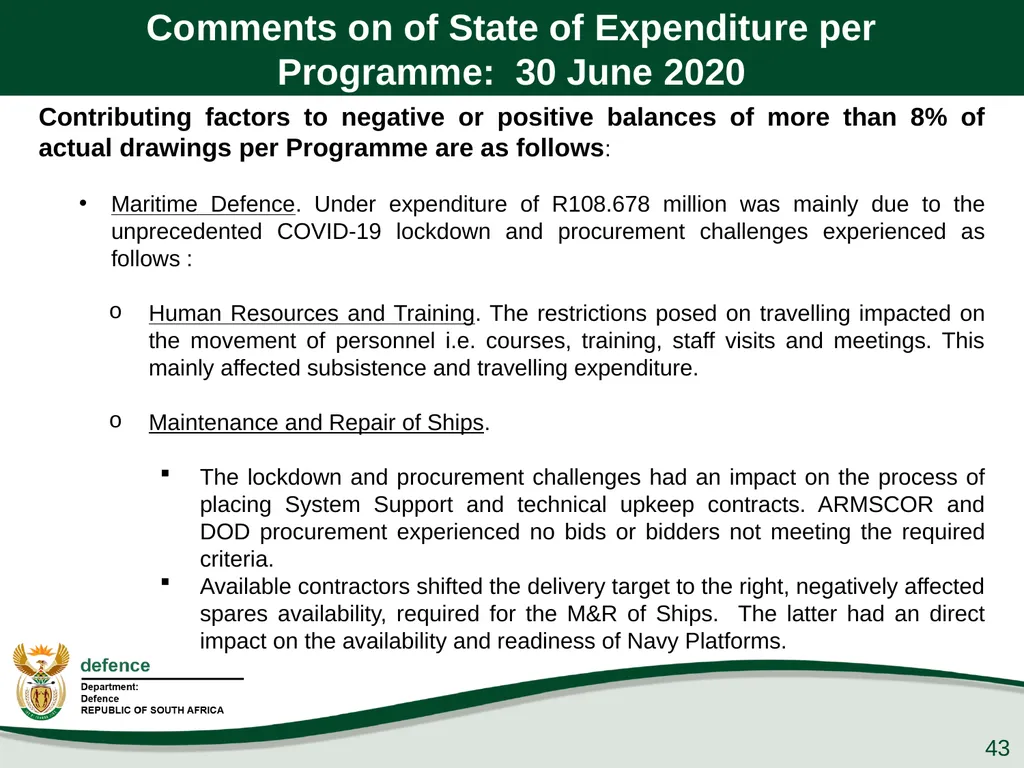
Programme: 30 June 2020 43 Contributing factors to negative or positive balances of more than 8% of actual drawings per Programme are as follows:
Maritime Defence. Under expenditure of R108.678 million was mainly due to the unprecedented COVID-19 lockdown and procurement challenges experienced as follows :
Human Resources and Training. The restrictions posed on travelling impacted on the movement of personnel i.e. courses, training, staff visits and meetings. This mainly affected subsistence and travelling expenditure.
Maintenance and Repair of Ships.
The lockdown and procurement challenges had an impact on the process of placing System Support and technical upkeep contracts. ARMSCOR and DOD procurement experienced no bids or bidders not meeting the required criteria.
Available contractors shifted the delivery target to the right, negatively affected spares availability, required for the M&R of Ships. The latter had an direct impact on the availability and readiness of Navy Platforms.<br>
slide44. Comments on of State of Expenditure per
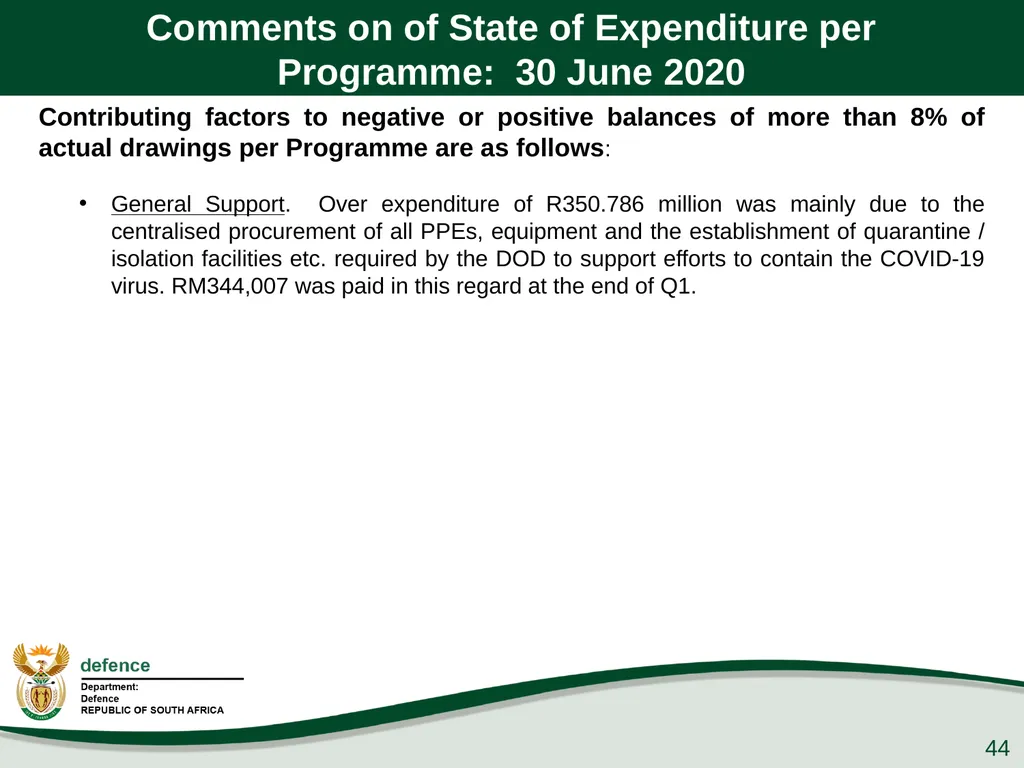
Programme: 30 June 2020 44 Contributing factors to negative or positive balances of more than 8% of actual drawings per Programme are as follows:
General Support. Over expenditure of R350.786 million was mainly due to the centralised procurement of all PPEs, equipment and the establishment of quarantine / isolation facilities etc. required by the DOD to support efforts to contain the COVID-19 virus. RM344,007 was paid in this regard at the end of Q1.<br>
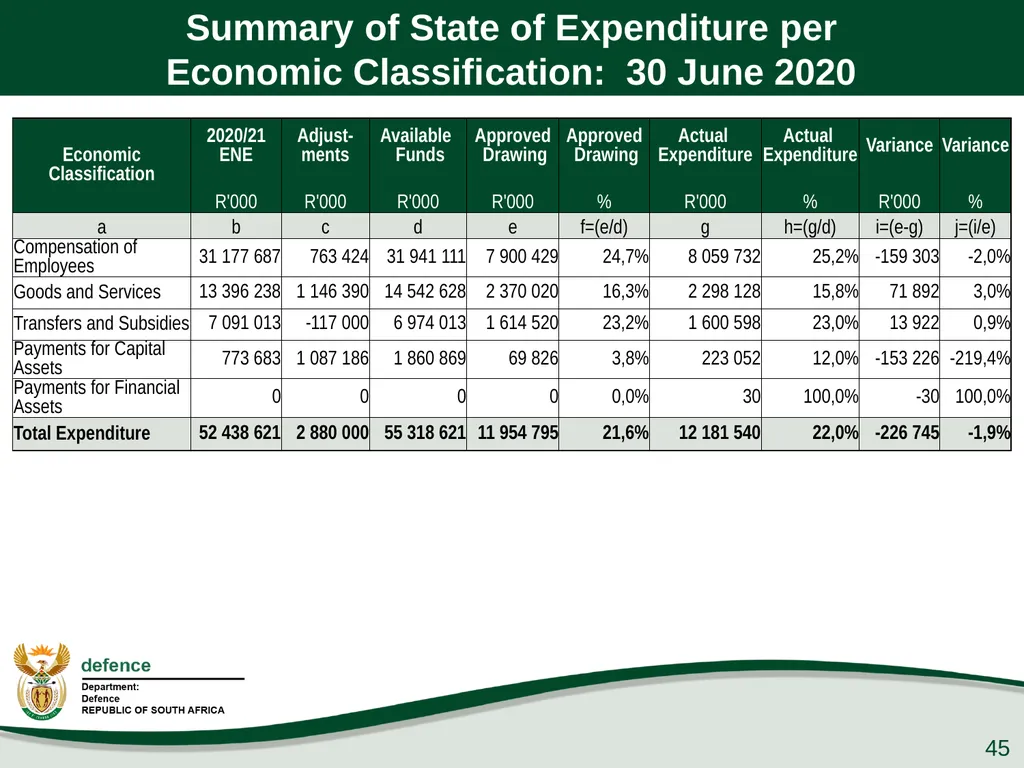
slide45. Summary of State of Expenditure per
Economic Classification: 30 June 2020 45<br>
slide46. Comments on of State of Expenditure per
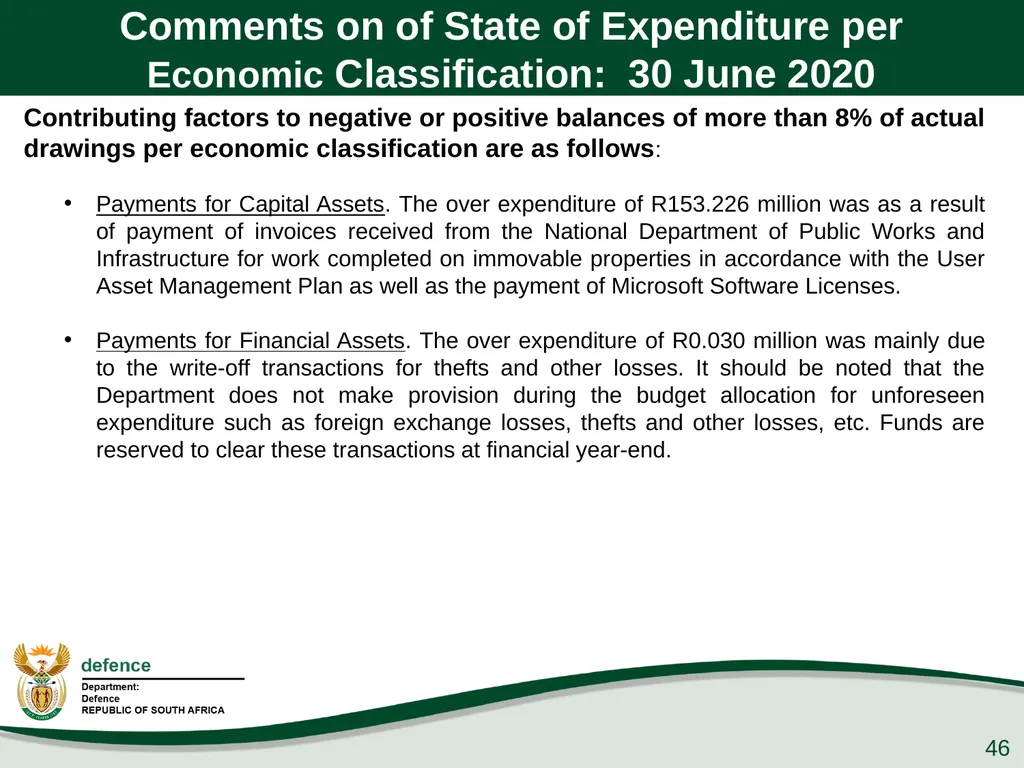
Economic Classification: 30 June 2020 46 Contributing factors to negative or positive balances of more than 8% of actual drawings per economic classification are as follows:
Payments for Capital Assets. The over expenditure of R153.226 million was as a result of payment of invoices received from the National Department of Public Works and Infrastructure for work completed on immovable properties in accordance with the User Asset Management Plan as well as the payment of Microsoft Software Licenses.
Payments for Financial Assets. The over expenditure of R0.030 million was mainly due to the write-off transactions for thefts and other losses. It should be noted that the Department does not make provision during the budget allocation for unforeseen expenditure such as foreign exchange losses, thefts and other losses, etc. Funds are reserved to clear these transactions at financial year-end.<br>
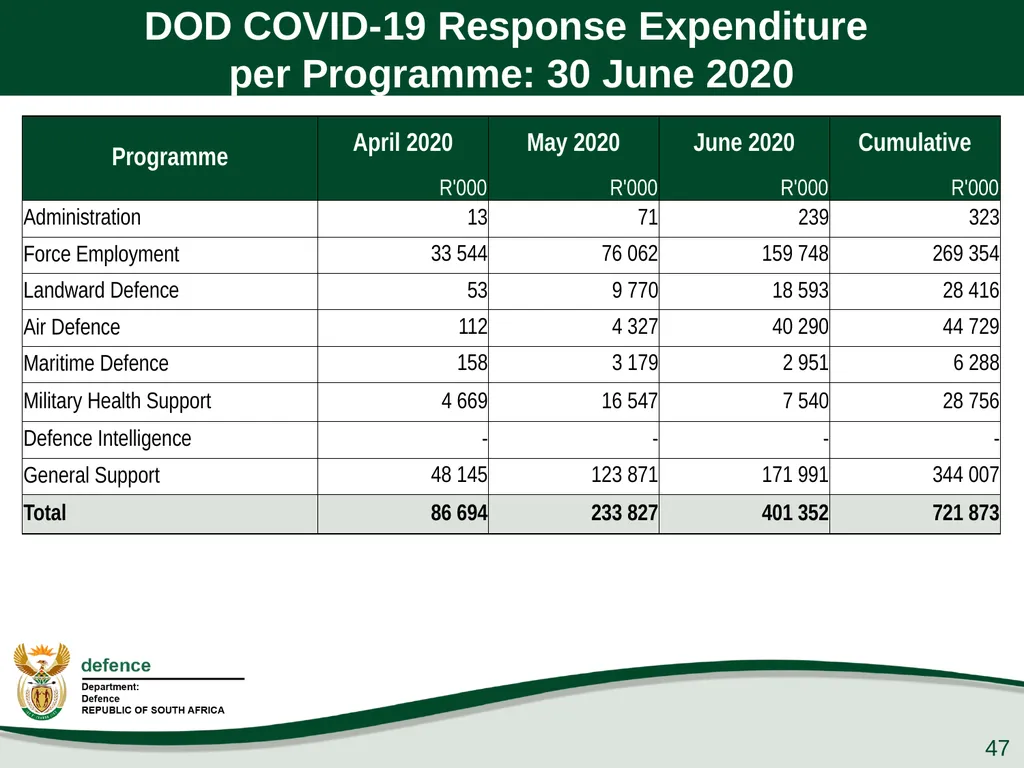
slide47. DOD COVID-19 Response Expenditure per Programme: 30 June 2020 47<br>
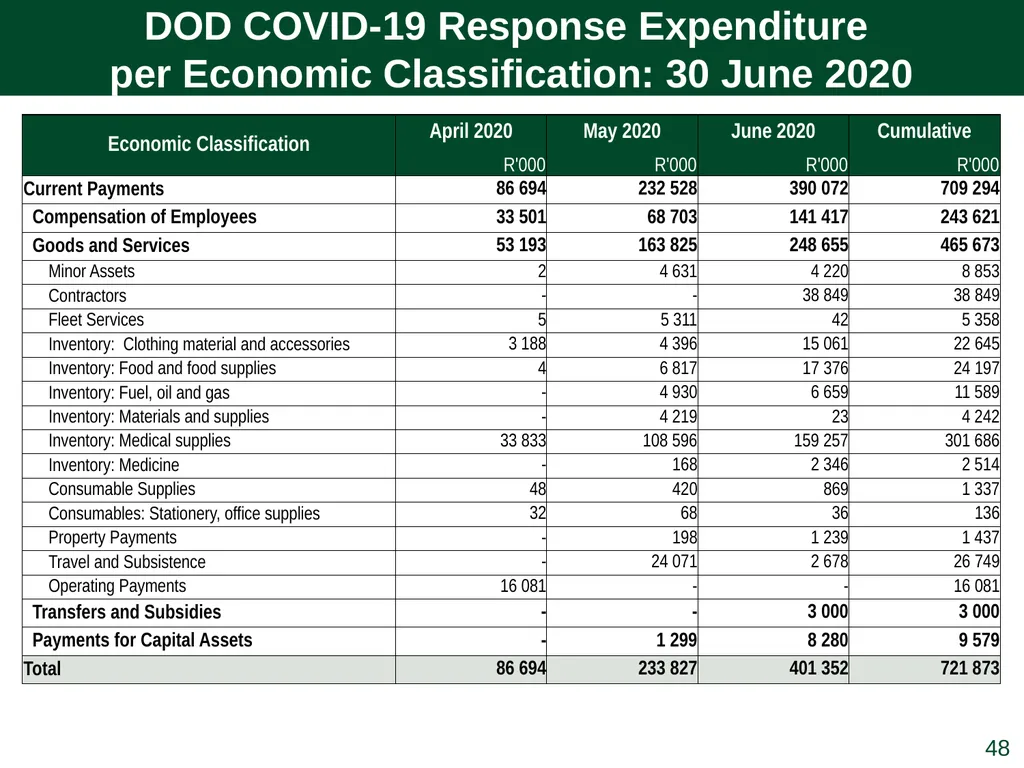
slide48. DOD COVID-19 Response Expenditure per Economic Classification: 30 June 2020 48<br>
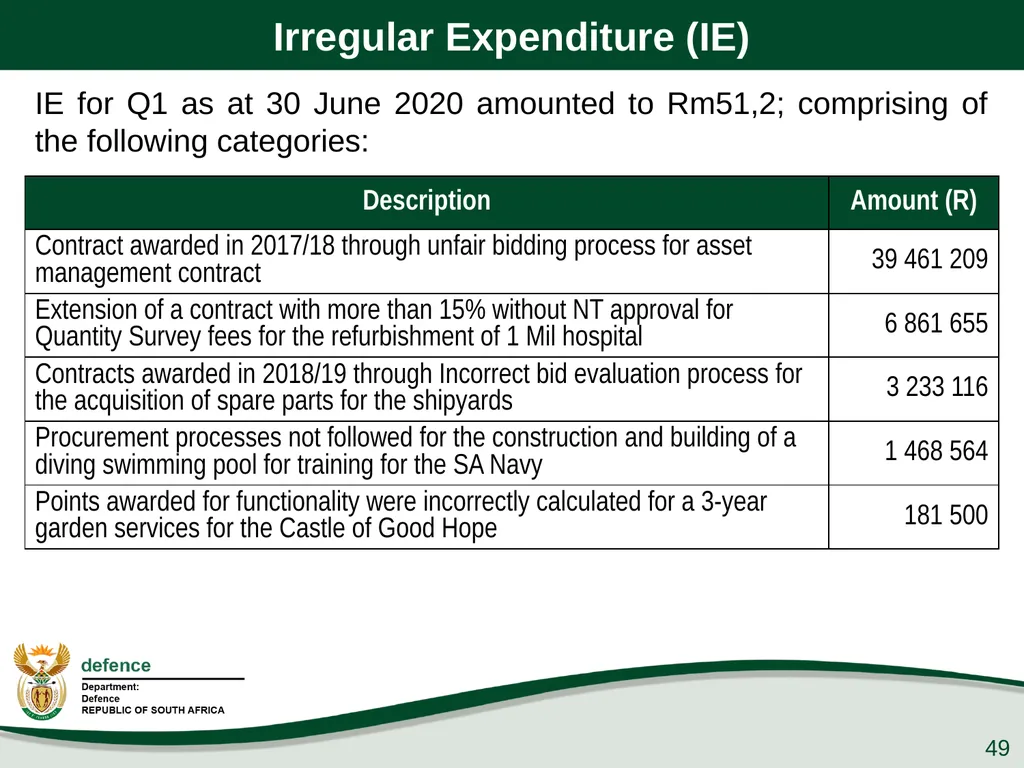
slide49. Irregular Expenditure (IE) 49 IE for Q1 as at 30 June 2020 amounted to Rm51,2; comprising of the following categories:<br>
slide50. BRRR Feedback<br>
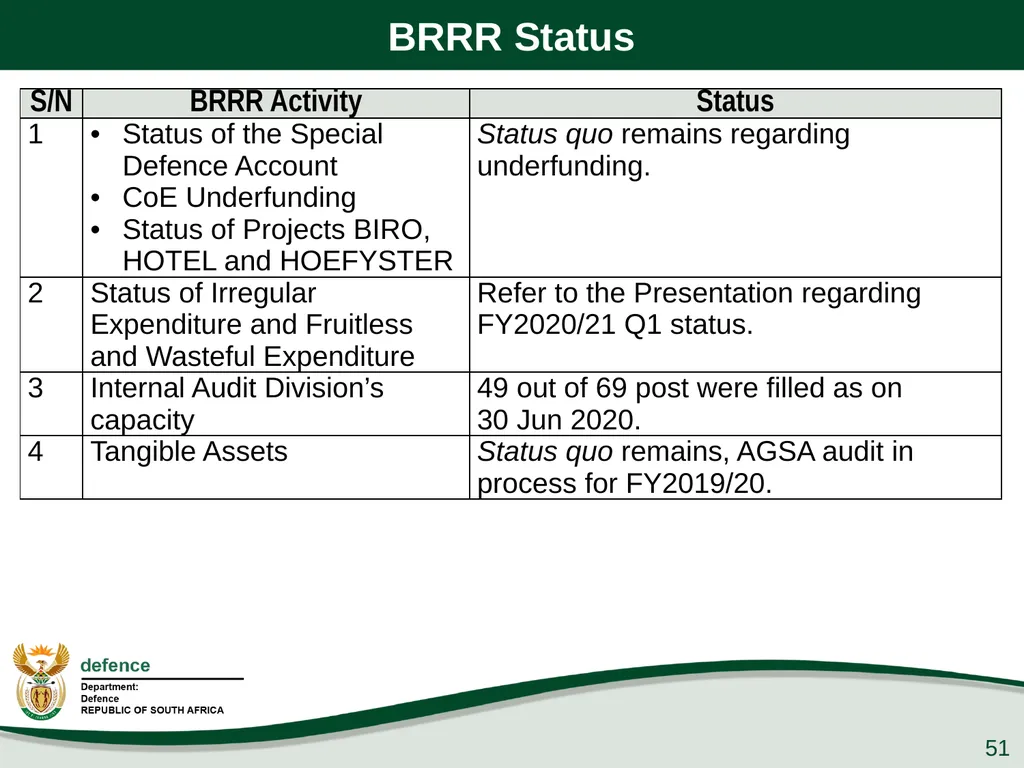
slide51. BRRR Status 51<br>
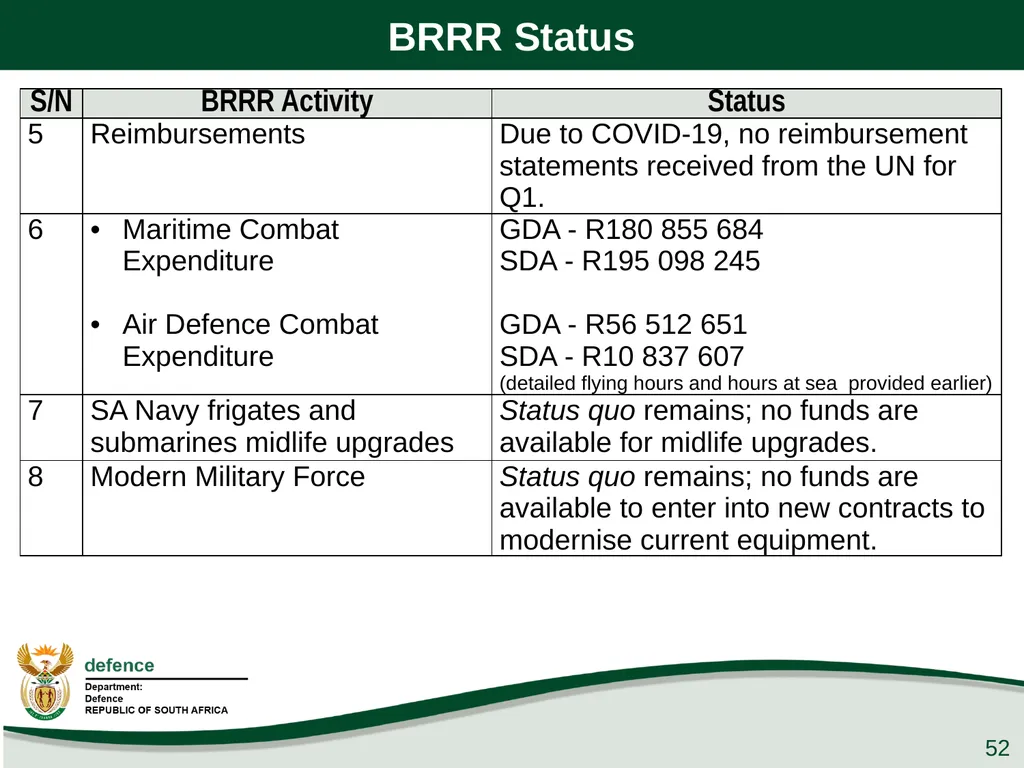
slide52. BRRR Status 52<br>
slide53. Thank you…<br>
slide2. Aim Information brief to the
Portfolio Committee on Defence and Military Veterans
on the DOD Q1 Performance Report
for FY2020/21 2<br>
slide3. Presentation Structure Legislative Requirements
DOD QPR Instruction for FY2020/21
Amended Reporting Requirements
Additional COVID-19 Reporting Requirements
Background
DOD Result-Based Model 3<br>
slide4. Presentation Structure DOD Q1 Performance Report
Analysis of DOD Output Indicators
Q1 Strategic Overview
DOD Selected Performance Indicators
Q1 Performance Status
Q1 Financial Performance Information
DOD COVID-19 Response Expenditure
Report on Irregular Expenditure
BRRR Feedback 4<br>
slide5. Legislative Requirements In terms of Section 38(1)(a)(i) and (ii) of the PFMA, 1999 as amended, the “Accounting Officer for a department must ensure that the department has and maintains effective, efficient and transparent systems of financial and risk management and internal control; and a system of internal audit under the control and direction of an audit committee”.
The Treasury Regulations, section 5.3.1 states that, the Accounting Officer of an institution must establish procedures for quarterly reporting to the Executive Authority to facilitate effective performance monitoring, evaluation and corrective action. 5<br>
slide6. Legislative Requirements The Revised NT Framework for Strategic Plans and Annual Performance Plans, states that QPRs “give information about progress on implementing an institution’s APP on a quarterly basis, with particular reference to performance against outputs”
The DOD Quarterly Performance Report Instruction No 0014/2020 gave effect to the legislative framework applicable on QPRs, and provided DOD unique guidelines for the compilation of respective QPRs. 6<br>
slide7. Amended Legislative Requirements The DPME 2020/21 Guidelines for National Quarterly Reports states that:
“Reporting on both financial and non-financial performance is important in measuring the performance of government institutions. Non-financial information is essential for assessing progress towards predetermined service delivery performance targets”.
“Performance information allows for a results-based management approach, where results or performance can be regularly measured in order to recognise success and failure, and to adjust strategy accordingly”. 7<br>
slide8. Amended Reporting Requirements As from FY2020/21, departments must populate validated outputs at the end of each quarter. Departments are encouraged to develop internal mechanisms to ensure that by end of 30 days after the quarter the performance information reported is validated, reliable and credible.
Note. Q1 reporting was done against the DOD APP for 2020 tabled on 12 March 2020. Reporting against the remainder of FY2020/21 quarters will be done against the Adjusted DOD APP for 2020, tabled on 20 July 2020. 8<br>
slide9. Additional COVID-19 Reporting Requirements As from FY2020/21, departments must monitor both financial and non-financial performance in relation to COVID-19 interventions. QPRs will be utilised to monitor and track implementation of COVID-19 interventions, in addition to continuous service delivery programmes. 9<br>
slide10. Background The DOD institutionalised the Result-Based Management Framework as prescribed in the Revised Framework with effect from FY2020/21 as a tool to ensure that the Department fulfils its Constitutional mandate as expressed in terms of the intended impact, outcomes and outputs. 10<br>
slide11. DOD Result-Based Model 11<br>
slide12. DOD Q1 Performance
Report<br>
slide13. Analysis of DOD Output Indicators 13 DOD Output Indicators (31) per Entity: FY2020/21 Excluding SANDF Classified Indicators<br>
slide14. Analysis of DOD Output Indicators 14 DOD Output Indicators (31) per Output: FY2020/21 (Q1)<br>
slide15. Analysis of DOD Output Indicators 15 Excluding SANDF Classified Indicators DOD Output Indicators (31) per Programme: FY2020/21 (Q1)<br>
slide16. Analysis of Def Sec Output Indicators 16 DOD Targets per Quarter: FY2020/21 (Q1)<br>
slide17. Analysis of DOD Targets per Programme 17<br>
slide18. Q1 Strategic Overview<br>
slide19. Corporate Governance and Accountability During the period under review, the Secretary for Defence provided strategic direction to the DOD through various governance activities and interventions.
These included timely decision-making on strategic and defence diplomacy matters, effective management and processing of official departmental documents, chairing of various DOD management bodies, as well as the attendance of Director-Generals’ meetings, Cabinet Lekgotlas and Government Clusters. 19<br>
slide20. Corporate Governance and Accountability The declaration of a ‘National State of Disaster’ in terms of the Disaster Management Act, 2002, required government to provide an integrated and coordinated disaster management mechanism that would focus on managing and mitigating the impact of the COVID-19 Coronavirus pandemic.
To this end, the President appointed the JCPS Cluster Co-Chairpersons to coordinate, facilitate and integrate the ‘all of government approach’ to the efforts of the key work groups that would be established to focus on COVID-19.
In addition, the President instructed that the National Joint Operational and Intelligence Structure would serve as the custodian of all reports during this crisis. 20<br>
slide21. Corporate Governance and Accountability These work groups were made up of communication experts, educators, actuaries, scientists, health specialists, engineers, disaster management centre representatives, legal advisors, the top-level leadership of the country’s intelligence, security and law-enforcement agencies as well as teams from the departments that constitute the economic and social clusters of the FOSAD.
The Secretary for Defence was responsible to Co-Chair the JCPS Cluster of Government at DG level. 21<br>
slide22. Corporate Governance and Accountability To this extend, the Secretary for Defence led and coordinated activities in the following key areas during Q1:
Establishment of COVID-19 pandemic work teams.
Provision of strategic direction and guidance to the appointed work streams.
Formulation of a Socio-Economic Recovery Plan for the country, post COVID-19 national lockdown.
Developing and consolidating a Draft Framework on the Risk Adjusted Strategy.
Ensuring the alignment of government-wide security priorities and programmes that were submitted to Cabinet. 22<br>
slide23. Corporate Human Resource Status The DOD requires an average HR strength of 77 000. In order to assure a more sustainable defence capability, an average HR strength of 75 000 will be maintained during FY2020/21, supplemented by planned Reserve Force mandays of 2 695 963.
This will result in a projected shortfall of Rb3,017 on the CoE budget for FY2020/21.
The DOD’s actual strength as at 30 June 2020 was 73 595, which was below the planned average strength of 75 227 for June 2020. 23<br>
slide24. Corporate Human Resource Status The NT letter: “Request to Increase the Compensation of Employees’ Budget Limit of the DOD by Rb2,625 in FY2019/20” dated 17 March 2020, indicated that the request from the DOD to increase the FY2019/20 CoE ceiling was not supported.
The DOD received an additional allocation via the 2020 Special Adjustment Budget of Rm763,4, in support of its COVID-19 response. This allocation is specifically and exclusively appropriated and is aligned to the expenditure in terms of allowances paid and projected payments.
It is projected that the funded HR strength will continue to decrease due to higher than anticipated attrition within the Department. 24<br>
slide25. Command of Forces MTSF 2019 – 2024 Priorities
During the quarter under review, the SANDF supported the following MTSF Priorities:
Priority 6: “Social Cohesion and Safer Communities”
(Support to the People)
Priority 7: “A Better Africa and a Better World”
(Regional Security) 25<br>
slide26. Command of Forces In terms of Support to the People, the SANDF deployed 15 sub-units to execute Op CORONA (Border Safeguarding) in Limpopo, Mpumalanga, KwaZulu-Natal, Free State, Eastern Cape, Northern Cape and North-West Provinces.
Efforts to contribute towards Op PHAKISA objectives continued through the conduct of two Op CORONA coastal patrols during Q1. 26<br>
slide27. Op CORONA Operational Successes 27<br>
slide28. Command of Forces In support to Government Departments (Op PROSPER), the SANDF operational concept for Safety and Security Support is to employ multi-rolled military capabilities on request and according to the prescripts of the Defence Act 42 of 2002. The SANDF was not requested to provide assistance during Q1.
In terms of Disaster Aid and Relief (Op CHARIOT), the SANDF was not requested to provide assistance during Q1. 28<br>
slide29. Command of Forces In terms of search and rescue (Op ARABELLA), the SANDF provided assistance in the:
The CASEVAC of a passenger who suffered a heart attack aboard the Queen Mary 2, 216nm South West of the Coast of Durban. An Oryx helicopter from 15 Squadron successfully retrieved the patient in challenging conditions and delivered him safely to hospital for urgent treatment on 02 April 2020.
On 06 May 2020, an Oryx helicopter from 15 Squadron conducted a CASEVAC 7nm offshore of Park Rynie in the KwaZulu-Natal South Coast. A sailor on board a bulk motor carrier fell ill and had to be evacuated to a hospital facility in Durban.
The SANDF supported to the national effort to mitigate the spread of COVID-19 (Op NOTLELA) from 24 March 2020 to date. 29<br>
slide30. Command of Forces In terms of Regional Security the SANDF continued to provide Force Structure Elements to the United Nations PSO in the DRC (Op MISTRAL). These included:
SANDF Specialist Contingent in Kinshasa
Force Intervention Battalion Group in Sake Base
Composite Helicopter Unit in Goma
Due to the need to harness the limited number of operationally available SA Navy platforms for deployment in Op NOTLELA, it was decided that there will be no Op COPPER long range deployment in the Mozambique Channel during Q1. 30<br>
slide31. DOD Selected
(included in the ENE) Performance Indicators<br>
slide32. Selected Performance Indicator Summary 32 The following 10 selected performance indicators are published in the 2020 Estimates of National Expenditure for Vote 23.<br>
slide33. Selected Performance Indicator Summary 33<br>
slide34. DOD Number of Hours Flown per Year 34<br>
slide35. DOD Number of Hours at Sea per Year 35<br>
slide36. Q1 Performance Status<br>
slide37. Q1 Performance against DOD Outputs 37<br>
slide38. Q1 Performance Status on Targets per Quarter 38 38<br>
slide39. Q1 Financial Performance Information<br>
slide40. Summary of State of Expenditure: 30 June 2020 40 40 DOD Planned Expenditure: 21.6%<br>
slide41. Summary of State of Expenditure: 30 June 2020 41 41<br>
slide42. Comments on of State of Expenditure per
Programme: 30 June 2020 42 Contributing factors to negative or positive balances of more than 8% of actual drawings per Programme are as follows:
Air Defence. Under expenditure of R185.681 million was mainly due to:
COVID-19. The closure of local and international businesses following the collective global responses to contain the spread of the COVID-19 virus had a negative impact on the ability of the South African Air Force to financially perform as planned.
Defence Industry Performance. The closure of Denel largely due to persistent, but necessary, lockdown regulations had negatively impacted on deliverables directly related to planned cash flow.
Prolonged Procurement Processes. Prolonged procurement processes regarding the upkeep of aircraft systems had an effect on cash flow performance during the first quarter. The SAAFs cash flow performance will improve as the financial year progress.<br>
slide43. Comments on of State of Expenditure per
Programme: 30 June 2020 43 Contributing factors to negative or positive balances of more than 8% of actual drawings per Programme are as follows:
Maritime Defence. Under expenditure of R108.678 million was mainly due to the unprecedented COVID-19 lockdown and procurement challenges experienced as follows :
Human Resources and Training. The restrictions posed on travelling impacted on the movement of personnel i.e. courses, training, staff visits and meetings. This mainly affected subsistence and travelling expenditure.
Maintenance and Repair of Ships.
The lockdown and procurement challenges had an impact on the process of placing System Support and technical upkeep contracts. ARMSCOR and DOD procurement experienced no bids or bidders not meeting the required criteria.
Available contractors shifted the delivery target to the right, negatively affected spares availability, required for the M&R of Ships. The latter had an direct impact on the availability and readiness of Navy Platforms.<br>
slide44. Comments on of State of Expenditure per
Programme: 30 June 2020 44 Contributing factors to negative or positive balances of more than 8% of actual drawings per Programme are as follows:
General Support. Over expenditure of R350.786 million was mainly due to the centralised procurement of all PPEs, equipment and the establishment of quarantine / isolation facilities etc. required by the DOD to support efforts to contain the COVID-19 virus. RM344,007 was paid in this regard at the end of Q1.<br>
slide45. Summary of State of Expenditure per
Economic Classification: 30 June 2020 45<br>
slide46. Comments on of State of Expenditure per
Economic Classification: 30 June 2020 46 Contributing factors to negative or positive balances of more than 8% of actual drawings per economic classification are as follows:
Payments for Capital Assets. The over expenditure of R153.226 million was as a result of payment of invoices received from the National Department of Public Works and Infrastructure for work completed on immovable properties in accordance with the User Asset Management Plan as well as the payment of Microsoft Software Licenses.
Payments for Financial Assets. The over expenditure of R0.030 million was mainly due to the write-off transactions for thefts and other losses. It should be noted that the Department does not make provision during the budget allocation for unforeseen expenditure such as foreign exchange losses, thefts and other losses, etc. Funds are reserved to clear these transactions at financial year-end.<br>
slide47. DOD COVID-19 Response Expenditure per Programme: 30 June 2020 47<br>
slide48. DOD COVID-19 Response Expenditure per Economic Classification: 30 June 2020 48<br>
slide49. Irregular Expenditure (IE) 49 IE for Q1 as at 30 June 2020 amounted to Rm51,2; comprising of the following categories:<br>
slide50. BRRR Feedback<br>
slide51. BRRR Status 51<br>
slide52. BRRR Status 52<br>
slide53. Thank you…<br>