
Quality Assurance and Performance Management
Description: Quality Assurance and Performance Management Administration (QAPMA) December 13, 2024 Anjela Turner, Project Manager National Core Indicators (NCI-IDD) National program launched in 1997 to give states direct feedback from people receiving
Related Topics
Download Presentation
"Quality Assurance and Performance Management" is the property of its rightful owner. Permission is granted to download and print the materials on this website for personal, non-commercial use only, and to display it on your personal computer provided you do not modify the materials and that you retain all copyright notices contained in the materials. By downloading content from our website, you accept the terms of this agreement.
Presentation Transcript
slide1. Quality Assurance and Performance Management Administration (QAPMA)
December 13, 2024
Anjela Turner, Project Manager<br>
slide2. National Core Indicators (NCI-IDD) National program launched in 1997 to give states direct feedback from people receiving long term support services.
Tracks quality measures and outcomes of developmental disability (DD) services for people with IDD and their families over time.
Monitors the stability and quality of the direct support professional workforce.<br>
slide3. National Core Indicators (NCI-IDD) 48 states, along with the District of Columbia and 21 regional developmental disabilities centers in California.
States can use the data to track changes in performance, compare outcomes across states, and monitor national trends.
Agency managers can use the reports to develop initiatives, set policies, establish benchmarks, and track progress toward quality improvement goals.<br>
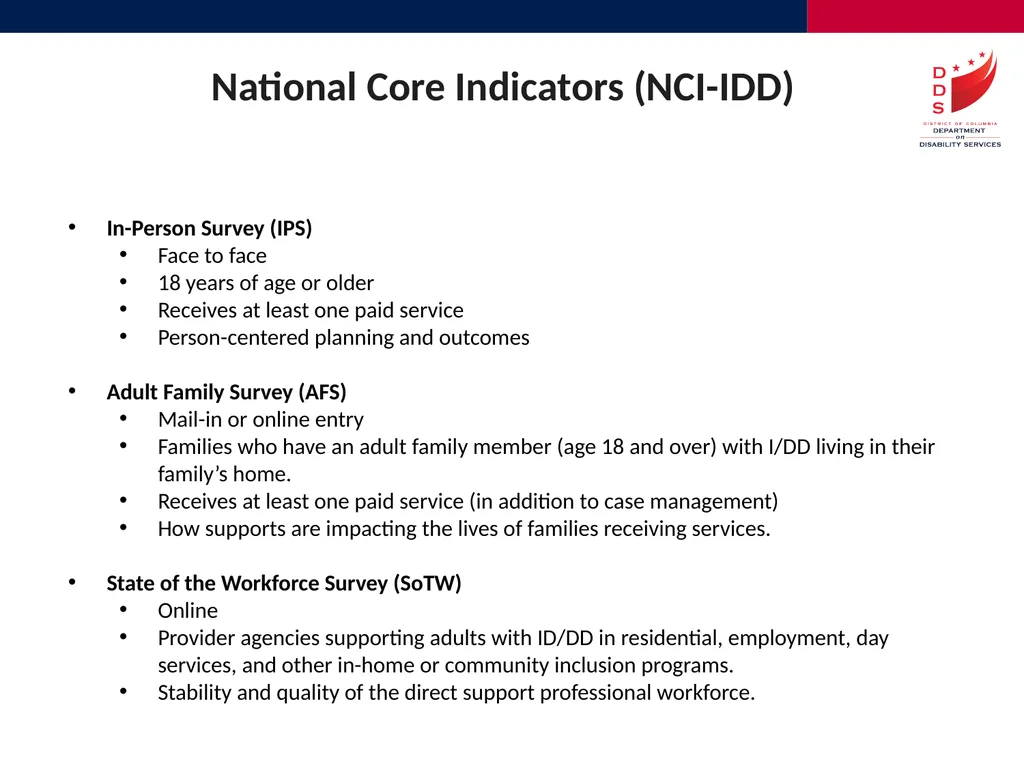
slide4. National Core Indicators (NCI-IDD) In-Person Survey (IPS)
Face to face
18 years of age or older
Receives at least one paid service
Person-centered planning and outcomes
Adult Family Survey (AFS)
Mail-in or online entry
Families who have an adult family member (age 18 and over) with I/DD living in their family’s home.
Receives at least one paid service (in addition to case management)
How supports are impacting the lives of families receiving services.
State of the Workforce Survey (SoTW)
Online
Provider agencies supporting adults with ID/DD in residential, employment, day services, and other in-home or community inclusion programs.
Stability and quality of the direct support professional workforce.<br>
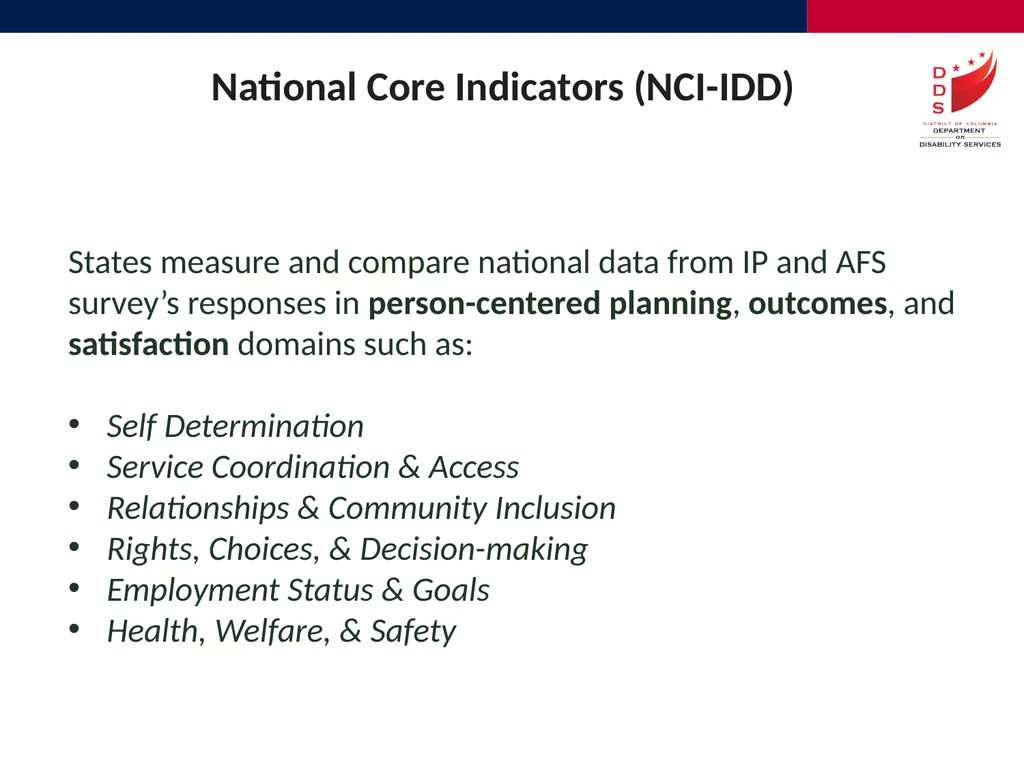
slide5. National Core Indicators (NCI-IDD) States measure and compare national data from IP and AFS survey’s responses in person-centered planning, outcomes, and satisfaction domains such as:
Self Determination
Service Coordination & Access
Relationships & Community Inclusion
Rights, Choices, & Decision-making
Employment Status & Goals
Health, Welfare, & Safety<br>
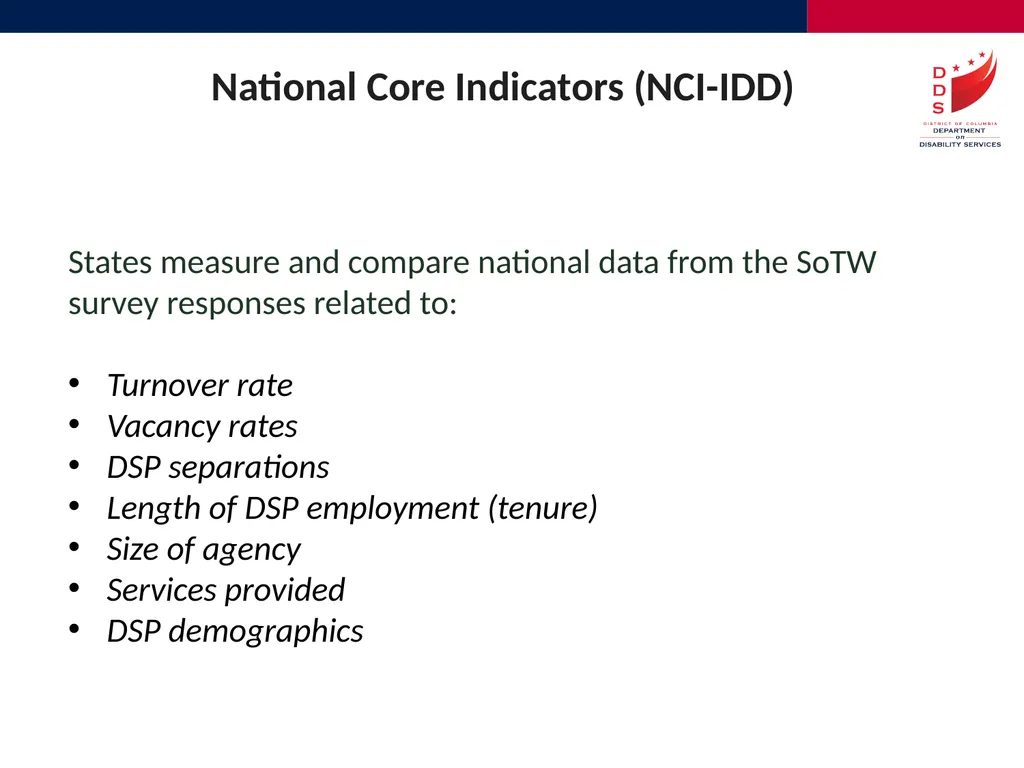
slide6. National Core Indicators (NCI-IDD) States measure and compare national data from the SoTW survey responses related to:
Turnover rate
Vacancy rates
DSP separations
Length of DSP employment (tenure)
Size of agency
Services provided
DSP demographics<br>
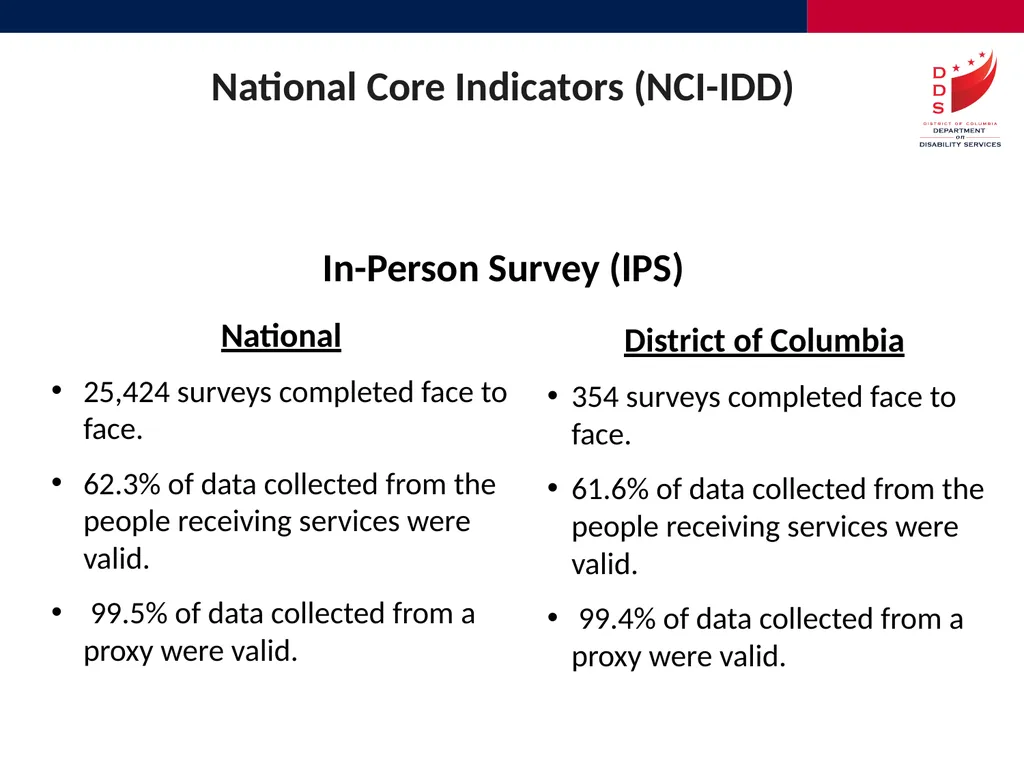
slide7. National Core Indicators (NCI-IDD) National
25,424 surveys completed face to face.
62.3% of data collected from the people receiving services were valid.
99.5% of data collected from a proxy were valid. In-Person Survey (IPS) District of Columbia
354 surveys completed face to face.
61.6% of data collected from the people receiving services were valid.
99.4% of data collected from a proxy were valid.<br>
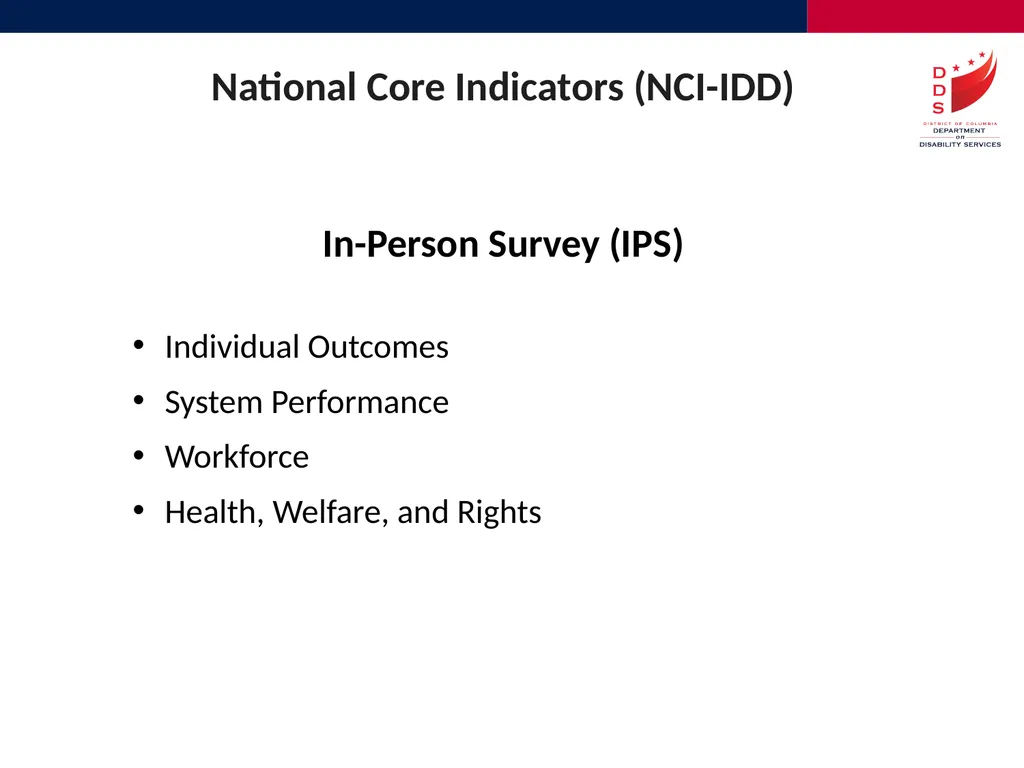
slide8. National Core Indicators (NCI-IDD) Individual Outcomes
System Performance
Workforce
Health, Welfare, and Rights In-Person Survey (IPS)<br>
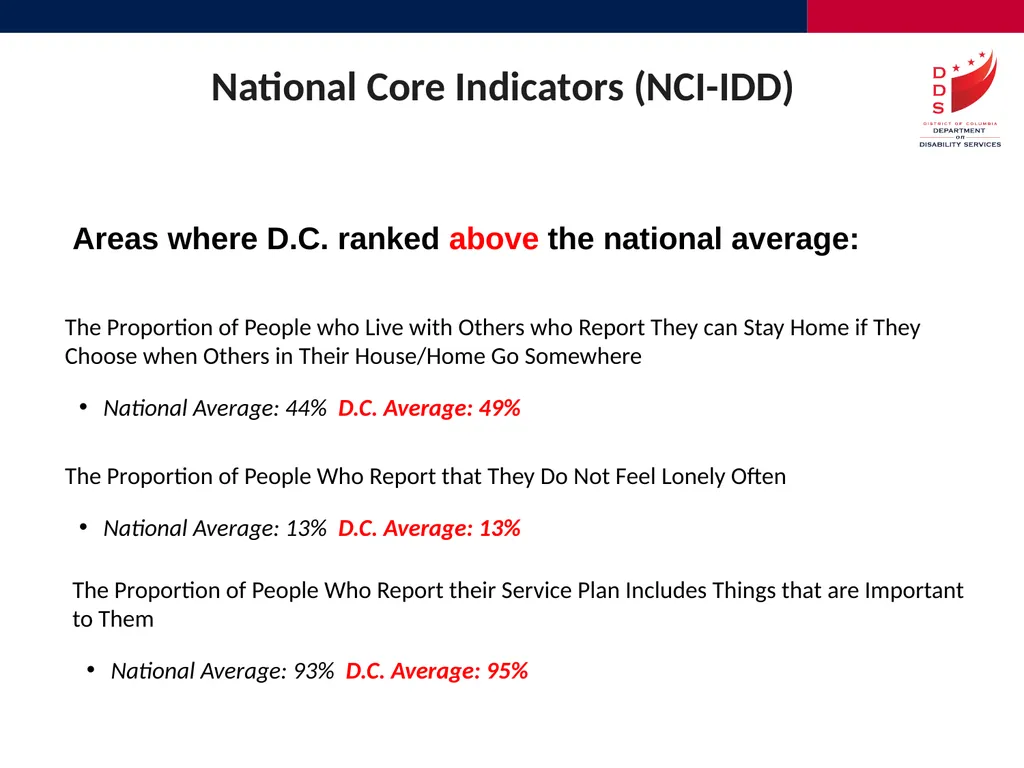
slide9. Areas where D.C. ranked above the national average: The Proportion of People who Live with Others who Report They can Stay Home if They Choose when Others in Their House/Home Go Somewhere
National Average: 44% D.C. Average: 49% National Core Indicators (NCI-IDD) The Proportion of People Who Report that They Do Not Feel Lonely Often
National Average: 13% D.C. Average: 13% The Proportion of People Who Report their Service Plan Includes Things that are Important to Them
National Average: 93% D.C. Average: 95%<br>
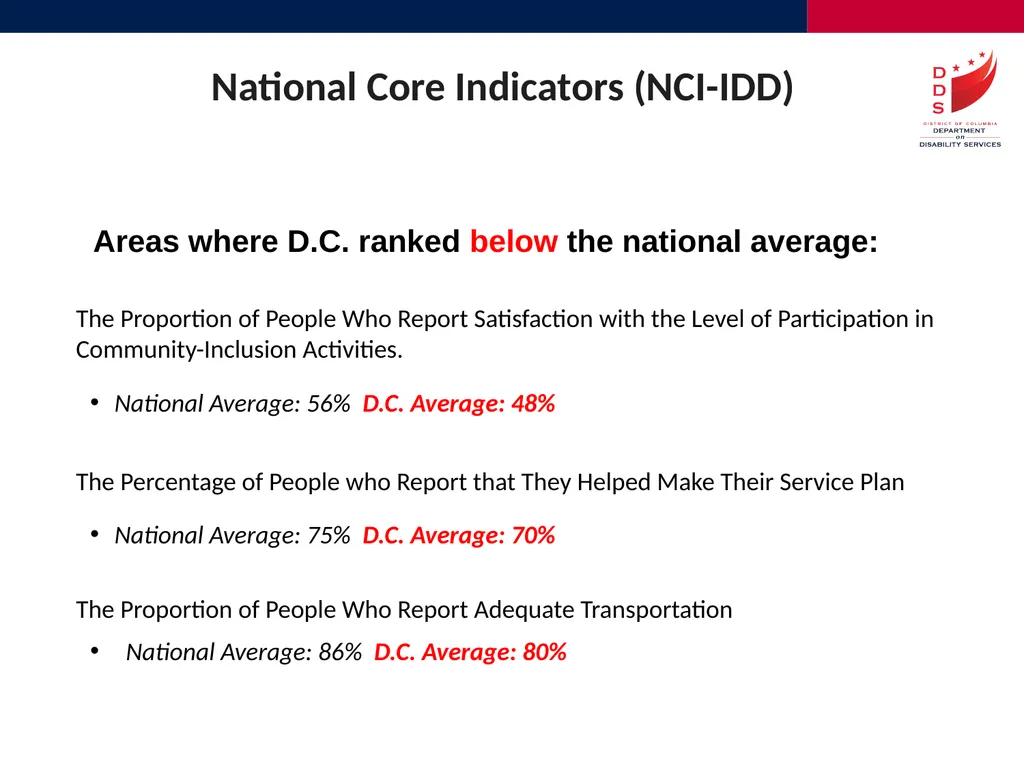
slide10. Areas where D.C. ranked below the national average: The Proportion of People Who Report Satisfaction with the Level of Participation in Community-Inclusion Activities.
National Average: 56% D.C. Average: 48% The Percentage of People who Report that They Helped Make Their Service Plan
National Average: 75% D.C. Average: 70% National Core Indicators (NCI-IDD) The Proportion of People Who Report Adequate Transportation
National Average: 86% D.C. Average: 80%<br>
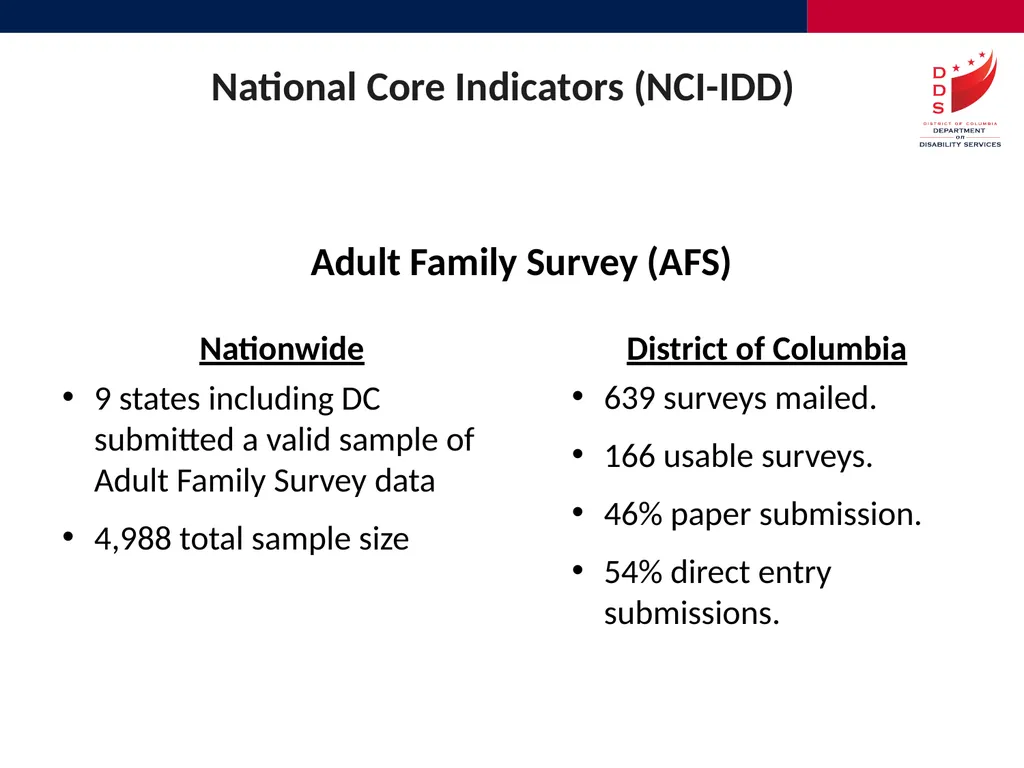
slide11. National Core Indicators (NCI-IDD) District of Columbia
639 surveys mailed.
166 usable surveys.
46% paper submission.
54% direct entry submissions. Nationwide
9 states including DC submitted a valid sample of Adult Family Survey data
4,988 total sample size Adult Family Survey (AFS)<br>
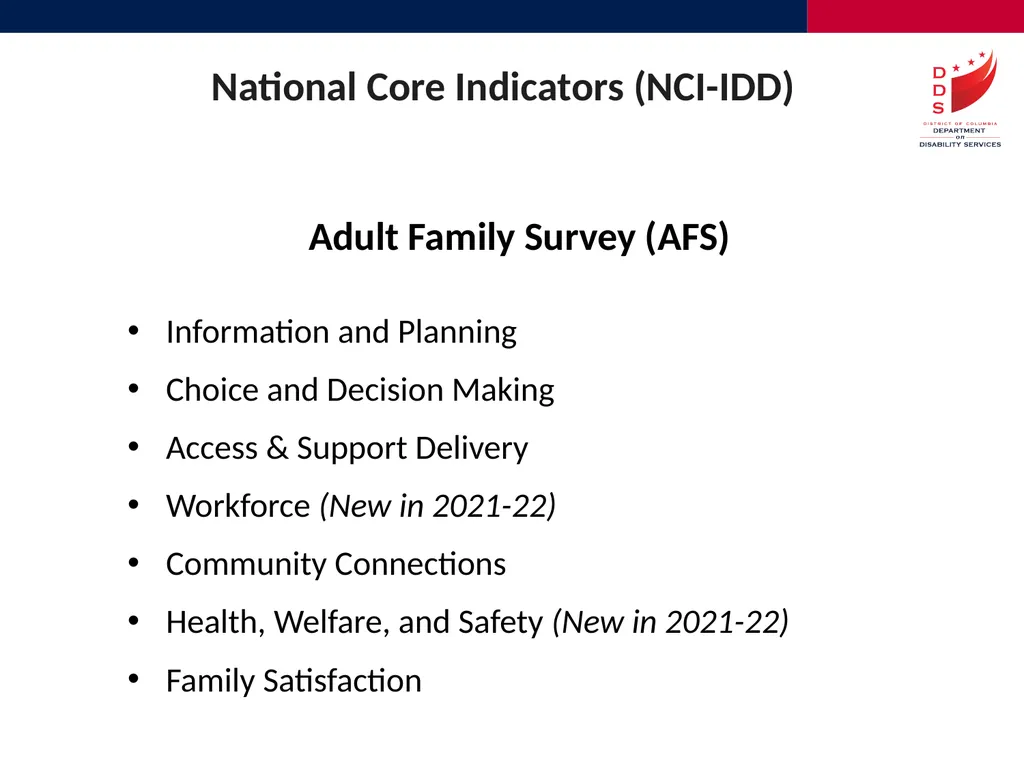
slide12. National Core Indicators (NCI-IDD) Adult Family Survey (AFS) Information and Planning
Choice and Decision Making
Access & Support Delivery
Workforce (New in 2021-22)
Community Connections
Health, Welfare, and Safety (New in 2021-22)
Family Satisfaction<br>
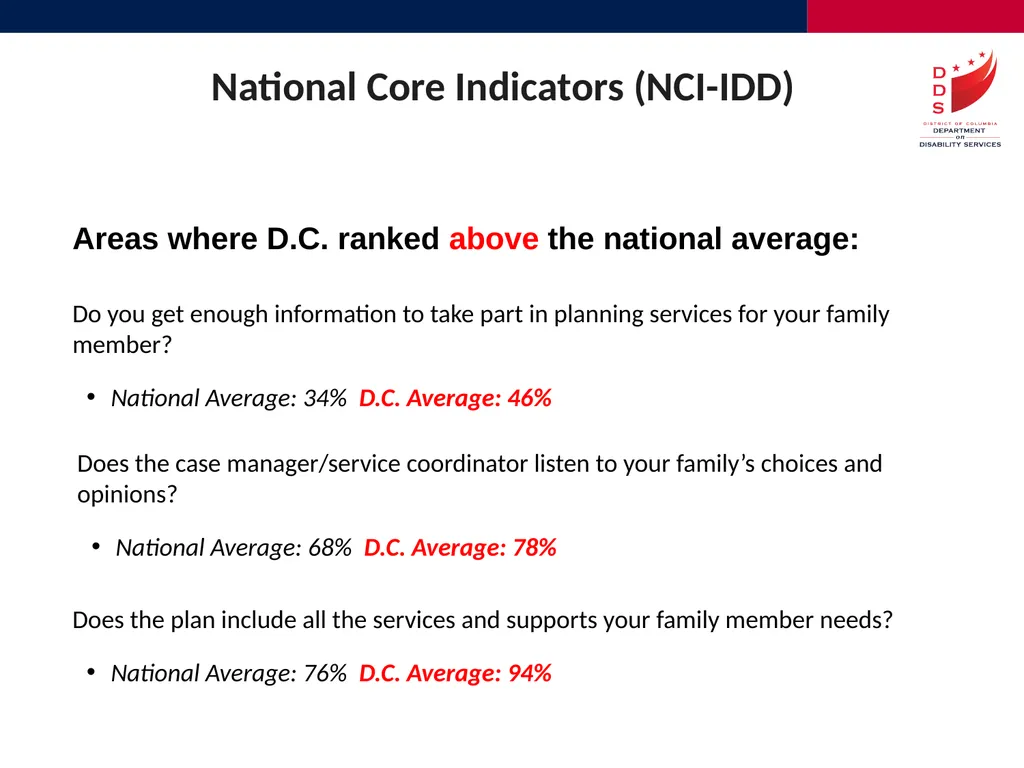
slide13. Areas where D.C. ranked above the national average: Do you get enough information to take part in planning services for your family member?
National Average: 34% D.C. Average: 46% National Core Indicators (NCI-IDD) Does the case manager/service coordinator listen to your family’s choices and opinions?
National Average: 68% D.C. Average: 78% Does the plan include all the services and supports your family member needs?
National Average: 76% D.C. Average: 94%<br>
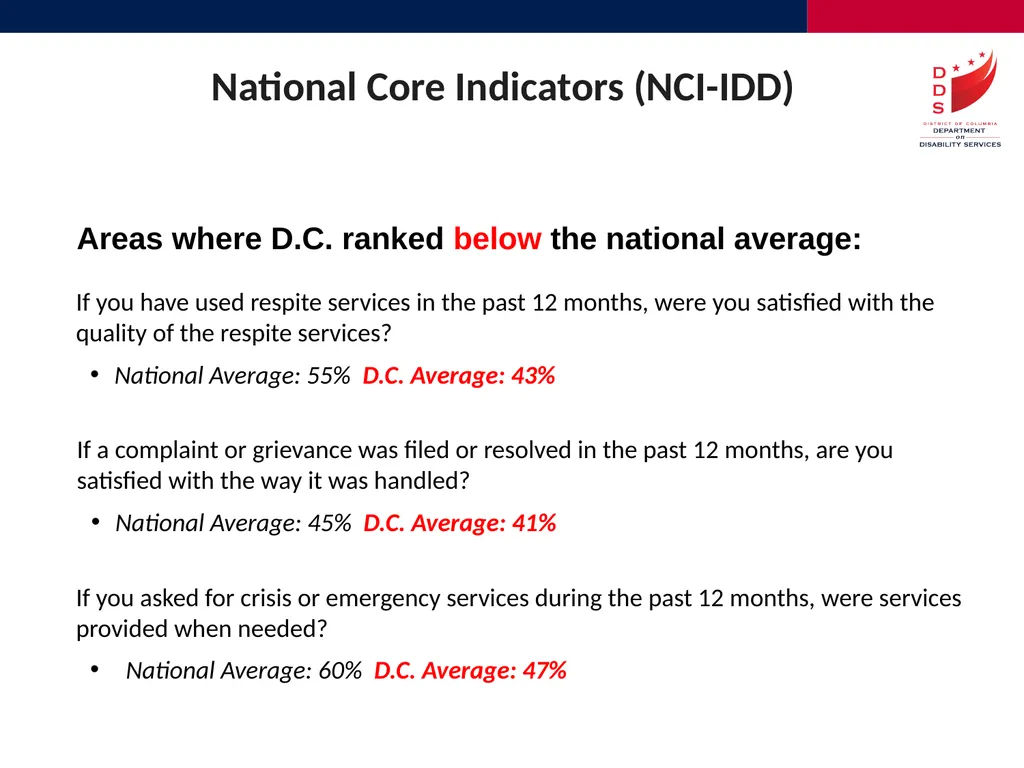
slide14. Areas where D.C. ranked below the national average: If you have used respite services in the past 12 months, were you satisfied with the
quality of the respite services?
National Average: 55% D.C. Average: 43% If a complaint or grievance was filed or resolved in the past 12 months, are you satisfied with the way it was handled?
National Average: 45% D.C. Average: 41% National Core Indicators (NCI-IDD) If you asked for crisis or emergency services during the past 12 months, were services provided when needed?
National Average: 60% D.C. Average: 47%<br>
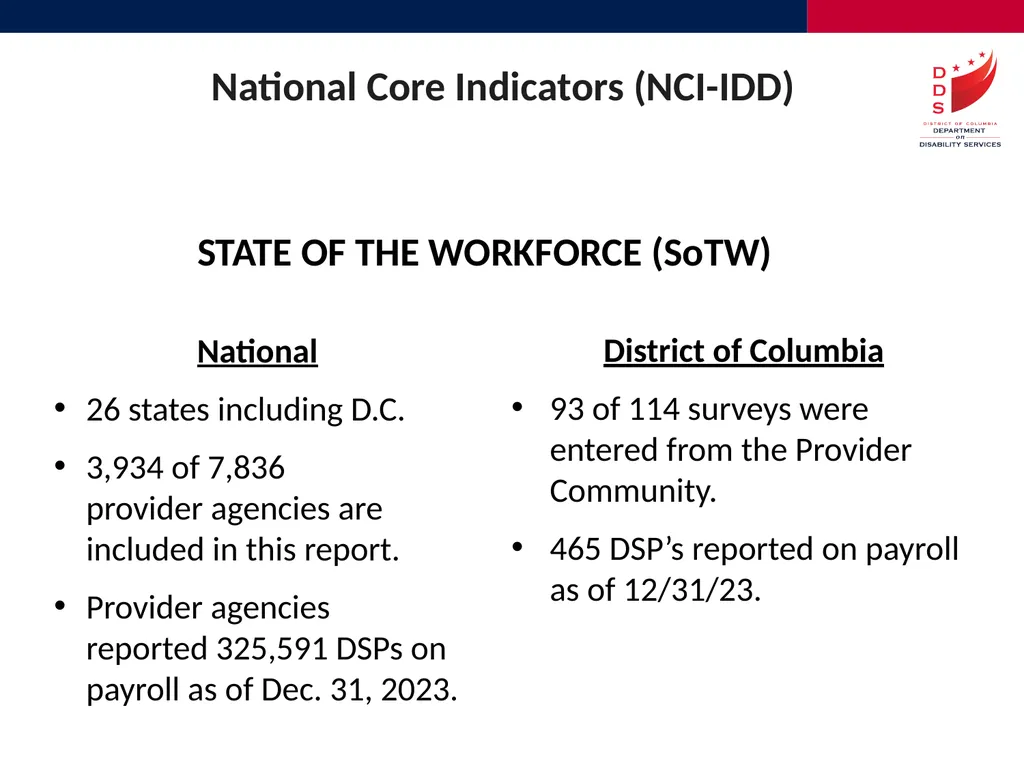
slide15. National Core Indicators (NCI-IDD) District of Columbia
93 of 114 surveys were entered from the Provider Community.
465 DSP’s reported on payroll as of 12/31/23. National
26 states including D.C.
3,934 of 7,836 provider agencies are included in this report.
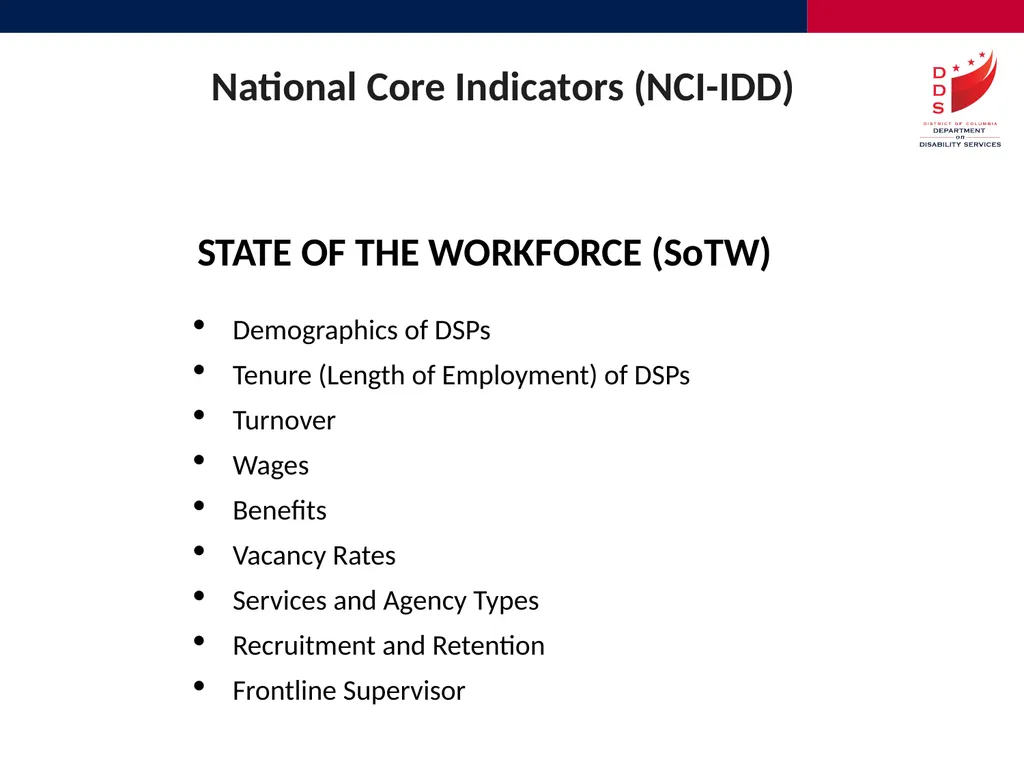
Provider agencies reported 325,591 DSPs on payroll as of Dec. 31, 2023. STATE OF THE WORKFORCE (SoTW)<br>
slide16. National Core Indicators (NCI-IDD) Demographics of DSPs
Tenure (Length of Employment) of DSPs
Turnover
Wages
Benefits
Vacancy Rates
Services and Agency Types
Recruitment and Retention
Frontline Supervisor STATE OF THE WORKFORCE (SoTW)<br>
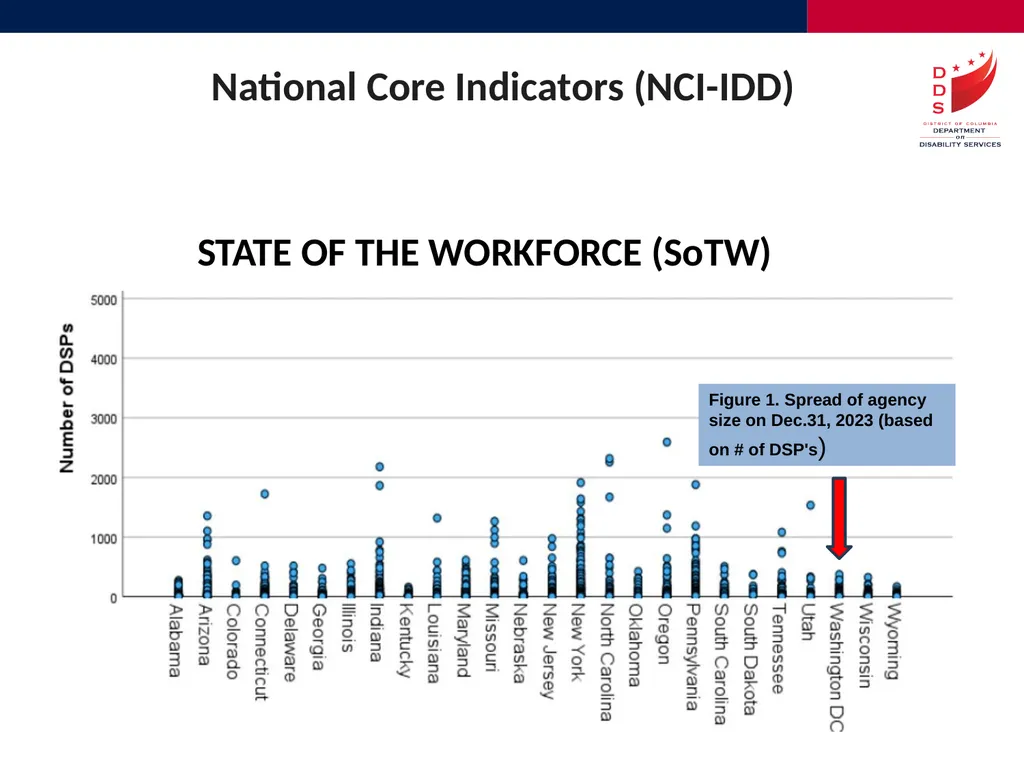
slide17. National Core Indicators (NCI-IDD) STATE OF THE WORKFORCE (SoTW) Figure 1. Spread of agency size on Dec.31, 2023 (based on # of DSP's)<br>
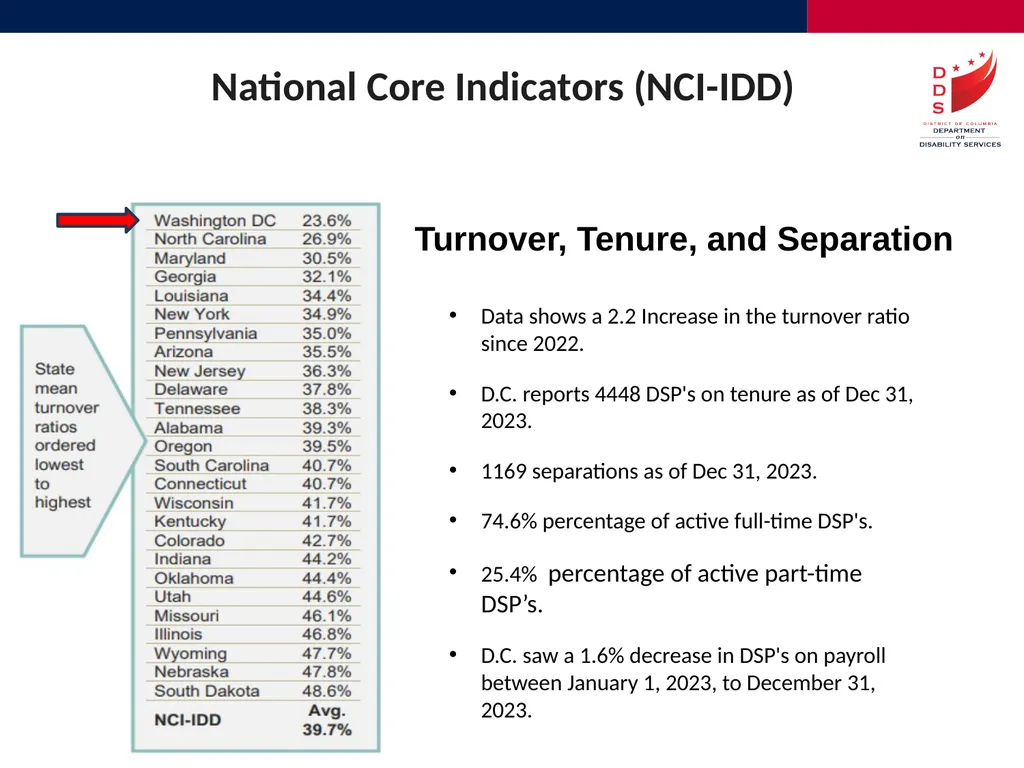
slide18. National Core Indicators (NCI-IDD) Data shows a 2.2 Increase in the turnover ratio since 2022.
D.C. reports 4448 DSP's on tenure as of Dec 31, 2023.
1169 separations as of Dec 31, 2023.
74.6% percentage of active full-time DSP's.
25.4% percentage of active part-time DSP’s.
D.C. saw a 1.6% decrease in DSP's on payroll between January 1, 2023, to December 31, 2023. Turnover, Tenure, and Separation<br>
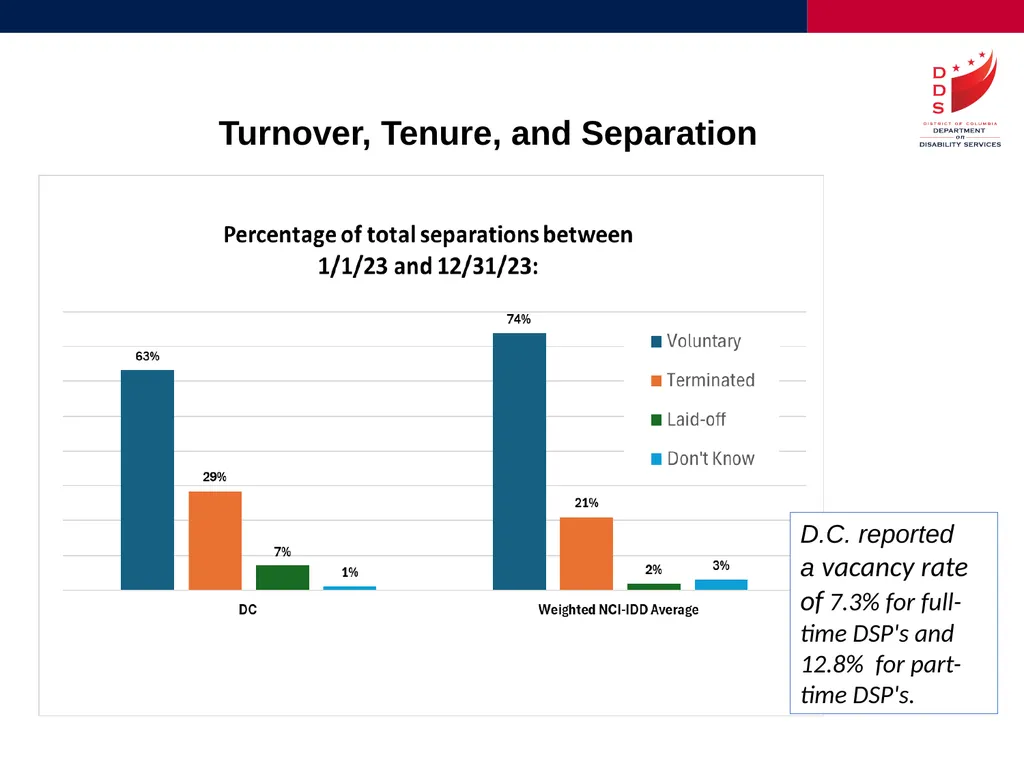
slide19. D.C. reported a vacancy rate of 7.3% for full-time DSP's and 12.8% for part-time DSP's. Turnover, Tenure, and Separation<br>
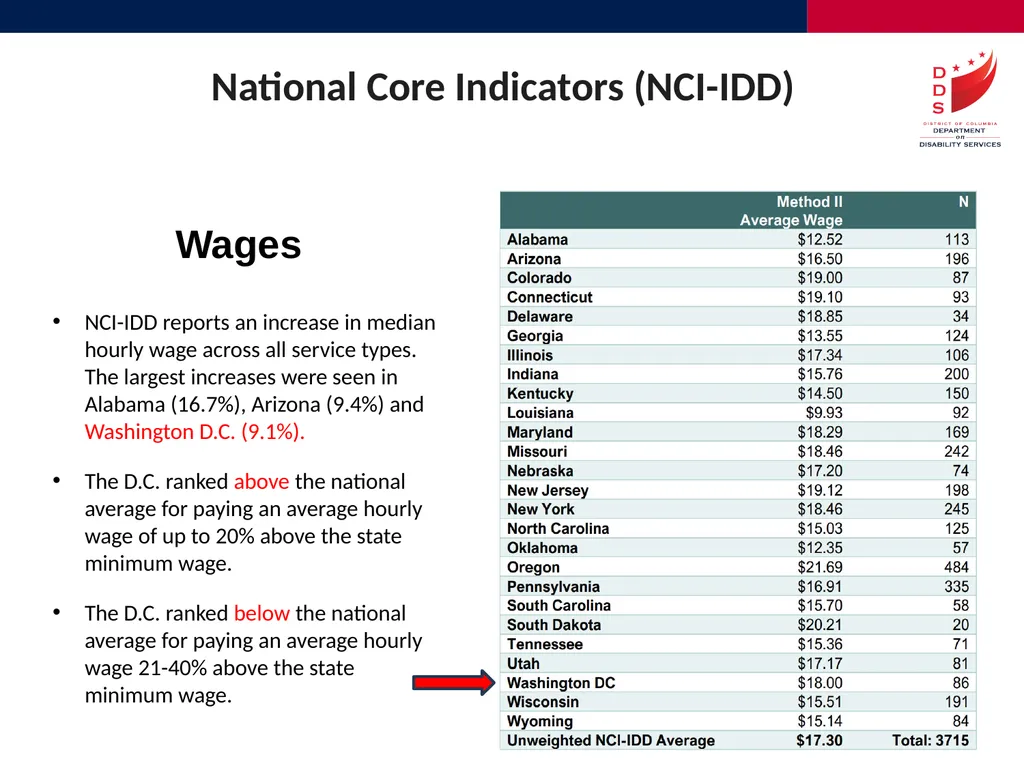
slide20. National Core Indicators (NCI-IDD) NCI-IDD reports an increase in median hourly wage across all service types. The largest increases were seen in Alabama (16.7%), Arizona (9.4%) and Washington D.C. (9.1%).
The D.C. ranked above the national average for paying an average hourly wage of up to 20% above the state minimum wage.
The D.C. ranked below the national average for paying an average hourly wage 21-40% above the state minimum wage. Wages<br>
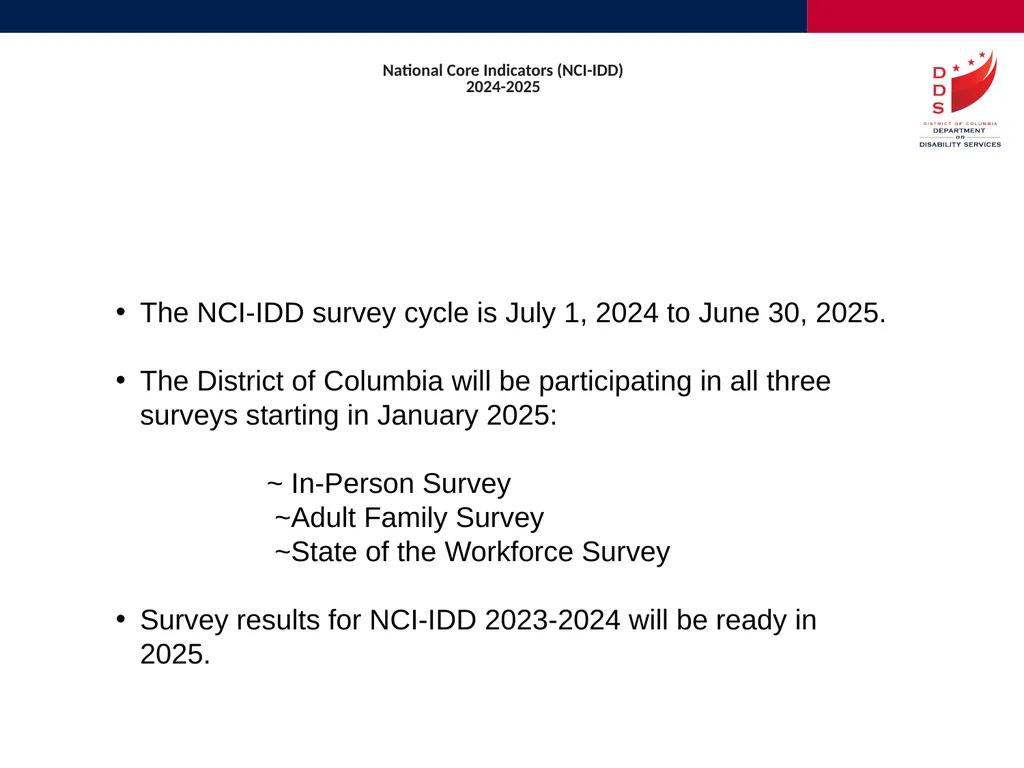
slide21. National Core Indicators (NCI-IDD) 2024-2025 The NCI-IDD survey cycle is July 1, 2024 to June 30, 2025.
The District of Columbia will be participating in all three surveys starting in January 2025:
~ In-Person Survey
~Adult Family Survey
~State of the Workforce Survey
Survey results for NCI-IDD 2023-2024 will be ready in 2025.<br>
slide22. National Core Indicators (NCI-IDD) 2024-2025 Resources:
NCI-IDD Main page
https://idd.nationalcoreindicators.org/
Survey Reports and Insights
https://idd.nationalcoreindicators.org/survey-reports-insights/
Frequently asked questions
https://www.nationalcoreindicators.org/frequently-asked-questions
DDS NCI-IDD Contact
Anjela.turner@dc.gov 202-870-8138<br>
slide23. Question This Photo by Unknown Author is licensed under CC BY-SA<br>
December 13, 2024
Anjela Turner, Project Manager<br>
slide2. National Core Indicators (NCI-IDD) National program launched in 1997 to give states direct feedback from people receiving long term support services.
Tracks quality measures and outcomes of developmental disability (DD) services for people with IDD and their families over time.
Monitors the stability and quality of the direct support professional workforce.<br>
slide3. National Core Indicators (NCI-IDD) 48 states, along with the District of Columbia and 21 regional developmental disabilities centers in California.
States can use the data to track changes in performance, compare outcomes across states, and monitor national trends.
Agency managers can use the reports to develop initiatives, set policies, establish benchmarks, and track progress toward quality improvement goals.<br>
slide4. National Core Indicators (NCI-IDD) In-Person Survey (IPS)
Face to face
18 years of age or older
Receives at least one paid service
Person-centered planning and outcomes
Adult Family Survey (AFS)
Mail-in or online entry
Families who have an adult family member (age 18 and over) with I/DD living in their family’s home.
Receives at least one paid service (in addition to case management)
How supports are impacting the lives of families receiving services.
State of the Workforce Survey (SoTW)
Online
Provider agencies supporting adults with ID/DD in residential, employment, day services, and other in-home or community inclusion programs.
Stability and quality of the direct support professional workforce.<br>
slide5. National Core Indicators (NCI-IDD) States measure and compare national data from IP and AFS survey’s responses in person-centered planning, outcomes, and satisfaction domains such as:
Self Determination
Service Coordination & Access
Relationships & Community Inclusion
Rights, Choices, & Decision-making
Employment Status & Goals
Health, Welfare, & Safety<br>
slide6. National Core Indicators (NCI-IDD) States measure and compare national data from the SoTW survey responses related to:
Turnover rate
Vacancy rates
DSP separations
Length of DSP employment (tenure)
Size of agency
Services provided
DSP demographics<br>
slide7. National Core Indicators (NCI-IDD) National
25,424 surveys completed face to face.
62.3% of data collected from the people receiving services were valid.
99.5% of data collected from a proxy were valid. In-Person Survey (IPS) District of Columbia
354 surveys completed face to face.
61.6% of data collected from the people receiving services were valid.
99.4% of data collected from a proxy were valid.<br>
slide8. National Core Indicators (NCI-IDD) Individual Outcomes
System Performance
Workforce
Health, Welfare, and Rights In-Person Survey (IPS)<br>
slide9. Areas where D.C. ranked above the national average: The Proportion of People who Live with Others who Report They can Stay Home if They Choose when Others in Their House/Home Go Somewhere
National Average: 44% D.C. Average: 49% National Core Indicators (NCI-IDD) The Proportion of People Who Report that They Do Not Feel Lonely Often
National Average: 13% D.C. Average: 13% The Proportion of People Who Report their Service Plan Includes Things that are Important to Them
National Average: 93% D.C. Average: 95%<br>
slide10. Areas where D.C. ranked below the national average: The Proportion of People Who Report Satisfaction with the Level of Participation in Community-Inclusion Activities.
National Average: 56% D.C. Average: 48% The Percentage of People who Report that They Helped Make Their Service Plan
National Average: 75% D.C. Average: 70% National Core Indicators (NCI-IDD) The Proportion of People Who Report Adequate Transportation
National Average: 86% D.C. Average: 80%<br>
slide11. National Core Indicators (NCI-IDD) District of Columbia
639 surveys mailed.
166 usable surveys.
46% paper submission.
54% direct entry submissions. Nationwide
9 states including DC submitted a valid sample of Adult Family Survey data
4,988 total sample size Adult Family Survey (AFS)<br>
slide12. National Core Indicators (NCI-IDD) Adult Family Survey (AFS) Information and Planning
Choice and Decision Making
Access & Support Delivery
Workforce (New in 2021-22)
Community Connections
Health, Welfare, and Safety (New in 2021-22)
Family Satisfaction<br>
slide13. Areas where D.C. ranked above the national average: Do you get enough information to take part in planning services for your family member?
National Average: 34% D.C. Average: 46% National Core Indicators (NCI-IDD) Does the case manager/service coordinator listen to your family’s choices and opinions?
National Average: 68% D.C. Average: 78% Does the plan include all the services and supports your family member needs?
National Average: 76% D.C. Average: 94%<br>
slide14. Areas where D.C. ranked below the national average: If you have used respite services in the past 12 months, were you satisfied with the
quality of the respite services?
National Average: 55% D.C. Average: 43% If a complaint or grievance was filed or resolved in the past 12 months, are you satisfied with the way it was handled?
National Average: 45% D.C. Average: 41% National Core Indicators (NCI-IDD) If you asked for crisis or emergency services during the past 12 months, were services provided when needed?
National Average: 60% D.C. Average: 47%<br>
slide15. National Core Indicators (NCI-IDD) District of Columbia
93 of 114 surveys were entered from the Provider Community.
465 DSP’s reported on payroll as of 12/31/23. National
26 states including D.C.
3,934 of 7,836 provider agencies are included in this report.
Provider agencies reported 325,591 DSPs on payroll as of Dec. 31, 2023. STATE OF THE WORKFORCE (SoTW)<br>
slide16. National Core Indicators (NCI-IDD) Demographics of DSPs
Tenure (Length of Employment) of DSPs
Turnover
Wages
Benefits
Vacancy Rates
Services and Agency Types
Recruitment and Retention
Frontline Supervisor STATE OF THE WORKFORCE (SoTW)<br>
slide17. National Core Indicators (NCI-IDD) STATE OF THE WORKFORCE (SoTW) Figure 1. Spread of agency size on Dec.31, 2023 (based on # of DSP's)<br>
slide18. National Core Indicators (NCI-IDD) Data shows a 2.2 Increase in the turnover ratio since 2022.
D.C. reports 4448 DSP's on tenure as of Dec 31, 2023.
1169 separations as of Dec 31, 2023.
74.6% percentage of active full-time DSP's.
25.4% percentage of active part-time DSP’s.
D.C. saw a 1.6% decrease in DSP's on payroll between January 1, 2023, to December 31, 2023. Turnover, Tenure, and Separation<br>
slide19. D.C. reported a vacancy rate of 7.3% for full-time DSP's and 12.8% for part-time DSP's. Turnover, Tenure, and Separation<br>
slide20. National Core Indicators (NCI-IDD) NCI-IDD reports an increase in median hourly wage across all service types. The largest increases were seen in Alabama (16.7%), Arizona (9.4%) and Washington D.C. (9.1%).
The D.C. ranked above the national average for paying an average hourly wage of up to 20% above the state minimum wage.
The D.C. ranked below the national average for paying an average hourly wage 21-40% above the state minimum wage. Wages<br>
slide21. National Core Indicators (NCI-IDD) 2024-2025 The NCI-IDD survey cycle is July 1, 2024 to June 30, 2025.
The District of Columbia will be participating in all three surveys starting in January 2025:
~ In-Person Survey
~Adult Family Survey
~State of the Workforce Survey
Survey results for NCI-IDD 2023-2024 will be ready in 2025.<br>
slide22. National Core Indicators (NCI-IDD) 2024-2025 Resources:
NCI-IDD Main page
https://idd.nationalcoreindicators.org/
Survey Reports and Insights
https://idd.nationalcoreindicators.org/survey-reports-insights/
Frequently asked questions
https://www.nationalcoreindicators.org/frequently-asked-questions
DDS NCI-IDD Contact
Anjela.turner@dc.gov 202-870-8138<br>
slide23. Question This Photo by Unknown Author is licensed under CC BY-SA<br>