REACH Improvement Science Toolkit DESIGN pathway to ensure that there are connections between adult ed, noncredit, credit, and industry credentials and focus student population(s) are equitably served. REACH Improvement Science Toolkit Your
"REACH Improvement Science Toolkit DESIGN pathway" is the property of its rightful owner. Permission is granted to
download and print the materials on this website for personal, non-commercial use only, and to display it
on your personal computer provided you do not modify the materials and that you retain all copyright
notices contained in the materials. By downloading content from our website, you accept the terms of this
agreement.
Presentation Transcript
01
REACH Improvement Science Toolkit DESIGN pathway to ensure that there are connections between adult ed, noncredit, credit, and industry credentials and focus student population(s) are equitably served.<br>
02
REACH Improvement Science Toolkit Your college can use this document to try out specific tools that can help refine the strategies you will use to build your REACH pathways.
It also includes templates that you can use to teach your colleagues about these tools and further explore design factors.
Your Guided Pathways Regional Coordinator is available to help you apply these tools to your work.<br>
03
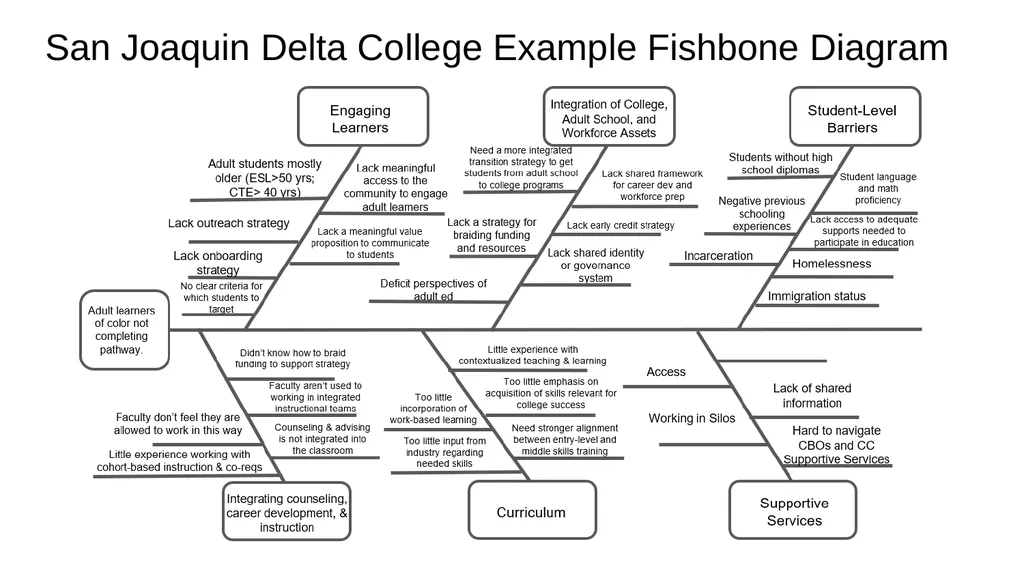
Fishbone Diagram Instructions Focus on one academic pathway you’ve prioritized for REACH within this discipline, or if you have not yet selected your pathways, pick a program within this discipline as a way to learn about this tool.
Identify the major categories of issues that contribute to adult students of color not completing that pathway. Click on the boxes with the word “Category” to edit the labels. You may have fewer than six categories.
Identify the major causes of challenges in each category. Click the word “Cause” above each line to edit. If you need to list more causes, you can copy lines and text boxes and fit them in as needed. You may not have as many causes as there are prompts.<br>
04
San Joaquin Delta College Example Fishbone Diagram<br>
05
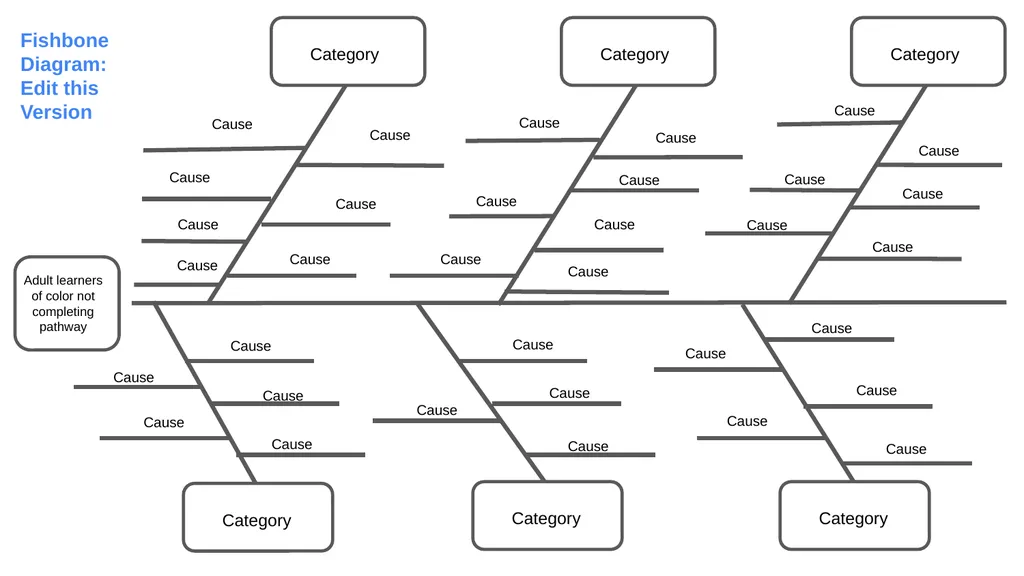
Cause Cause Cause Cause Cause Cause Category Category Cause Cause Cause Cause Cause Cause Category Category Category Cause Category Cause Cause Cause Cause Cause Cause Cause Cause Cause Cause Cause Cause Cause Cause Cause Cause Cause Cause Cause Cause Cause Fishbone Diagram:
Edit this Version<br>
06
Cause Cause Cause Cause Cause Cause Category Category Cause Cause Cause Cause Cause Cause Category Category Category Cause Category Cause Cause Cause Cause Cause Cause Cause Cause Cause Cause Cause Cause Cause Cause Cause Cause Cause Cause Cause Cause Cause Fishbone Diagram:
Blank Template For Later<br>
07
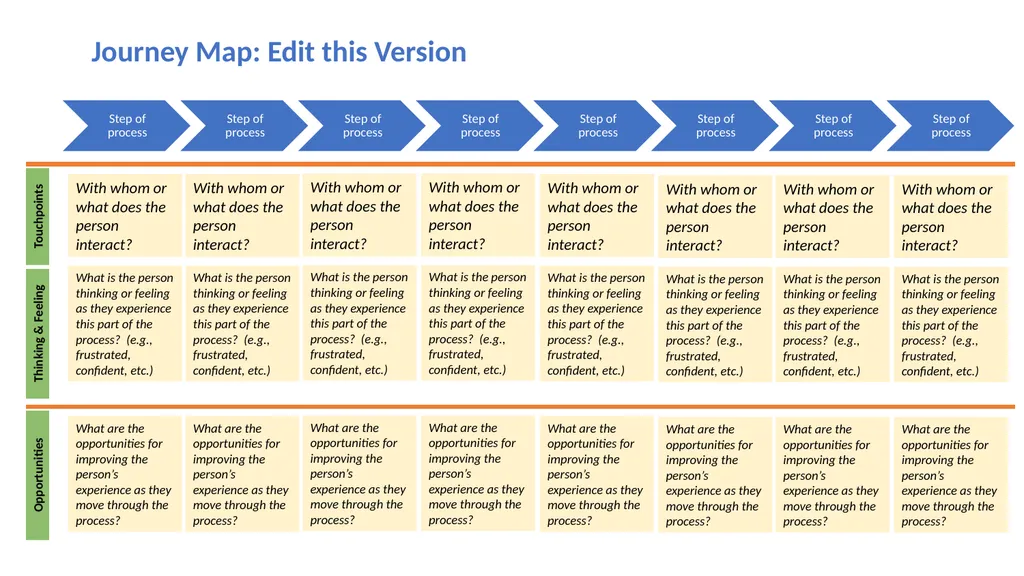
Journey Map Instructions Go back to the Fishbone Diagram and identify one cause that you plan to take action on.
Identify one type of person that you would like to benefit from this action. Click on the words Journey Map and enter the type of person there (for example, to read: Latinx Student Journey Map or Health Employer Journey Map)
Click on the blue arrows and replace “Step of process” with a word that succinctly describes what the person does at each stage of interacting with your area of focus.
Working one column at a time, click on the boxes to answer the questions in just the Touchpoints and Thinking & Feeling rows first. You can erase the question prompt to make room for your answer. If you don’t know what the person’s experience is like, you can conduct interviews with members of this community to better understand their experience.
Once you can see the full arc of the person’s experience, then click on the Opportunities boxes. Erase the question prompt and type in potential actions.<br>
08
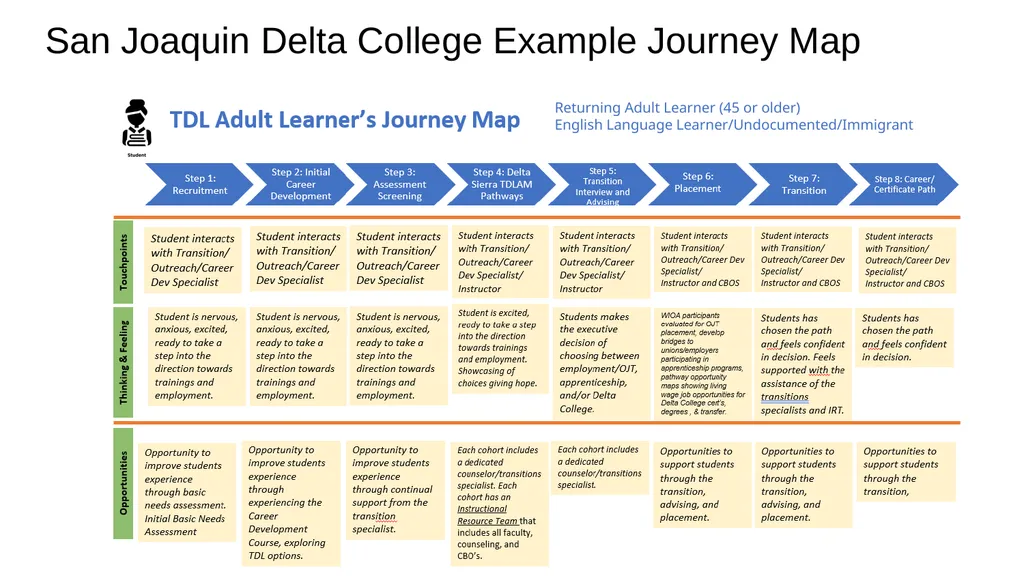
San Joaquin Delta College Example Journey Map Returning Adult Learner (45 or older)
English Language Learner/Undocumented/Immigrant<br>
09
Journey Map: Edit this Version Touchpoints Thinking & Feeling Opportunities<br>
10
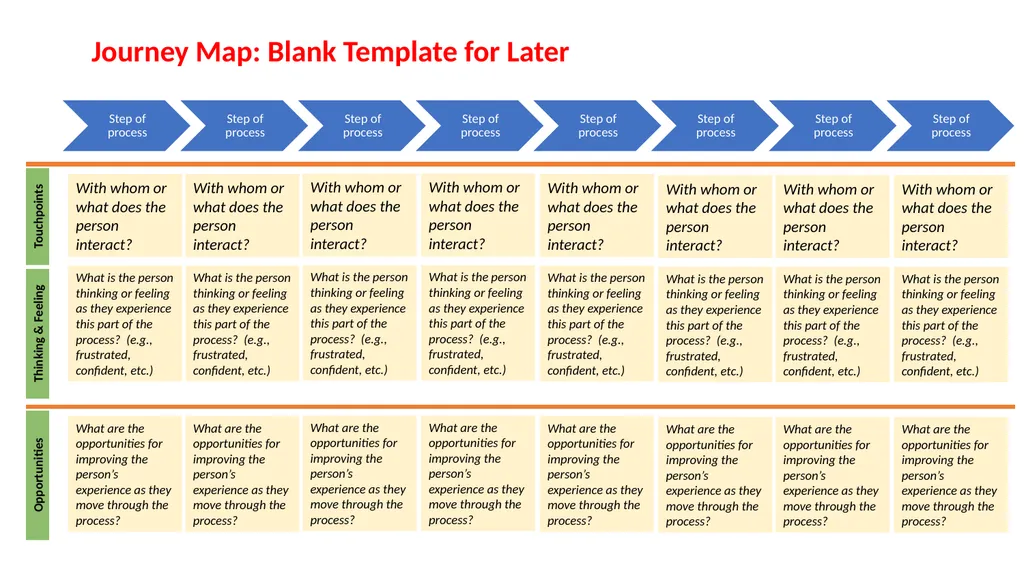
Journey Map: Blank Template for Later Touchpoints Thinking & Feeling Opportunities<br>
11
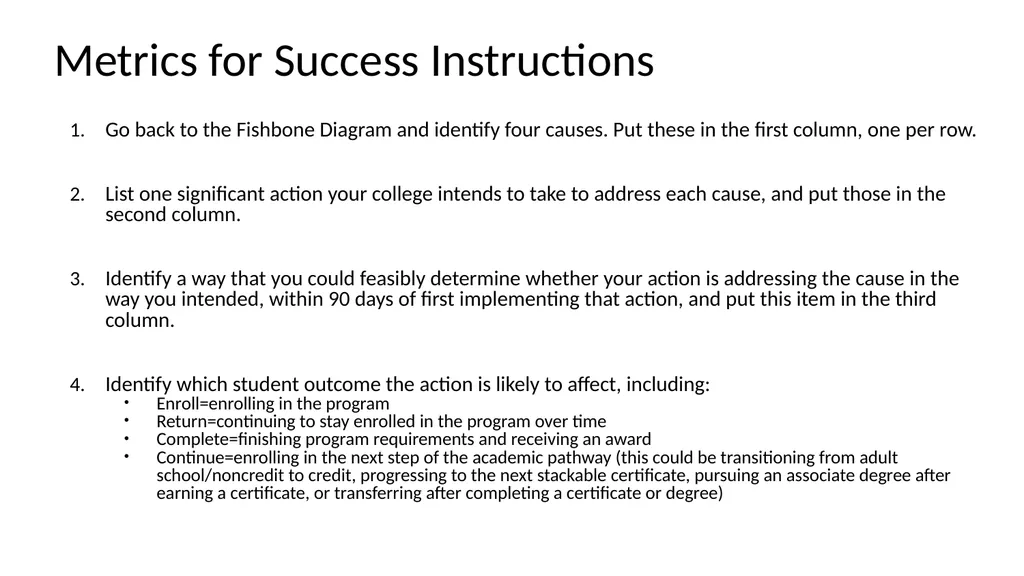
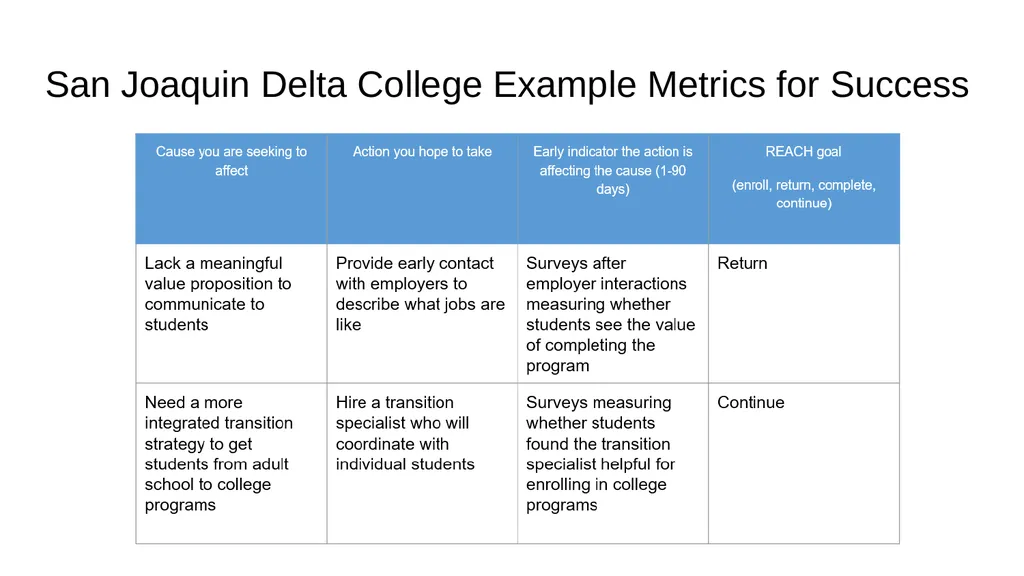
Metrics for Success Instructions Go back to the Fishbone Diagram and identify four causes. Put these in the first column, one per row.
List one significant action your college intends to take to address each cause, and put those in the second column.
Identify a way that you could feasibly determine whether your action is addressing the cause in the way you intended, within 90 days of first implementing that action, and put this item in the third column.
Identify which student outcome the action is likely to affect, including:
Enroll=enrolling in the program
Return=continuing to stay enrolled in the program over time
Complete=finishing program requirements and receiving an award
Continue=enrolling in the next step of the academic pathway (this could be transitioning from adult school/noncredit to credit, progressing to the next stackable certificate, pursuing an associate degree after earning a certificate, or transferring after completing a certificate or degree)<br>
12
San Joaquin Delta College Example Metrics for Success<br>
13
Metrics for Success: Edit this Version<br>
14
Metrics for Success: Blank Template for Later<br>
15
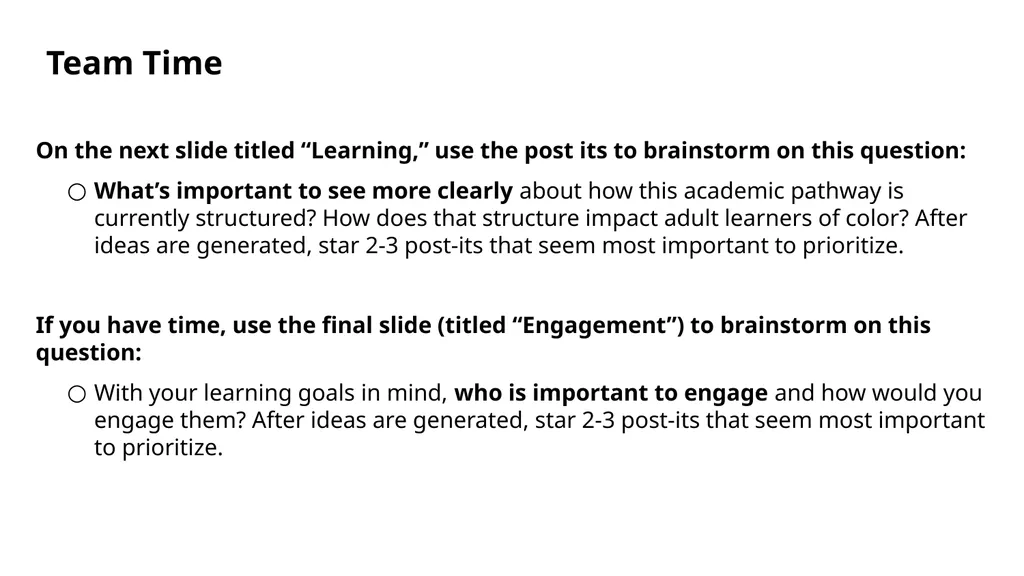
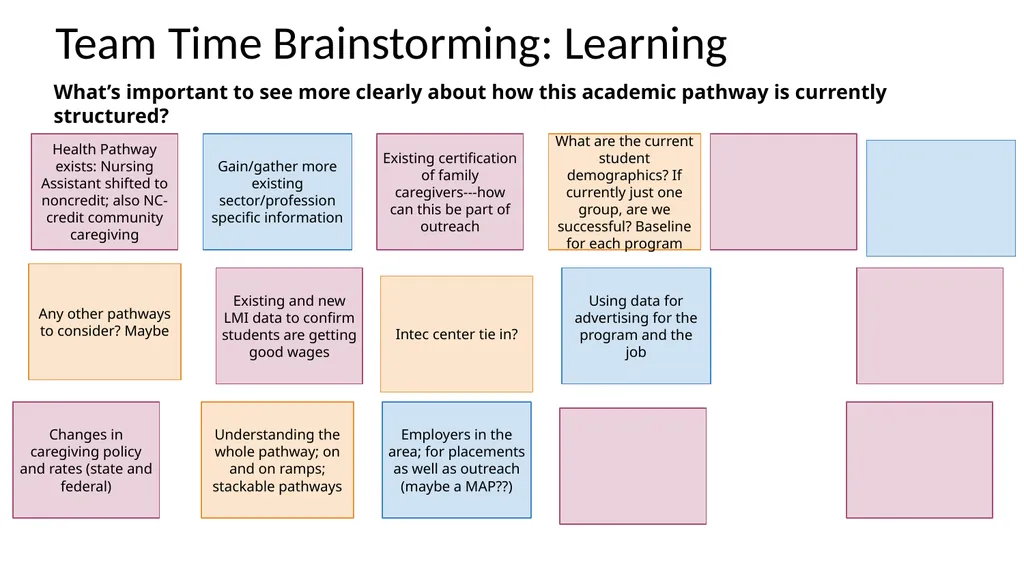
Team Time On the next slide titled “Learning,” use the post its to brainstorm on this question:
What’s important to see more clearly about how this academic pathway is currently structured? How does that structure impact adult learners of color? After ideas are generated, star 2-3 post-its that seem most important to prioritize.
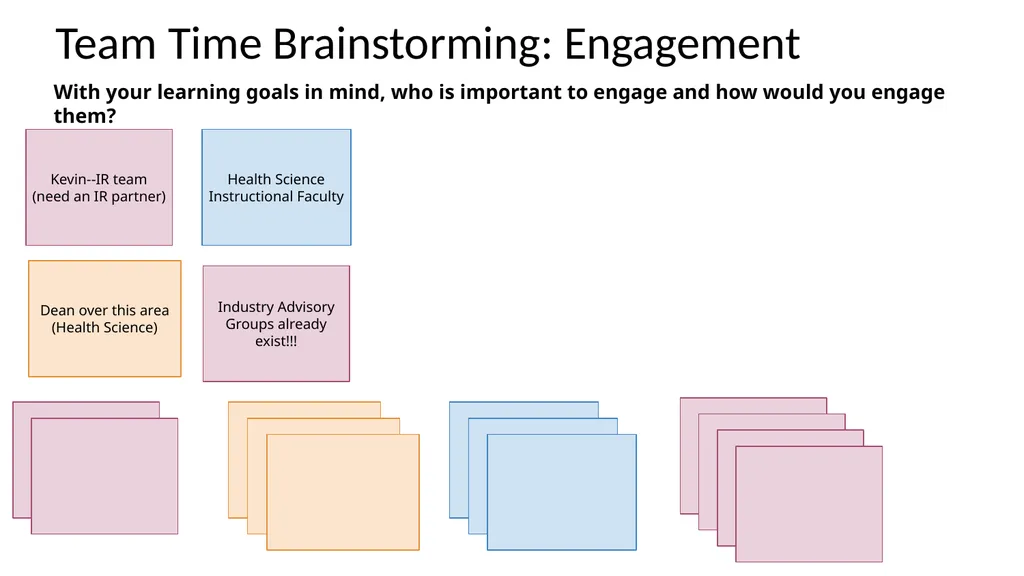
If you have time, use the final slide (titled “Engagement”) to brainstorm on this question:
With your learning goals in mind, who is important to engage and how would you engage them? After ideas are generated, star 2-3 post-its that seem most important to prioritize.<br>
16
Team Time Brainstorming: Learning What’s important to see more clearly about how this academic pathway is currently structured? Changes in caregiving policy and rates (state and federal) Existing certification of family caregivers---how can this be part of outreach Existing and new LMI data to confirm students are getting good wages Health Pathway exists: Nursing Assistant shifted to noncredit; also NC-credit community caregiving Understanding the whole pathway; on and on ramps; stackable pathways What are the current student demographics? If currently just one group, are we successful? Baseline for each program Intec center tie in? Any other pathways to consider? Maybe Employers in the area; for placements as well as outreach (maybe a MAP??) Using data for advertising for the program and the job Gain/gather more existing sector/profession specific information<br>
17
Team Time Brainstorming: Engagement With your learning goals in mind, who is important to engage and how would you engage them? Industry Advisory Groups already exist!!! Kevin--IR team (need an IR partner) Dean over this area (Health Science) Health Science Instructional Faculty<br>