REAMP Discussion September 25, 2014 Global, National and Illinois Basin Coal Trends Tom Sanzillo Director of Finance Global Coal Production 2008-2013 Worlds Largest Producers Worlds Largest Consumers Global ImportsExports: Global Trade
Related Topics
Share
Embed code
Download this presentation From Below
"REAMP Discussion September 25, 2014 Global," is the property of its rightful owner. Permission is granted to
download and print the materials on this website for personal, non-commercial use only, and to display it
on your personal computer provided you do not modify the materials and that you retain all copyright
notices contained in the materials. By downloading content from our website, you accept the terms of this
agreement.
Presentation Transcript
01
REAMP Discussion
September 25, 2014 Global, National and Illinois Basin Coal Trends Tom Sanzillo
Director of Finance<br>
02
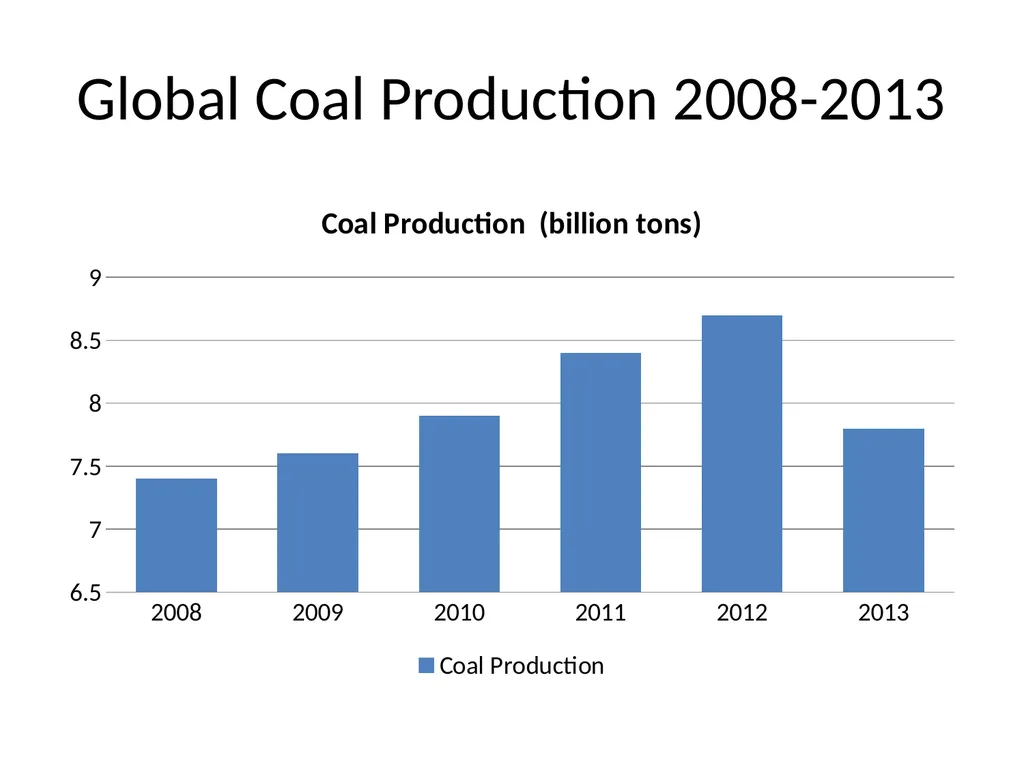
Global Coal Production 2008-2013<br>
03
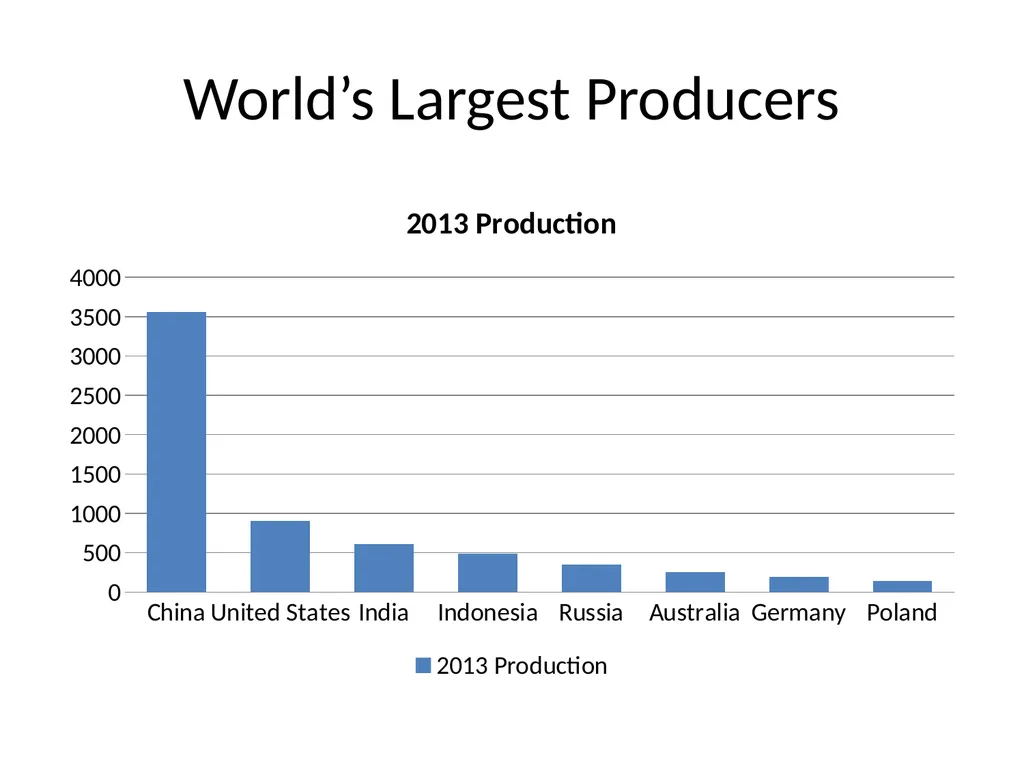
World’s Largest Producers<br>
04
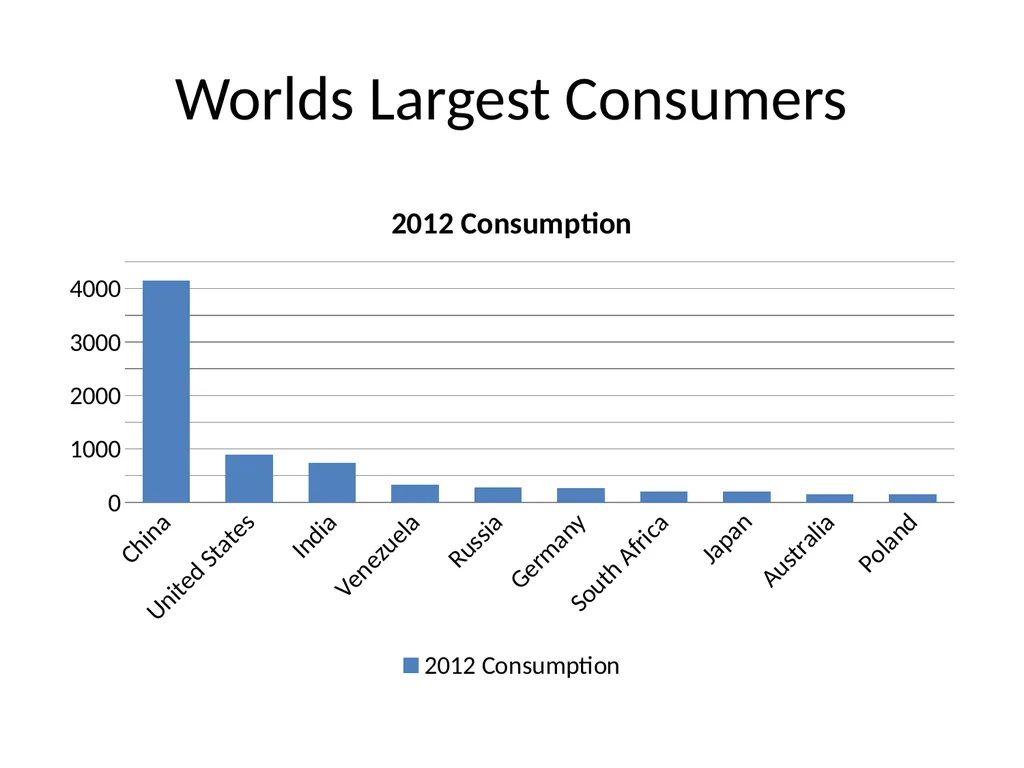
Worlds Largest Consumers<br>
05
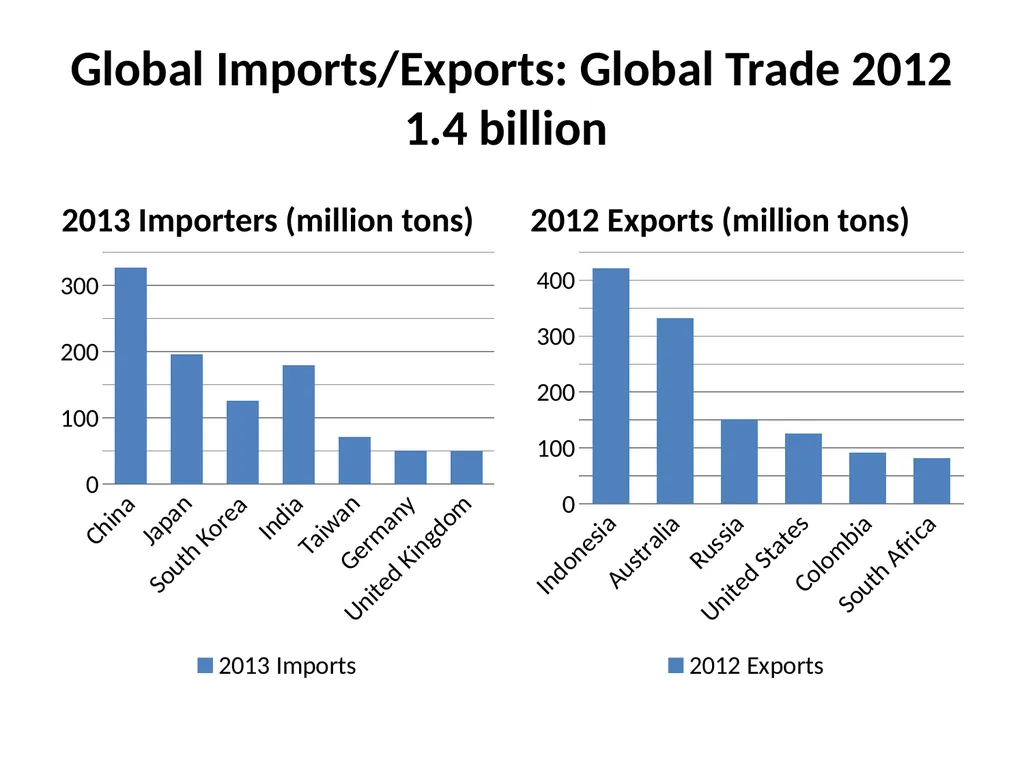
Global Imports/Exports: Global Trade 2012 1.4 billion 2013 Importers (million tons) 2012 Exports (million tons)<br>
06
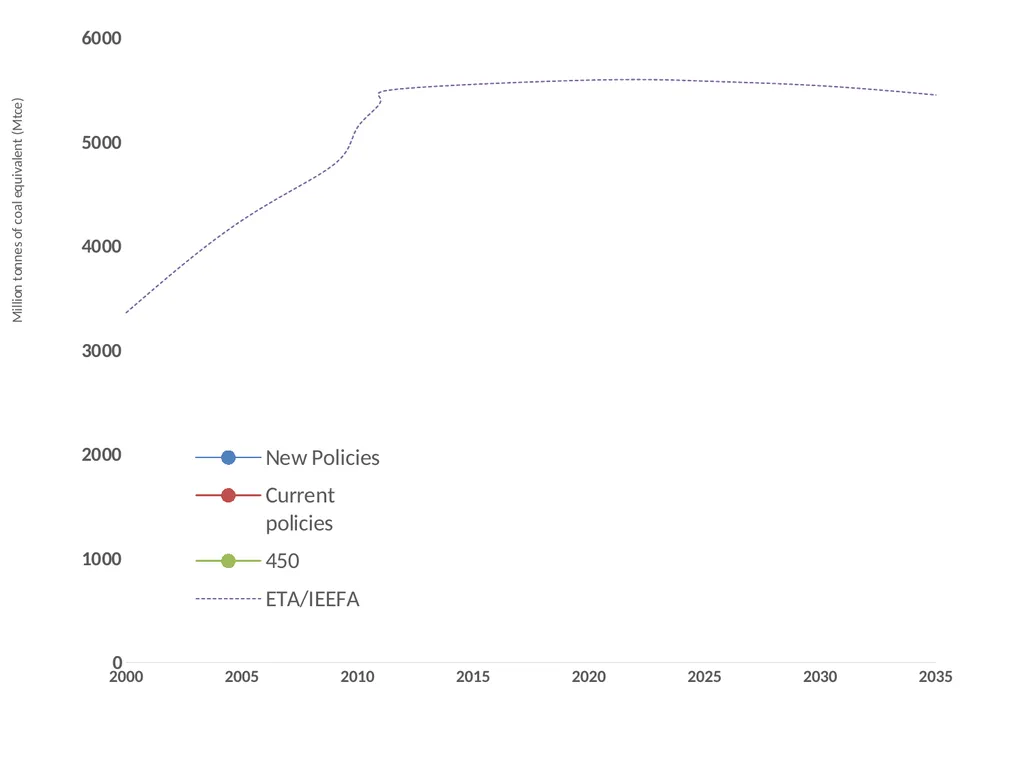
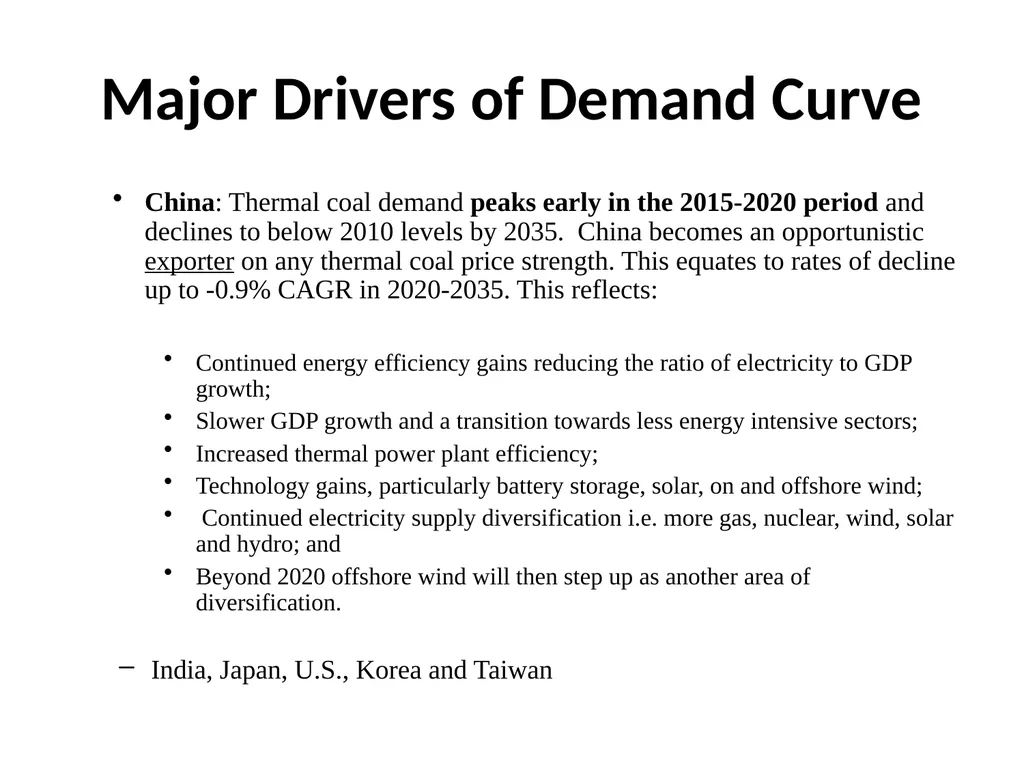
Major Drivers of Demand Curve China: Thermal coal demand peaks early in the 2015-2020 period and declines to below 2010 levels by 2035. China becomes an opportunistic exporter on any thermal coal price strength. This equates to rates of decline up to -0.9% CAGR in 2020-2035. This reflects:
Continued energy efficiency gains reducing the ratio of electricity to GDP growth;
Slower GDP growth and a transition towards less energy intensive sectors;
Increased thermal power plant efficiency;
Technology gains, particularly battery storage, solar, on and offshore wind;
Continued electricity supply diversification i.e. more gas, nuclear, wind, solar and hydro; and
Beyond 2020 offshore wind will then step up as another area of diversification.
India, Japan, U.S., Korea and Taiwan<br>
07
United States Coal Markets<br>
08
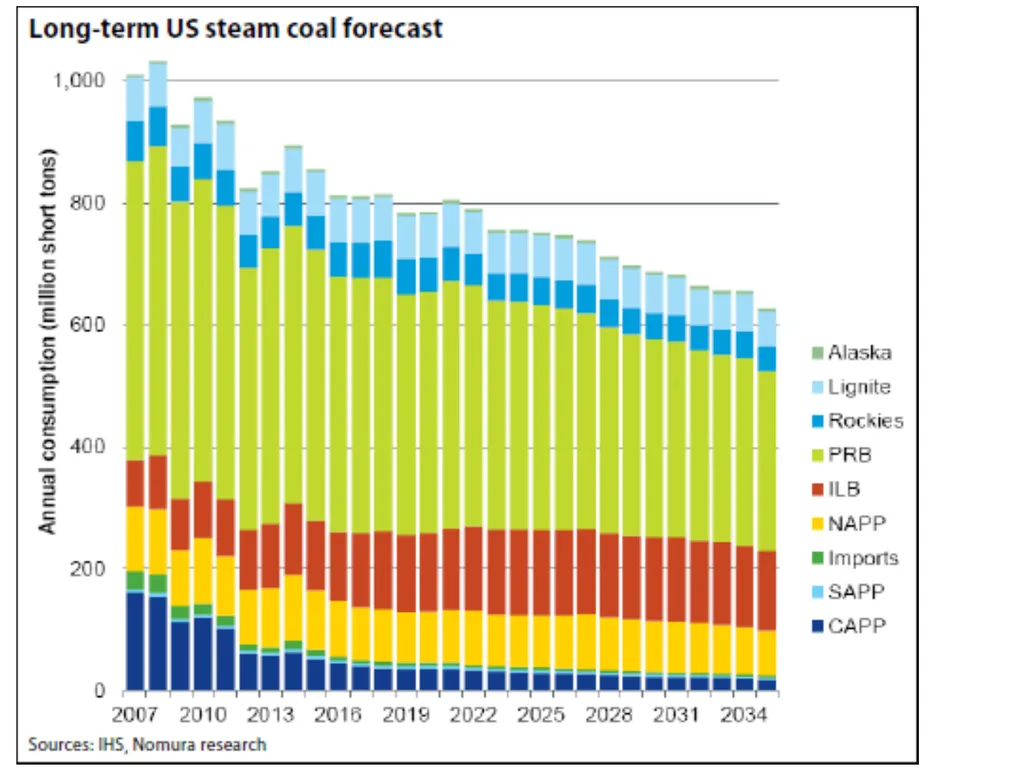
Coal’s Share of U.S. Electricity LT Decline 11<br>
09
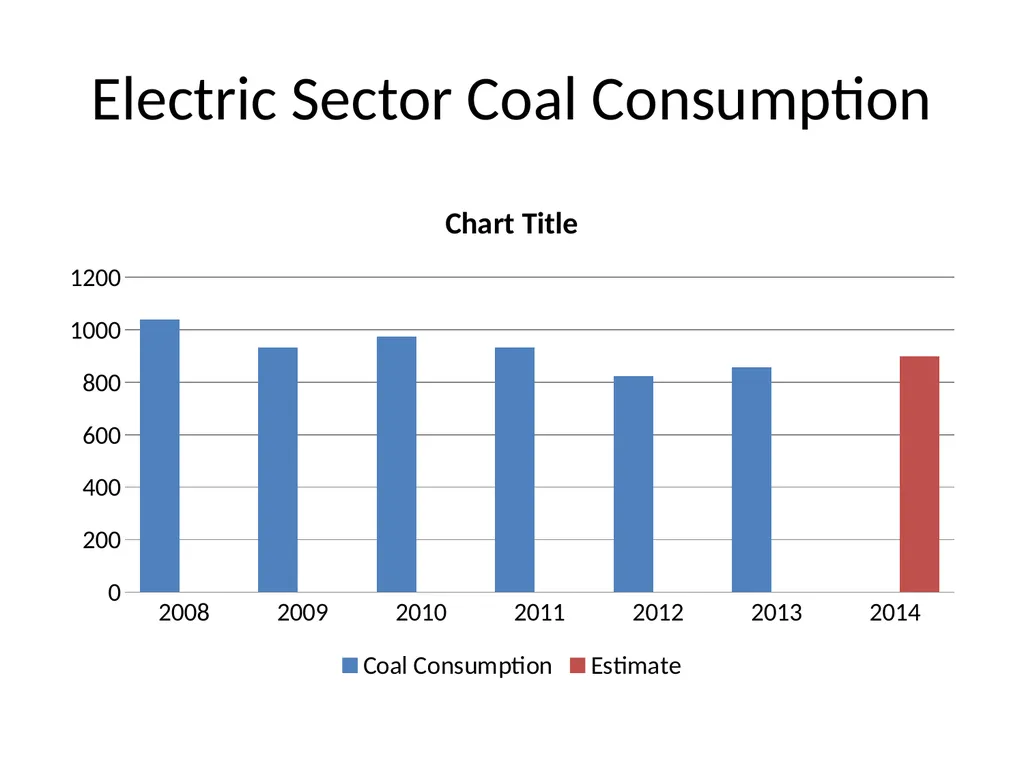
Electric Sector Coal Consumption<br>
10
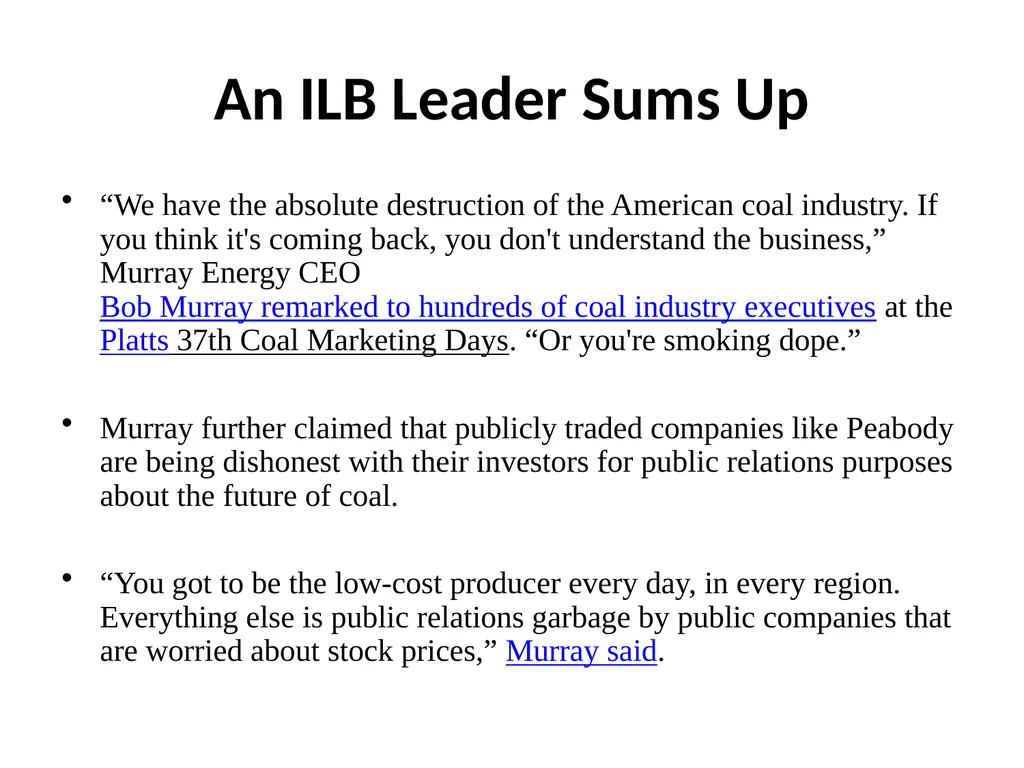
An ILB Leader Sums Up “We have the absolute destruction of the American coal industry. If you think it's coming back, you don't understand the business,” Murray Energy CEO Bob Murray remarked to hundreds of coal industry executives at the Platts 37th Coal Marketing Days. “Or you're smoking dope.”
Murray further claimed that publicly traded companies like Peabody are being dishonest with their investors for public relations purposes about the future of coal.
“You got to be the low-cost producer every day, in every region. Everything else is public relations garbage by public companies that are worried about stock prices,” Murray said.<br>
11
Illinois Basin<br>
12
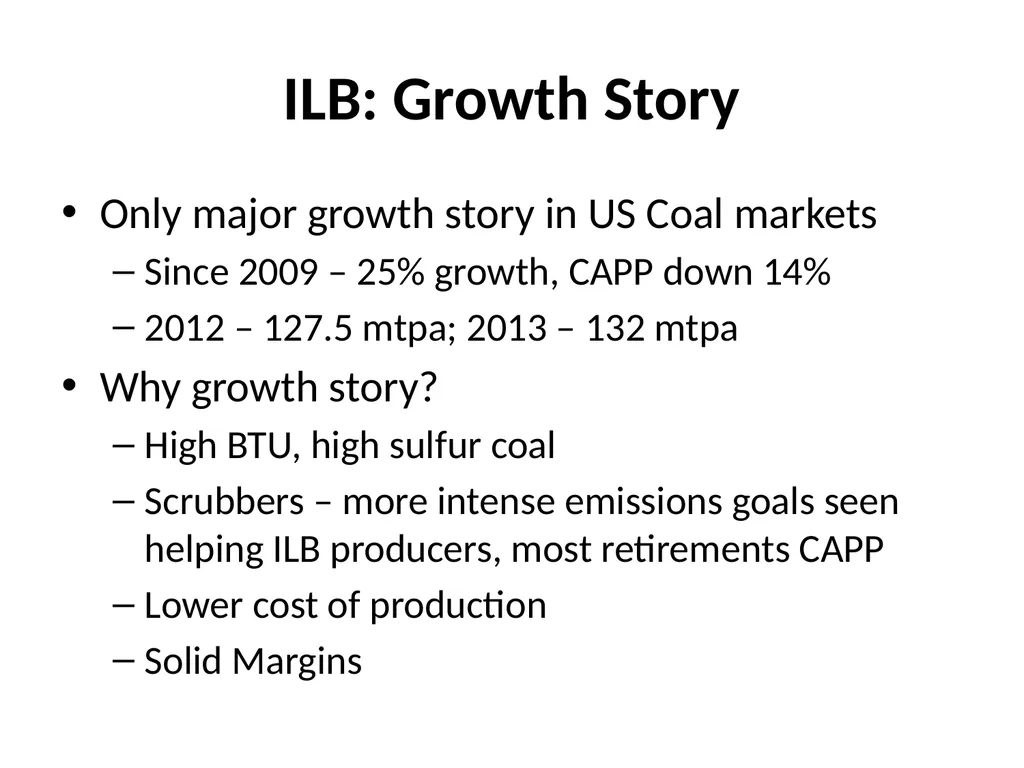
ILB: Growth Story Only major growth story in US Coal markets
Since 2009 – 25% growth, CAPP down 14%
2012 – 127.5 mtpa; 2013 – 132 mtpa
Why growth story?
High BTU, high sulfur coal
Scrubbers – more intense emissions goals seen helping ILB producers, most retirements CAPP
Lower cost of production
Solid Margins<br>
13
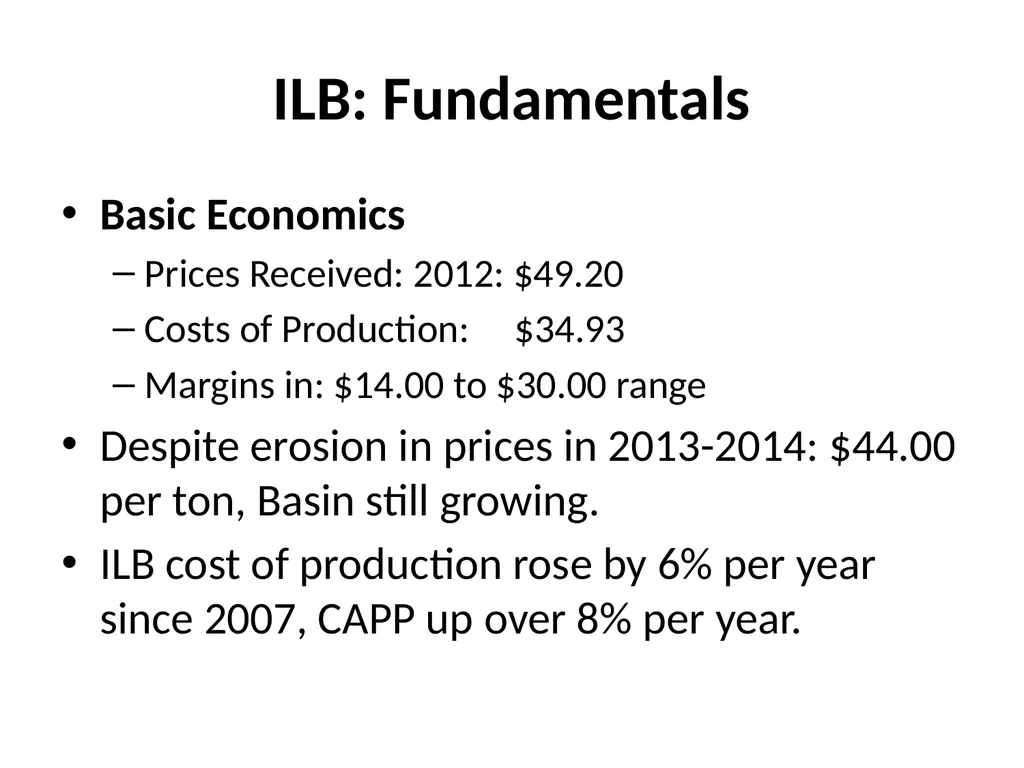
ILB: Fundamentals Basic Economics
Prices Received: 2012: $49.20
Costs of Production: $34.93
Margins in: $14.00 to $30.00 range
Despite erosion in prices in 2013-2014: $44.00 per ton, Basin still growing.
ILB cost of production rose by 6% per year since 2007, CAPP up over 8% per year.<br>
14
Investment Taking Place Major Companies all expanding operations with new mines in construction and under permit
Largest Producers
Peabody, Alliance, Foresight, Murray and Armstrong
Strong cast of smaller players: Knight Hawk (Arch), Vectren, Hallador<br>
15
Exports and Potential Companies geared up for more exports
Foresight led in 2012 with 7.7 mtpa off based of 16 mtpa.
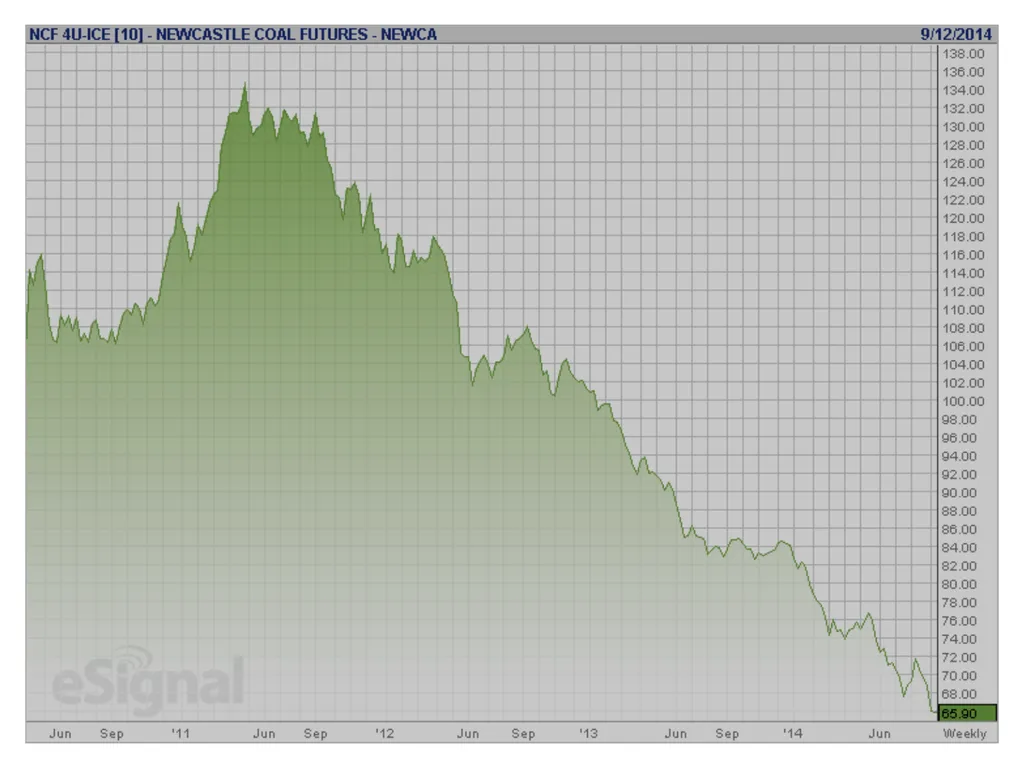
2013 and current year price collapse globally, lower exports – approximately 7 mtpa.
Port of New Orleans – 92% of ILB exports - multiple terminals and Port of Mobile<br>
16
Exports and Potential Where is market
Americas (Canada, Chile, Mexico)
Europe (France, Great Britain, Germany, Spain)
Asia (China, India and South Korea)<br>
17
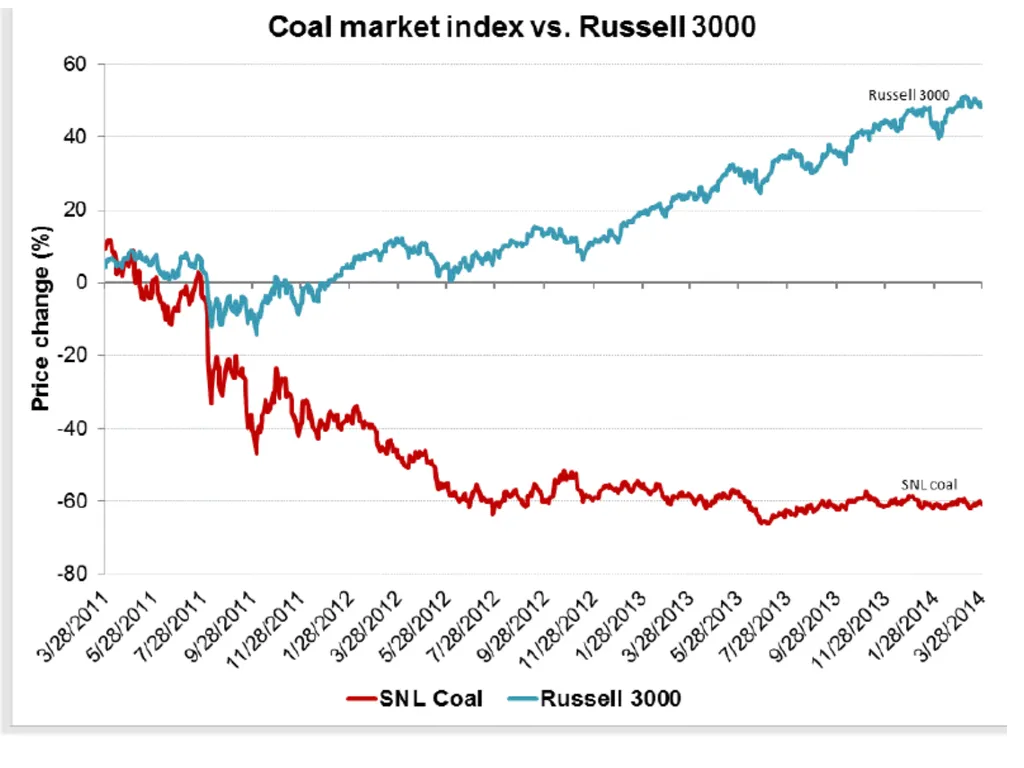
Risks Although margins are solid for Foresight and Alliance – Arch, Peabody hurt by price erosion.
How long can they handle low prices
Soft global markets undermine larger efforts of combining domestic and export mix.
Old Customers buying more – Duke, TVA, Southern, but in context of overall coal demand decrease.<br>