
Residential Wood Combustion (RWC) Emission
CS
Published · 24 slides · 0 views

1 / 1




Description
Residential Wood Combustion (RWC) Emission Estimation Methods for the 2023 National Emissions Inventory (NEI) Updates to the 2020 Methodology for the 2023 NEI 1 Contacts: Madeleine Strum, Rich Mason EPAOAQPSEmissions Inventory and
Related Topics
Share
Embed code
Download this presentation From Below
"Residential Wood Combustion (RWC) Emission" is the property of its rightful owner. Permission is granted to download and print the materials on this website for personal, non-commercial use only, and to display it on your personal computer provided you do not modify the materials and that you retain all copyright notices contained in the materials. By downloading content from our website, you accept the terms of this agreement.
Presentation Transcript
01
Residential Wood Combustion (RWC) Emission Estimation Methods for the 2023 National Emissions Inventory (NEI) Updates to the 2020 Methodology for the 2023 NEI 1 Contacts: Madeleine Strum, Rich Mason
EPA/OAQPS/Emissions Inventory and Analysis Group
May 29, 2025<br>
EPA/OAQPS/Emissions Inventory and Analysis Group
May 29, 2025<br>
02
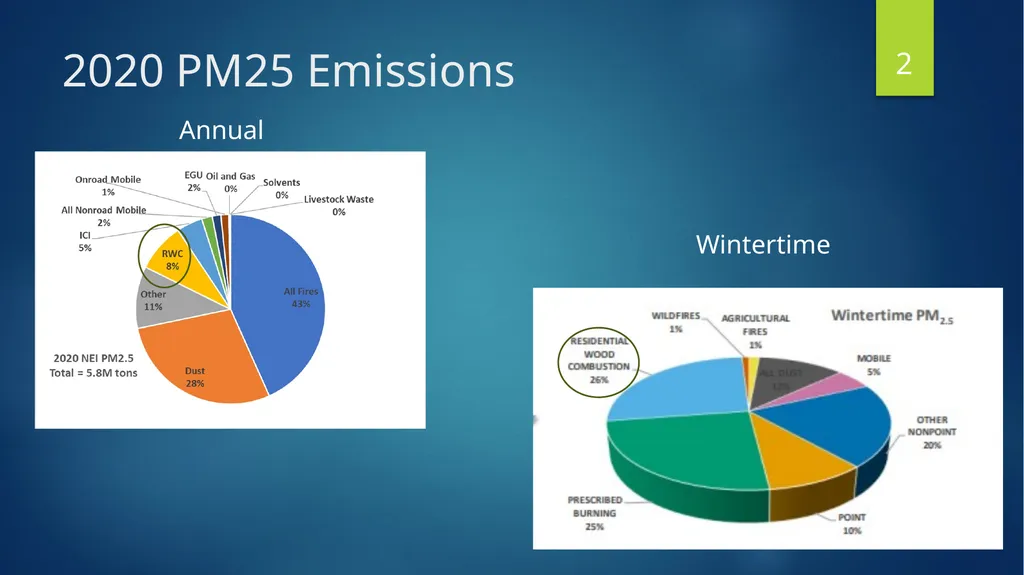
2020 PM25 Emissions 2 Annual Wintertime<br>
03
Overview of Presentation Approach Overview
Changes to SCCs from 2020 NEI to 2023
Changes to Emission Factors (EFs)
Changes to Activity Data
Summaries of Differences based on new methodology using 2022 activity data 3<br>
Changes to SCCs from 2020 NEI to 2023
Changes to Emission Factors (EFs)
Changes to Activity Data
Summaries of Differences based on new methodology using 2022 activity data 3<br>
04
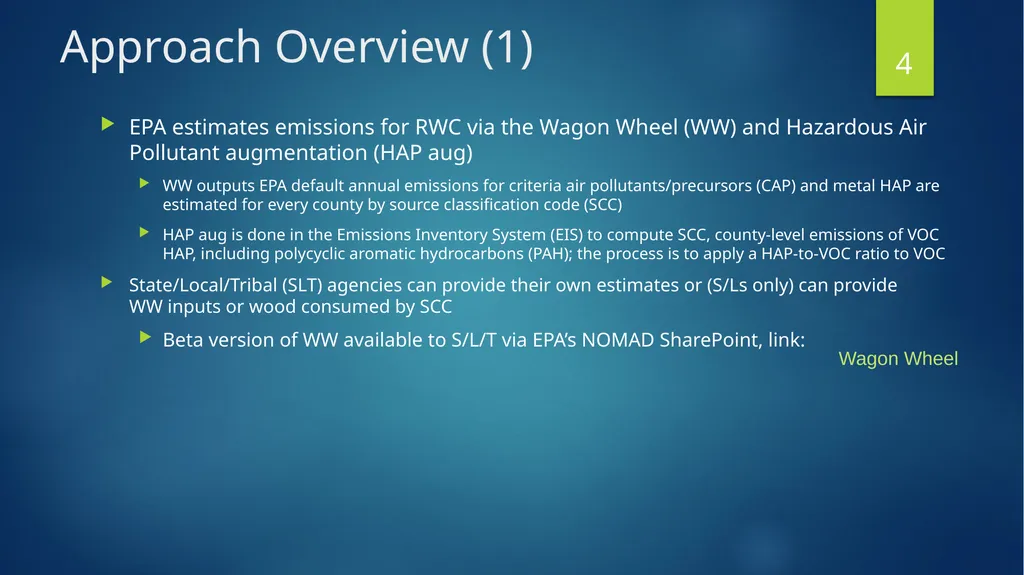
Approach Overview (1) EPA estimates emissions for RWC via the Wagon Wheel (WW) and Hazardous Air Pollutant augmentation (HAP aug)
WW outputs EPA default annual emissions for criteria air pollutants/precursors (CAP) and metal HAP are estimated for every county by source classification code (SCC)
HAP aug is done in the Emissions Inventory System (EIS) to compute SCC, county-level emissions of VOC HAP, including polycyclic aromatic hydrocarbons (PAH); the process is to apply a HAP-to-VOC ratio to VOC
State/Local/Tribal (SLT) agencies can provide their own estimates or (S/Ls only) can provide WW inputs or wood consumed by SCC
Beta version of WW available to S/L/T via EPA’s NOMAD SharePoint, link: 4 Wagon Wheel<br>
WW outputs EPA default annual emissions for criteria air pollutants/precursors (CAP) and metal HAP are estimated for every county by source classification code (SCC)
HAP aug is done in the Emissions Inventory System (EIS) to compute SCC, county-level emissions of VOC HAP, including polycyclic aromatic hydrocarbons (PAH); the process is to apply a HAP-to-VOC ratio to VOC
State/Local/Tribal (SLT) agencies can provide their own estimates or (S/Ls only) can provide WW inputs or wood consumed by SCC
Beta version of WW available to S/L/T via EPA’s NOMAD SharePoint, link: 4 Wagon Wheel<br>
05
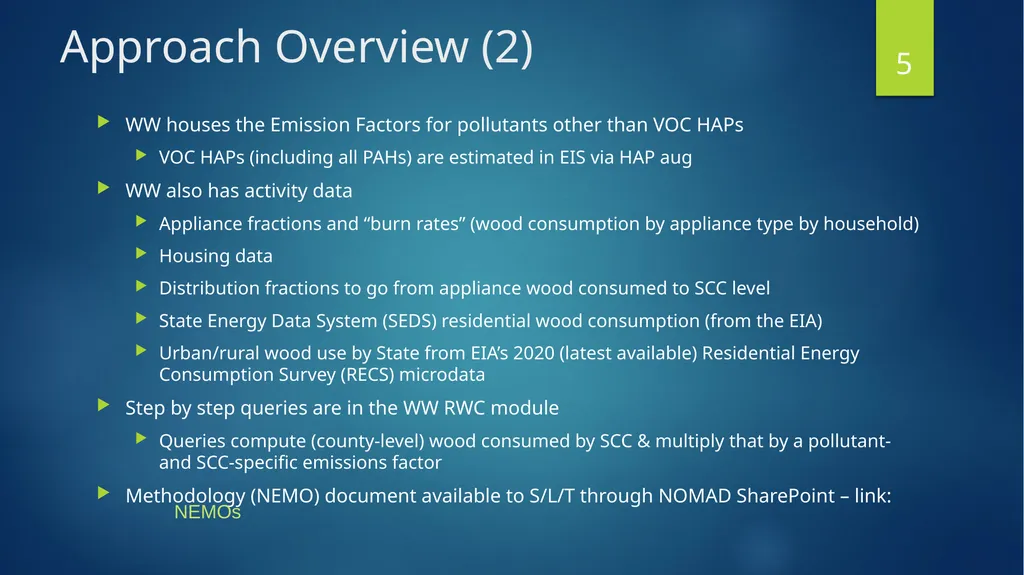
Approach Overview (2) WW houses the Emission Factors for pollutants other than VOC HAPs
VOC HAPs (including all PAHs) are estimated in EIS via HAP aug
WW also has activity data
Appliance fractions and “burn rates” (wood consumption by appliance type by household)
Housing data
Distribution fractions to go from appliance wood consumed to SCC level
State Energy Data System (SEDS) residential wood consumption (from the EIA)
Urban/rural wood use by State from EIA’s 2020 (latest available) Residential Energy Consumption Survey (RECS) microdata
Step by step queries are in the WW RWC module
Queries compute (county-level) wood consumed by SCC & multiply that by a pollutant- and SCC-specific emissions factor
Methodology (NEMO) document available to S/L/T through NOMAD SharePoint – link: 5 NEMOs<br>
VOC HAPs (including all PAHs) are estimated in EIS via HAP aug
WW also has activity data
Appliance fractions and “burn rates” (wood consumption by appliance type by household)
Housing data
Distribution fractions to go from appliance wood consumed to SCC level
State Energy Data System (SEDS) residential wood consumption (from the EIA)
Urban/rural wood use by State from EIA’s 2020 (latest available) Residential Energy Consumption Survey (RECS) microdata
Step by step queries are in the WW RWC module
Queries compute (county-level) wood consumed by SCC & multiply that by a pollutant- and SCC-specific emissions factor
Methodology (NEMO) document available to S/L/T through NOMAD SharePoint – link: 5 NEMOs<br>
06
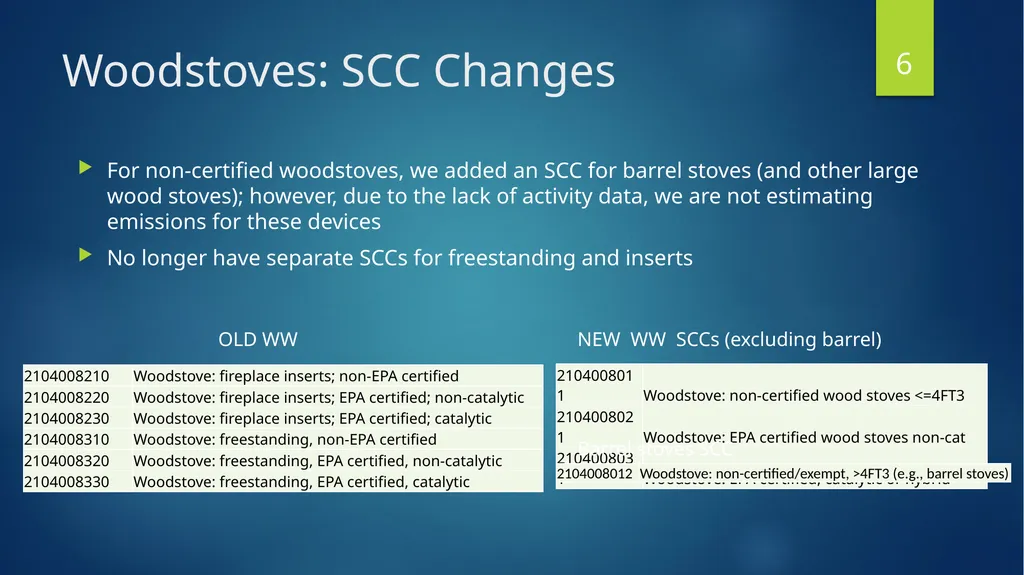
Woodstoves: SCC Changes For non-certified woodstoves, we added an SCC for barrel stoves (and other large wood stoves); however, due to the lack of activity data, we are not estimating emissions for these devices
No longer have separate SCCs for freestanding and inserts 6 OLD WW NEW WW SCCs (excluding barrel) Barrel stoves SCC<br>
No longer have separate SCCs for freestanding and inserts 6 OLD WW NEW WW SCCs (excluding barrel) Barrel stoves SCC<br>
07
Cordwood Central Heaters: SCC Changes Differentiated indoor and outdoor hydronic heaters (HH) into certified vs uncertified
Furnaces now use same SCC for certified & uncertified (“general”) 7 OLD WW SCCs NEW WW SCCs<br>
Furnaces now use same SCC for certified & uncertified (“general”) 7 OLD WW SCCs NEW WW SCCs<br>
08
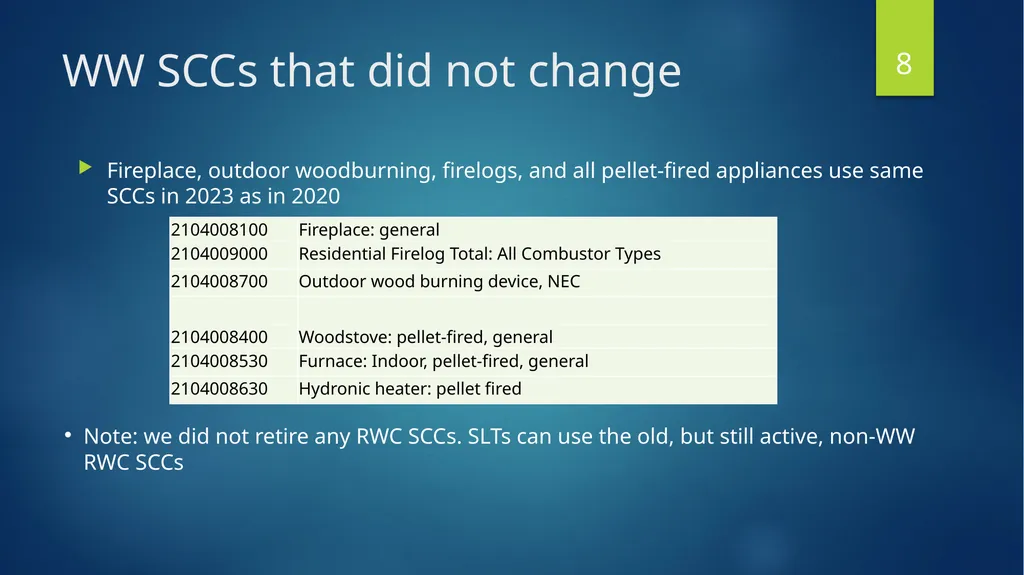
WW SCCs that did not change Fireplace, outdoor woodburning, firelogs, and all pellet-fired appliances use same SCCs in 2023 as in 2020 8 Note: we did not retire any RWC SCCs. SLTs can use the old, but still active, non-WW RWC SCCs<br>
09
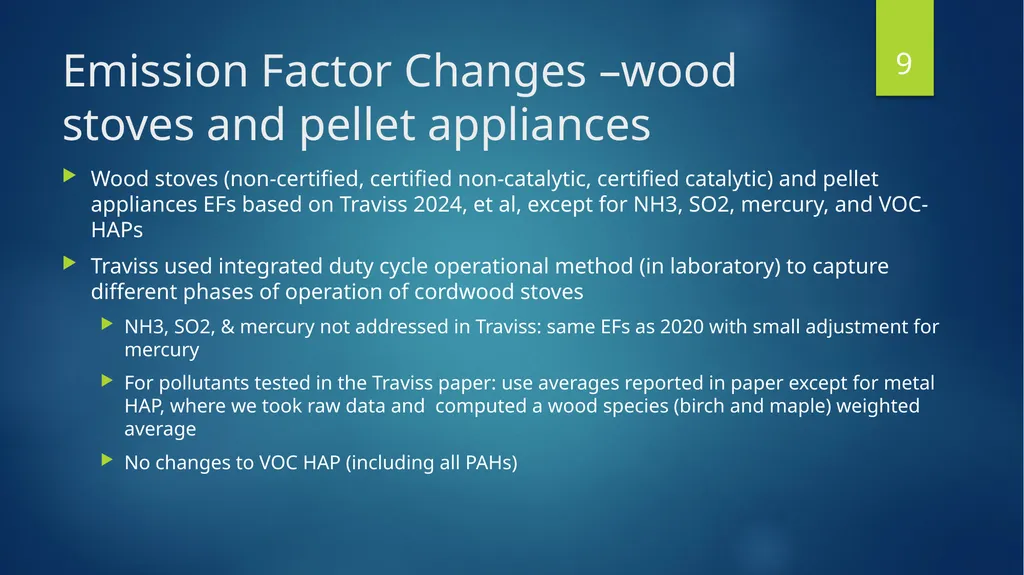
Emission Factor Changes –wood stoves and pellet appliances Wood stoves (non-certified, certified non-catalytic, certified catalytic) and pellet appliances EFs based on Traviss 2024, et al, except for NH3, SO2, mercury, and VOC-HAPs
Traviss used integrated duty cycle operational method (in laboratory) to capture different phases of operation of cordwood stoves
NH3, SO2, & mercury not addressed in Traviss: same EFs as 2020 with small adjustment for mercury
For pollutants tested in the Traviss paper: use averages reported in paper except for metal HAP, where we took raw data and computed a wood species (birch and maple) weighted average
No changes to VOC HAP (including all PAHs) 9<br>
Traviss used integrated duty cycle operational method (in laboratory) to capture different phases of operation of cordwood stoves
NH3, SO2, & mercury not addressed in Traviss: same EFs as 2020 with small adjustment for mercury
For pollutants tested in the Traviss paper: use averages reported in paper except for metal HAP, where we took raw data and computed a wood species (birch and maple) weighted average
No changes to VOC HAP (including all PAHs) 9<br>
10
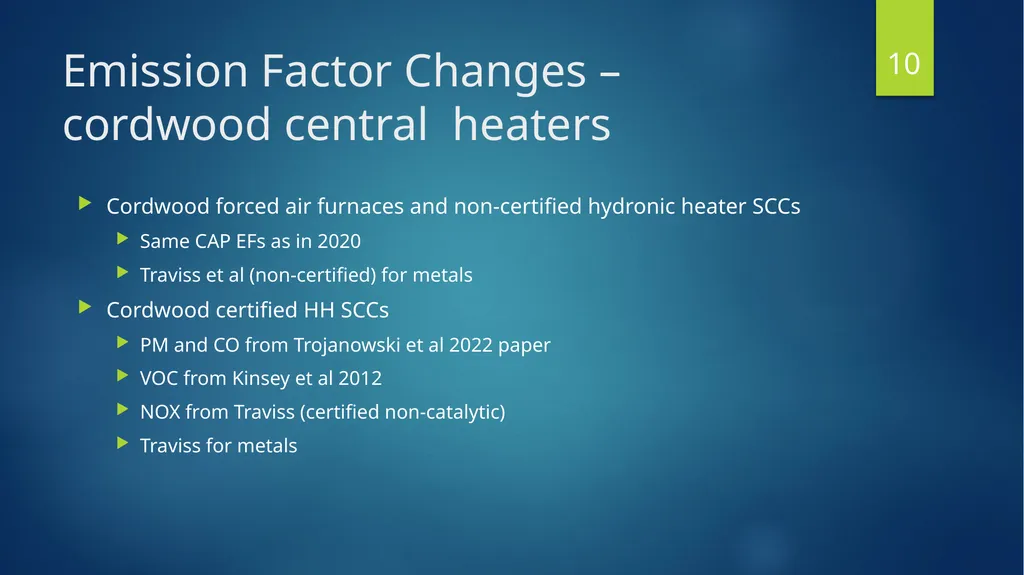
Emission Factor Changes – cordwood central heaters Cordwood forced air furnaces and non-certified hydronic heater SCCs
Same CAP EFs as in 2020
Traviss et al (non-certified) for metals
Cordwood certified HH SCCs
PM and CO from Trojanowski et al 2022 paper
VOC from Kinsey et al 2012
NOX from Traviss (certified non-catalytic)
Traviss for metals 10<br>
Same CAP EFs as in 2020
Traviss et al (non-certified) for metals
Cordwood certified HH SCCs
PM and CO from Trojanowski et al 2022 paper
VOC from Kinsey et al 2012
NOX from Traviss (certified non-catalytic)
Traviss for metals 10<br>
11
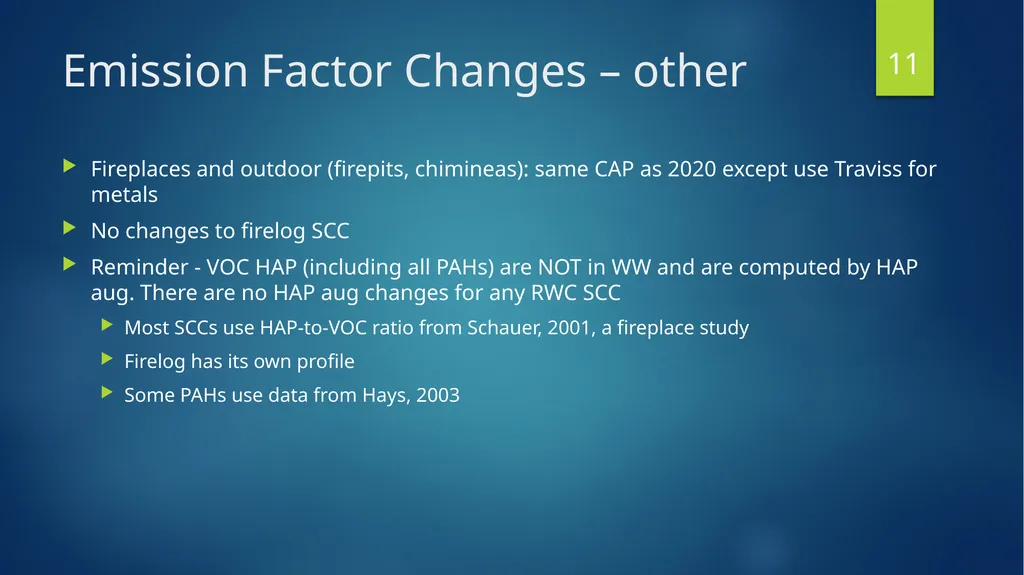
Emission Factor Changes – other Fireplaces and outdoor (firepits, chimineas): same CAP as 2020 except use Traviss for metals
No changes to firelog SCC
Reminder - VOC HAP (including all PAHs) are NOT in WW and are computed by HAP aug. There are no HAP aug changes for any RWC SCC
Most SCCs use HAP-to-VOC ratio from Schauer, 2001, a fireplace study
Firelog has its own profile
Some PAHs use data from Hays, 2003 11<br>
No changes to firelog SCC
Reminder - VOC HAP (including all PAHs) are NOT in WW and are computed by HAP aug. There are no HAP aug changes for any RWC SCC
Most SCCs use HAP-to-VOC ratio from Schauer, 2001, a fireplace study
Firelog has its own profile
Some PAHs use data from Hays, 2003 11<br>
12
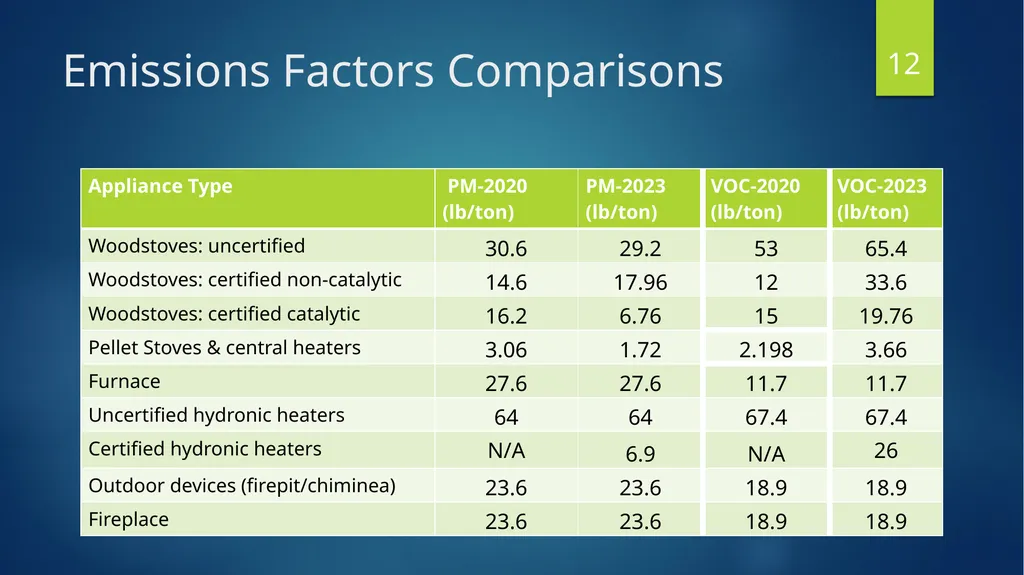
Emissions Factors Comparisons 12<br>
13
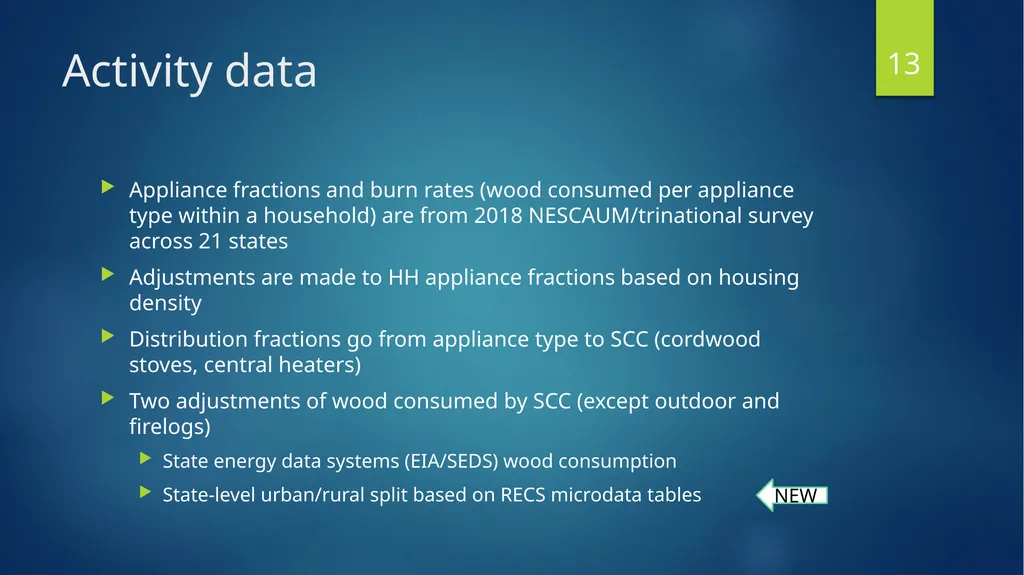
Activity data Appliance fractions and burn rates (wood consumed per appliance type within a household) are from 2018 NESCAUM/trinational survey across 21 states
Adjustments are made to HH appliance fractions based on housing density
Distribution fractions go from appliance type to SCC (cordwood stoves, central heaters)
Two adjustments of wood consumed by SCC (except outdoor and firelogs)
State energy data systems (EIA/SEDS) wood consumption
State-level urban/rural split based on RECS microdata tables 13 NEW<br>
Adjustments are made to HH appliance fractions based on housing density
Distribution fractions go from appliance type to SCC (cordwood stoves, central heaters)
Two adjustments of wood consumed by SCC (except outdoor and firelogs)
State energy data systems (EIA/SEDS) wood consumption
State-level urban/rural split based on RECS microdata tables 13 NEW<br>
14
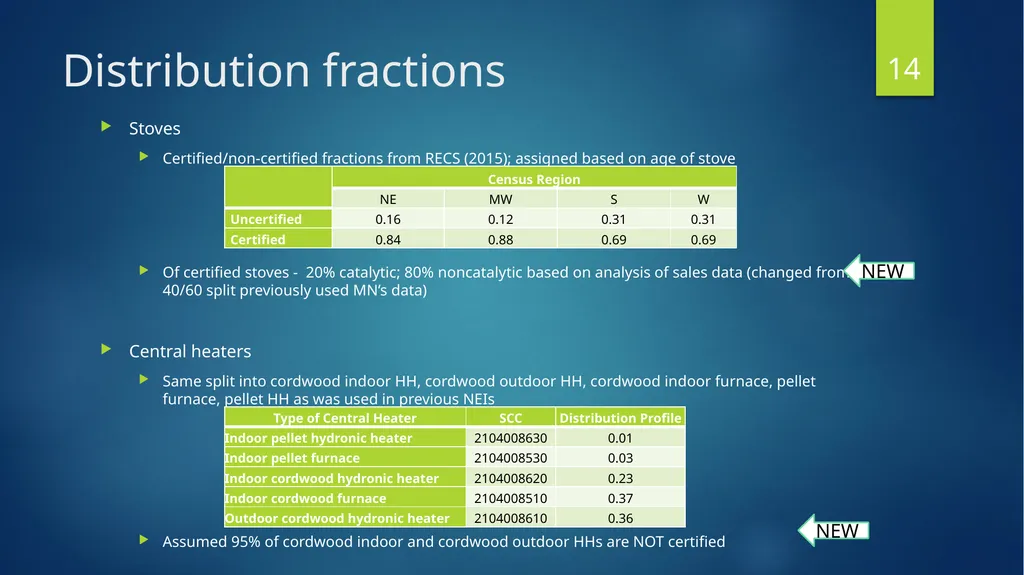
Distribution fractions Stoves
Certified/non-certified fractions from RECS (2015); assigned based on age of stove
Of certified stoves - 20% catalytic; 80% noncatalytic based on analysis of sales data (changed from 40/60 split previously used MN’s data)
Central heaters
Same split into cordwood indoor HH, cordwood outdoor HH, cordwood indoor furnace, pellet furnace, pellet HH as was used in previous NEIs
Assumed 95% of cordwood indoor and cordwood outdoor HHs are NOT certified 14 NEW NEW<br>
Certified/non-certified fractions from RECS (2015); assigned based on age of stove
Of certified stoves - 20% catalytic; 80% noncatalytic based on analysis of sales data (changed from 40/60 split previously used MN’s data)
Central heaters
Same split into cordwood indoor HH, cordwood outdoor HH, cordwood indoor furnace, pellet furnace, pellet HH as was used in previous NEIs
Assumed 95% of cordwood indoor and cordwood outdoor HHs are NOT certified 14 NEW NEW<br>
15
Adjustments to estimated wood consumption Appliance fraction adjustments made to HH based on housing density (no change)
After wood consumption by county is computed, 2 adjustments are made to all SCCs except outdoor (firepits) and firelogs
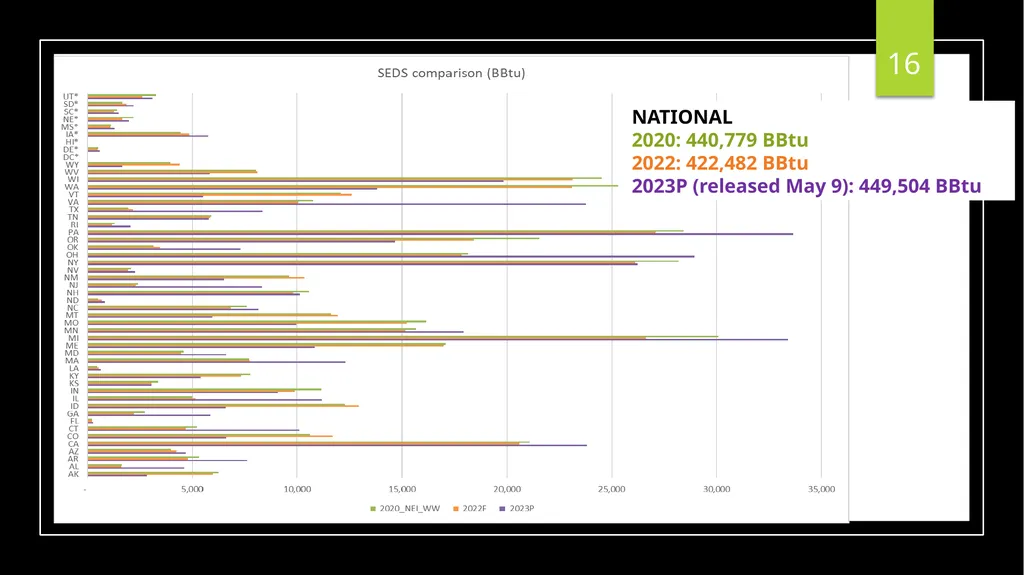
SEDS -- Will use 2023 SEDs, currently (WW Beta 2.3) using 2022 EIA SEDS
SEDS methodology changed for 2023P- see workbook posted on NOMAD SharePoint site:
County wood consumption adjusted so that state-level fraction of urban/rural wood consumption ratio matches the RECS 15 SEDS_WOODBTU_2020NEI_2022PF_2023P_v2.xlsx NEW<br>
After wood consumption by county is computed, 2 adjustments are made to all SCCs except outdoor (firepits) and firelogs
SEDS -- Will use 2023 SEDs, currently (WW Beta 2.3) using 2022 EIA SEDS
SEDS methodology changed for 2023P- see workbook posted on NOMAD SharePoint site:
County wood consumption adjusted so that state-level fraction of urban/rural wood consumption ratio matches the RECS 15 SEDS_WOODBTU_2020NEI_2022PF_2023P_v2.xlsx NEW<br>
16
16 NATIONAL
2020: 440,779 BBtu
2022: 422,482 BBtu
2023P (released May 9): 449,504 BBtu<br>
2020: 440,779 BBtu
2022: 422,482 BBtu
2023P (released May 9): 449,504 BBtu<br>
17
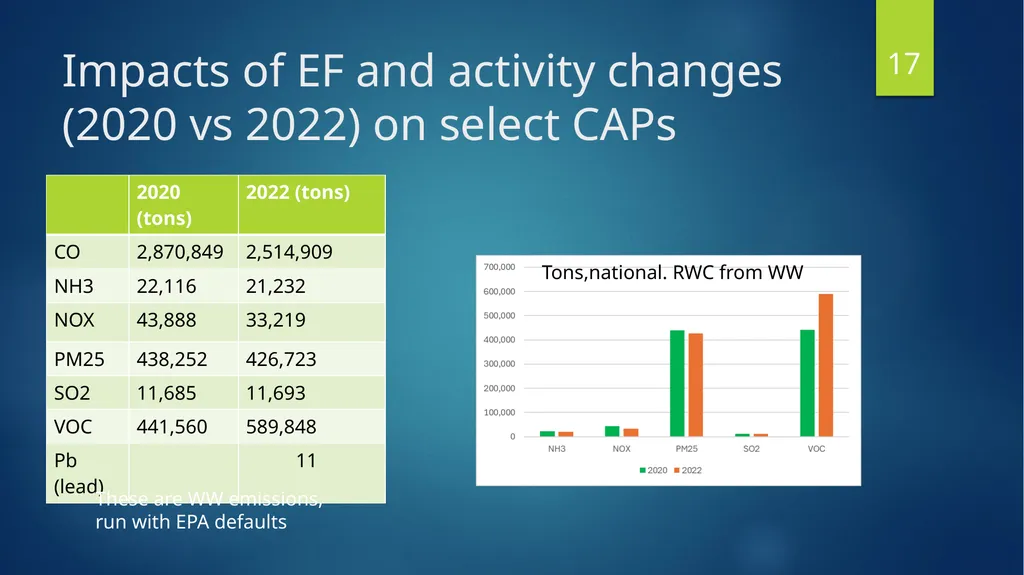
Impacts of EF and activity changes (2020 vs 2022) on select CAPs 17 These are WW emissions, run with EPA defaults Tons,national. RWC from WW<br>
18
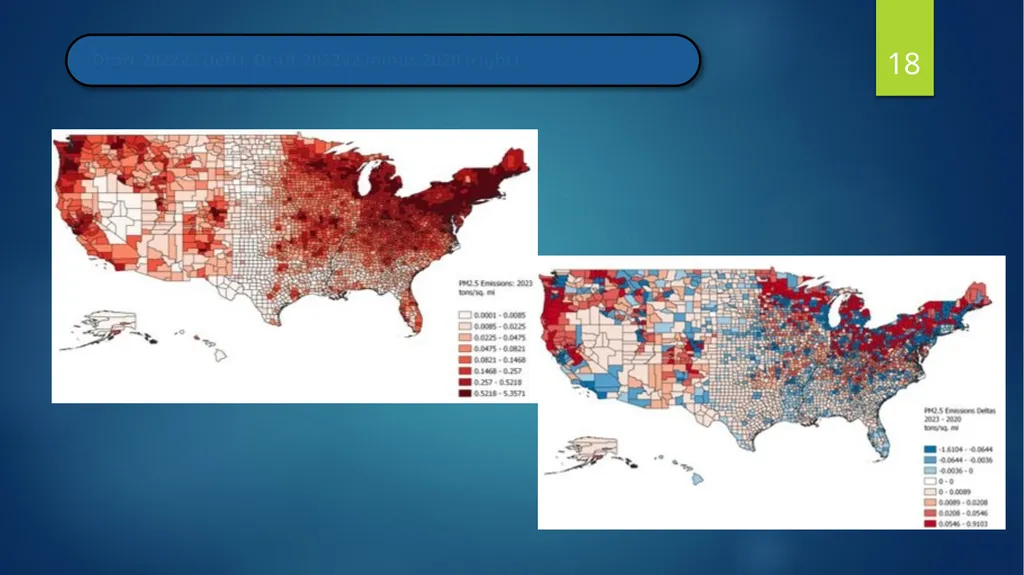
18<br>
19
19 Questions/Discussion<br>
20
Appendix 20<br>
21
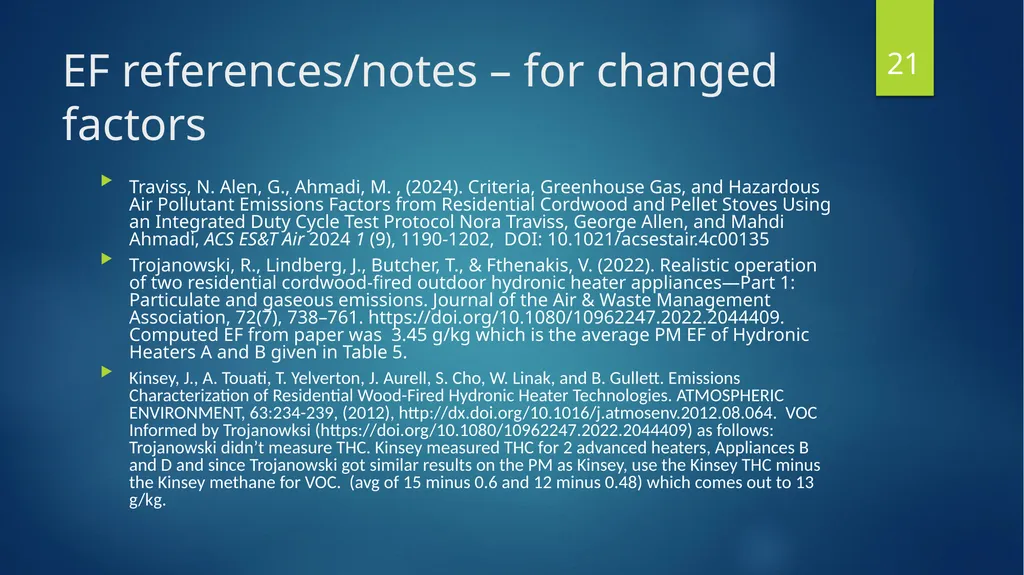
EF references/notes – for changed factors Traviss, N. Alen, G., Ahmadi, M. , (2024). Criteria, Greenhouse Gas, and Hazardous Air Pollutant Emissions Factors from Residential Cordwood and Pellet Stoves Using an Integrated Duty Cycle Test Protocol Nora Traviss, George Allen, and Mahdi Ahmadi, ACS ES&T Air 2024 1 (9), 1190-1202, DOI: 10.1021/acsestair.4c00135
Trojanowski, R., Lindberg, J., Butcher, T., & Fthenakis, V. (2022). Realistic operation of two residential cordwood-fired outdoor hydronic heater appliances—Part 1: Particulate and gaseous emissions. Journal of the Air & Waste Management Association, 72(7), 738–761. https://doi.org/10.1080/10962247.2022.2044409. Computed EF from paper was 3.45 g/kg which is the average PM EF of Hydronic Heaters A and B given in Table 5.
Kinsey, J., A. Touati, T. Yelverton, J. Aurell, S. Cho, W. Linak, and B. Gullett. Emissions Characterization of Residential Wood-Fired Hydronic Heater Technologies. ATMOSPHERIC ENVIRONMENT, 63:234-239, (2012), http://dx.doi.org/10.1016/j.atmosenv.2012.08.064. VOC Informed by Trojanowksi (https://doi.org/10.1080/10962247.2022.2044409) as follows: Trojanowski didn’t measure THC. Kinsey measured THC for 2 advanced heaters, Appliances B and D and since Trojanowski got similar results on the PM as Kinsey, use the Kinsey THC minus the Kinsey methane for VOC. (avg of 15 minus 0.6 and 12 minus 0.48) which comes out to 13 g/kg. 21<br>
Trojanowski, R., Lindberg, J., Butcher, T., & Fthenakis, V. (2022). Realistic operation of two residential cordwood-fired outdoor hydronic heater appliances—Part 1: Particulate and gaseous emissions. Journal of the Air & Waste Management Association, 72(7), 738–761. https://doi.org/10.1080/10962247.2022.2044409. Computed EF from paper was 3.45 g/kg which is the average PM EF of Hydronic Heaters A and B given in Table 5.
Kinsey, J., A. Touati, T. Yelverton, J. Aurell, S. Cho, W. Linak, and B. Gullett. Emissions Characterization of Residential Wood-Fired Hydronic Heater Technologies. ATMOSPHERIC ENVIRONMENT, 63:234-239, (2012), http://dx.doi.org/10.1016/j.atmosenv.2012.08.064. VOC Informed by Trojanowksi (https://doi.org/10.1080/10962247.2022.2044409) as follows: Trojanowski didn’t measure THC. Kinsey measured THC for 2 advanced heaters, Appliances B and D and since Trojanowski got similar results on the PM as Kinsey, use the Kinsey THC minus the Kinsey methane for VOC. (avg of 15 minus 0.6 and 12 minus 0.48) which comes out to 13 g/kg. 21<br>
22
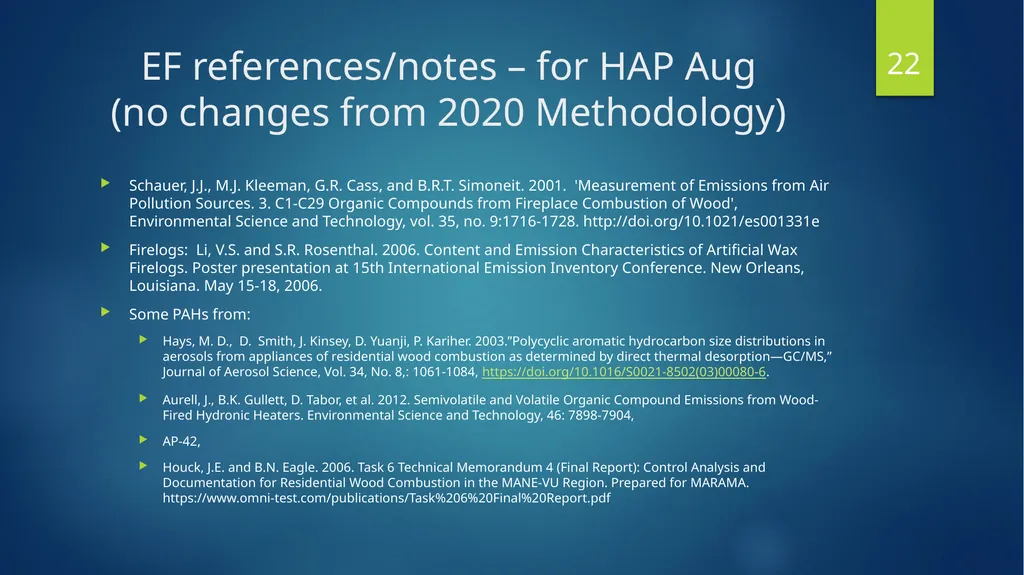
EF references/notes – for HAP Aug
(no changes from 2020 Methodology) Schauer, J.J., M.J. Kleeman, G.R. Cass, and B.R.T. Simoneit. 2001. 'Measurement of Emissions from Air Pollution Sources. 3. C1-C29 Organic Compounds from Fireplace Combustion of Wood', Environmental Science and Technology, vol. 35, no. 9:1716-1728. http://doi.org/10.1021/es001331e
Firelogs: Li, V.S. and S.R. Rosenthal. 2006. Content and Emission Characteristics of Artificial Wax Firelogs. Poster presentation at 15th International Emission Inventory Conference. New Orleans, Louisiana. May 15-18, 2006.
Some PAHs from:
Hays, M. D., D. Smith, J. Kinsey, D. Yuanji, P. Kariher. 2003.”Polycyclic aromatic hydrocarbon size distributions in aerosols from appliances of residential wood combustion as determined by direct thermal desorption—GC/MS,” Journal of Aerosol Science, Vol. 34, No. 8,: 1061-1084, https://doi.org/10.1016/S0021-8502(03)00080-6.
Aurell, J., B.K. Gullett, D. Tabor, et al. 2012. Semivolatile and Volatile Organic Compound Emissions from Wood-Fired Hydronic Heaters. Environmental Science and Technology, 46: 7898-7904,
AP-42,
Houck, J.E. and B.N. Eagle. 2006. Task 6 Technical Memorandum 4 (Final Report): Control Analysis and Documentation for Residential Wood Combustion in the MANE-VU Region. Prepared for MARAMA. https://www.omni-test.com/publications/Task%206%20Final%20Report.pdf 22<br>
Firelogs: Li, V.S. and S.R. Rosenthal. 2006. Content and Emission Characteristics of Artificial Wax Firelogs. Poster presentation at 15th International Emission Inventory Conference. New Orleans, Louisiana. May 15-18, 2006.
Some PAHs from:
Hays, M. D., D. Smith, J. Kinsey, D. Yuanji, P. Kariher. 2003.”Polycyclic aromatic hydrocarbon size distributions in aerosols from appliances of residential wood combustion as determined by direct thermal desorption—GC/MS,” Journal of Aerosol Science, Vol. 34, No. 8,: 1061-1084, https://doi.org/10.1016/S0021-8502(03)00080-6.
Aurell, J., B.K. Gullett, D. Tabor, et al. 2012. Semivolatile and Volatile Organic Compound Emissions from Wood-Fired Hydronic Heaters. Environmental Science and Technology, 46: 7898-7904,
AP-42,
Houck, J.E. and B.N. Eagle. 2006. Task 6 Technical Memorandum 4 (Final Report): Control Analysis and Documentation for Residential Wood Combustion in the MANE-VU Region. Prepared for MARAMA. https://www.omni-test.com/publications/Task%206%20Final%20Report.pdf 22<br>
23
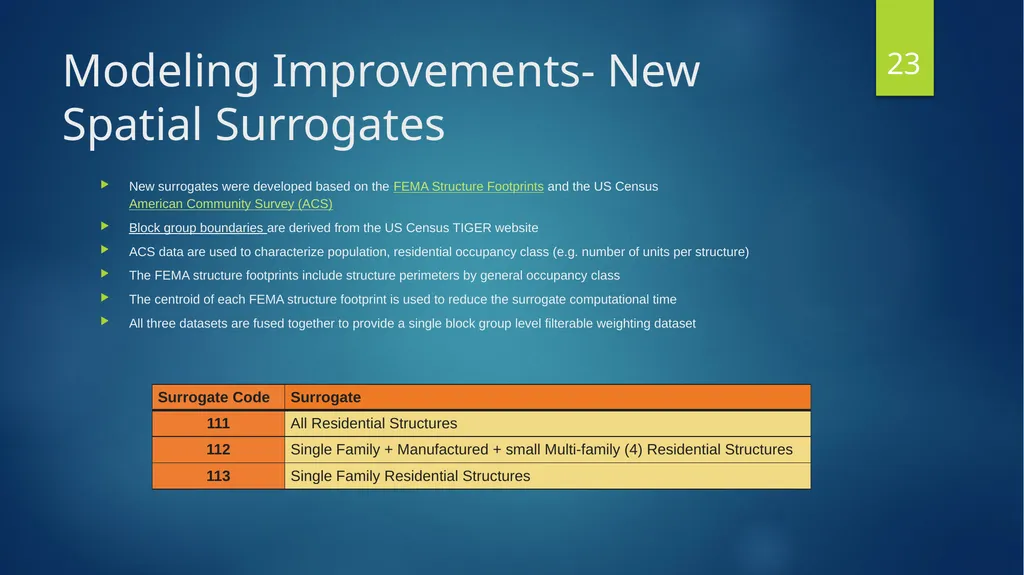
Modeling Improvements- New Spatial Surrogates New surrogates were developed based on the FEMA Structure Footprints and the US Census American Community Survey (ACS)
Block group boundaries are derived from the US Census TIGER website
ACS data are used to characterize population, residential occupancy class (e.g. number of units per structure)
The FEMA structure footprints include structure perimeters by general occupancy class
The centroid of each FEMA structure footprint is used to reduce the surrogate computational time
All three datasets are fused together to provide a single block group level filterable weighting dataset 23<br>
Block group boundaries are derived from the US Census TIGER website
ACS data are used to characterize population, residential occupancy class (e.g. number of units per structure)
The FEMA structure footprints include structure perimeters by general occupancy class
The centroid of each FEMA structure footprint is used to reduce the surrogate computational time
All three datasets are fused together to provide a single block group level filterable weighting dataset 23<br>
24
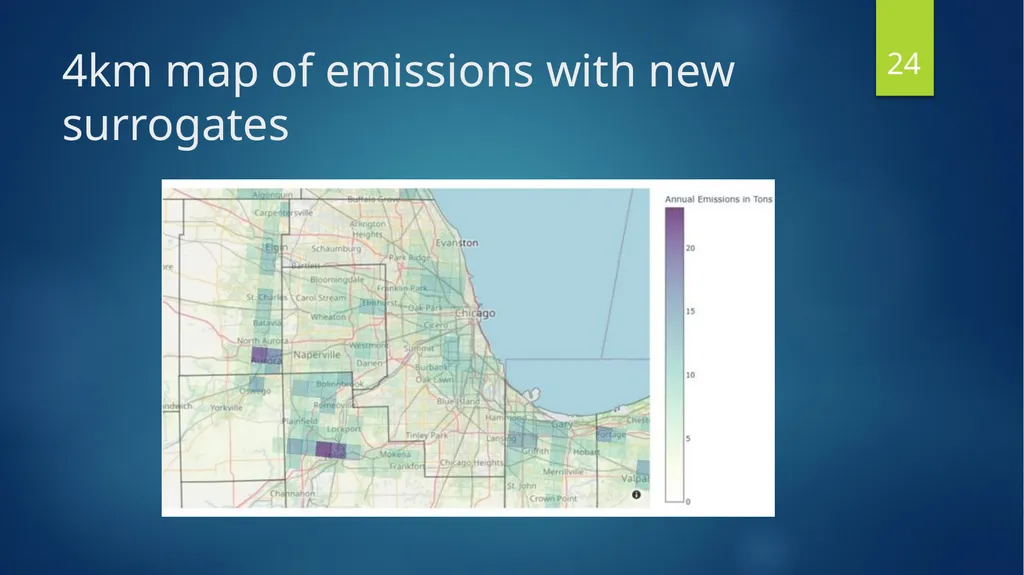
4km map of emissions with new surrogates 24<br>