/
Contribution of Improved Spatial Allocation of Emissions to Reducing Urban Contribution of Improved Spatial Allocation of Emissions to Reducing Urban

Contribution of Improved Spatial Allocation of Emissions to Reducing Urban - PowerPoint Presentation

danika-pritchard
danika-pritchard . @danika-pritchard
Follow
376 views
Uploaded On 2019-02-07

Contribution of Improved Spatial Allocation of Emissions to Reducing Urban - PPT Presentation

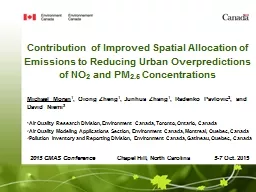
Overpredictions of NO 2 and PM 25 Concentrations Michael Moran 1 Qiong Zheng 1 Junhua Zhang 1 Radenko Pavlovic 2 and David Niemi 3 1 Air Quality Research Division Environment Canada Toronto Ontario Canada ID: 750868

dwelling emissions density surrogate emissions dwelling surrogate density spatial total source pm2 urban rwc wood toronto capped residential canada

Share:

Link:

Embed:

Download Presentation from below link

Download Presentation The PPT/PDF document "Contribution of Improved Spatial Allocat..." is the property of its rightful owner. Permission is granted to download and print the materials on this web site for personal, non-commercial use only, and to display it on your personal computer provided you do not modify the materials and that you retain all copyright notices contained in the materials. By downloading content from our website, you accept the terms of this agreement.


Presentation Transcript

Slide1

Contribution of Improved Spatial Allocation of Emissions to Reducing Urban Overpredictions of NO2 and PM2.5 ConcentrationsMichael Moran1, Qiong Zheng1, Junhua Zhang1, Radenko Pavlovic2, and David Niemi31Air Quality Research Division, Environment Canada, Toronto, Ontario, Canada 2Air Quality Modeling Applications Section, Environment Canada, Montreal, Quebec, Canada3Pollution Inventory and Reporting Division, Environment Canada, Gatineau, Quebec, Canada

2015

CMAS Conference

Chapel

Hill, North Carolina

5-7

Oct.

2015Slide2

Motivation

The primary concern of air quality forecasting is episodes of poor air qualityAQ forecasters want to minimize “false alarms”, that is, forecasts of poor air quality that do not actually happen Environment Canada (EC) runs an in-line meteorology/chemistry model (GEM-MACH) operationally to produce twice-daily, continental-scale, 48-hour forecasts of O3, NO2, PM2.5, and Air Quality Health Index.Until recently, one weakness of GEM-MACH forecasts has been a tendency to episodic overpredictions of NO2 and PM2.5 concentrations over some Canadian cities, especially in the wintertime. Slide3

Vancouver PM2.5

Concentrations (ug m-3), Jan.-Feb. 2014: Observed, Forecast, and Adjusted (UMOS-AQ/MIST)WINTERSlide4

Vancouver PM2.5 Concentrations (

ug m-3), July-Aug. 2014: Observed, Forecast, and Adjusted (UMOS-AQ/MIST)SUMMERSlide5

Approach (1)

Overpredictions of primary pollutant concentrations may be caused by multiple factors, including :Underestimation of vertical mixing or ventilation (e.g., neglect of urban heat island effects);Underestimation of subgrid-scale removal (e.g., near-source impaction);Overestimation of emissionsRecurring overpredictions associated with urban areas might be due to the spatial overallocation of some emissions categories to those areas associated with the use of unsuitable spatial surrogate fieldsSlide6

Approach (2)

Possible problematic emissions categories and hence problematic spatial surrogates can be identified by several approaches, including:Identifying the major contributing source categories for selected urban areas (e.g., using SMKREPORT);Plotting emissions spatial distributions for primary source sectors;Examining predicted PM chemical composition and, where possible, comparing with measured PM chemical composition.Slide7

Example: Use SMKREPORT to Analyze

GEM-MACH15 Emissions for

a 4x4

Toronto Subdomain

to Identify

the Top NOx and PM2.5 Source CategoriesSlide8

Top 10 PM2.5 Surface Source Sectors in Toronto GEM-MACH15 4x4 Subdomain from SMKREPORT for SET1 Emissions (total 7,133 tons/y)

Source

SCC

Primary Surrogate

SCC Description

PM2.5 [tons/year]

PM2.5 percent (%)

oarea

2810025000

101

Miscellaneous Area

Sources;Other

Combustion;Charcoal

Grilling - Residential (see 23-02-002-xxx for Commercial);Total

1,031

14.5

oarea

2305070000

327

Industrial

Processes;Mineral

Processes: SIC 32;Concrete- Gypsum- Plaster

Products;Total

785

11.0

oarea

2303020000

331

Industrial

Processes;Primary

Metal Production: SIC 33;Iron and Steel

Foundries;Total

507

7.1

oarea

2104008051

950

Stationary Source Fuel

Combustion;Residential;Wood;Non-catalytic

Woodstoves: Conventional

473

6.6

offroad

2270005015

115

Mobile

Sources;Off-highway

Vehicle

Diesel;Agricultural

Equipment;Agricultural

Tractors

419

5.9

adust

2294000000

994

Mobile

Sources;Paved

Roads;All

Paved

Roads;Total

: Fugitives

416

5.8

oarea

2104006000

101

Stationary Source Fuel

Combustion;Residential;Natural

Gas;Total

: All Combustor Types

355

5.0

oarea

2103006000

921

Stationary Source Fuel

Combustion;Commercial

/

Institutional;Natural

Gas;Total

: Boilers and IC Engines

336

4.7

onroad

2230070000

992

Mobile

Sources;Highway

Vehicles -

Diesel;All

HDDV including Buses (use subdivisions -071 thru -075 if possible);Total: All Road Types

292

4.1

oarea

2306010000

324

Industrial

Processes;Petroleum

Refining: SIC 29;Asphalt Paving/Roofing

Materials;Total

250

3.5Slide9

offroad

o

ffroad_T4

oarea

onroad

major

minor

Zoom

Over

Montreal and Ottawa (SET2.1.1):

NO

2

January

Emissions By Source SectorSlide10

adust

offroad

o

ffroad_T4

oarea

onroad

major

minor

Zoom

Over

Montreal and Ottawa:

PM

2.5

January

Emissions By Source Sector (

SET2.1.1)Slide11

Time Series Of Bulk PM

2.5 Mass (µg M-3) And Chemical Components: Toronto, Nov. 18-25, 2009

BC, POM

C

M

SU, AM

NI, SOM

GEM-MACH

Measurements

Slide12

(a)

(b)Unavoidable fact of life: Canadian emissions are only available by province or territory whereas U.S. emissions are available by countyUnavoidable implication: the spatial allocation of Canadian emissions is more challenging than of U.S. emissions and spatial surrogates must play a more important role10 provinces, 3 territories

3,143 counties

& equivalentsSlide13

Approach (3)

Urban-centred analyses of emissions identified the following emissions categories as top emitters of NOx and/or PM2.5 in Canadian urban areas:On-road sources;Residential wood combustion;Residential meat cooking;Offroad T4;Paved road dustSpatial surrogates for Canada for each of these source categories were reviewed and new surrogates were developed for four of them as well as other source types based on the 2011 Canadian census and other data sets (note: 2011 census considers 56,204 neighbourhoods)Slide14

Issue: The use of some common spatial surrogates such as population or dwelling density may not be appropriate in high-density urban centres for many source types such as local traffic, residential wood combustion (RWC), residential meat-cooking (BBQs), and lawnmowers that have other constraints such as road geometry or the absence of fireplaces, patios, or lawns, respectively. At the same time, horizontal grid sizes of 4, 2, and even 1 km are now being employed that can resolve such centres. One Solution: Impose either an upper limit (“cap”) or a “zero out” on high population density or dwelling density as part of calculation of selected spatial surrogate fields. Scale Dependence of Spatial Surrogates

for

Higher-Resolution

Model

GridsSlide15

Example 1: Total Dwelling Density Is Used As Spatial Surrogate to Allocate Emissions from Residential Meat Cooking (BBQ’ing) in Toronto, OntarioFind the BBQsSlide16

A

D

C

B

(

Left

) Usual-resident-occupied dwelling

counts

at neighbourhood level (i.e., dissemination area [DA]) for Toronto from 2011 Canadian census

(

Right

) Usual-resident-occupied dwelling

density

(number of dwellings km

-2

) by DA for Toronto from 2011 Canadian censusSlide17

A

D

C

B

(

Left

) Version 1 of

capped

2011 occupied dwelling counts by DA for Toronto. For those DAs with dwelling density > 600 dwellings km

-2

, cap the density at 600, and then recalculate the DA dwelling counts.

(

Right

) Version 2 of

capped

2011 occupied dwelling counts by DA for Toronto. For those DAs with dwelling density > 3000 dwellings km

-2

, set the dwelling counts to zero, for those DAs with dwelling density between 600 and 3000, cap the density at 600, and then recalculate the DA dwelling counts.Slide18

SRG_101_total_dwelling

SRG_104_capped_total_dwelling

3 Versions of Surrogate (@ 2.5 km) Based on Total Dwelling Density in Toronto Region: Uncapped, V1 Capped, V2 Capped

SRG_105_capped_total_dwelling_meat_cookingSlide19

SRG_104-101_ratio

SRG_104-105_ratio

Ratios of (

left

) V1 Capped Total Dwelling Density Surrogate to Uncapped Total Dwelling Density Surrogate and (

right

) V1 Capped Total Dwelling Density Surrogate to V2 Capped Total Dwelling Density Surrogate over the Toronto RegionSlide20

Differences between surrogate 104

(capped occupied total dwellings) and surrogate 101 (occupied total dwellings) over southern B.C. and Alberta on GEM-MACH15 grid.Slide21

Issue Example 2: Population density is used as spatial surrogate to allocate emissions from

local traffic, but traffic emissions are inversely related to population density above 2000 person km-2 (Gately et al., 2013, ES&T, 47, 2423-2430)  Can apply cap and/or zero-out to population density fieldSlide22

Differences between surrogate 107 for urban local

mobile emissions after and before the population density cap was applied over southern Ontario and Quebec on the GEM-MACH15 model grid.Slide23

Old Residential Wood Combustion Surrogate

 Residential wood combustion (RWC) is a very important source of PM2.5 in Canada in the wintertime but the spatial allocation of RWC emissions has been problematic. In particular the allocation of RWC emissions to urban areas has seemed too high, The old spatial surrogate used to grid province-level RWC emissions was an “intersection” surrogate based on the product of a forest-cover surrogate and a dwelling density surrogate. This surrogate assumes implicitly that urban and rural households burn the same amount of wood, which is contradicted by many surveys of fuel use. As well, this surrogate is

not directly

related to wood consumption statistics.

 Slide24

“Recipe” for New RWC Spatial Surrogate (1)

 The 2011 Statistics Canada Households and the Environment Survey (HES) and its accompanying Energy Use Supplement (EUS) provide data on household wood consumption at the provincial level but also for 28 Census Metropolitan Areas (CMAs) across Canada (11 located in Ontario, 6 in Quebec, 3 in B.C., 2 in Alberta, 2 in Saskatchewan, and one in each of Newfoundland, Nova Scotia, New Brunswick, and Manitoba). These new data about sub-provincial wood consumption give a coarse spatial distribution of provincial RWC emissions between individual CMAs and “the rest of their province”. To build a province-level spatial surrogate a second step is then performed to determine a finer distribution of wood consumption at the DA level within each CMA and across “the rest of their province” Slide25

“Recipe” for New RWC Spatial Surrogate (2) The new provincial RWC surrogates are calculated based on the following assumptions:(1) Rural households (as represented by dwellings) will burn more wood on average than urban households ( rural DAs have higher weighting);(2) RWC is unlikely to occur in high-density, multi-storey, multiple-unit buildings ( use capped and zeroed-out dwelling density);(3) Households located within or close to forests are more likely to burn wood than households located in prairie or agricultural locations ( higher weighting based on proximity to forests);

Use of

RWC for space heating will be higher in colder

locations (

 accounted for using a simple latitude dependence)

Households

in small population

centres

(PCs: population < 30,000) are more likely to burn wood than those located in medium or large

PCs

Simple weighting factors are used to account for each of the above assumptions.Slide26

Differences Between New And Old RWC

Provincial Surrogates: (left) National View; (right) Zoom over Ontario and QuebecSlide27

Time

Series of Observed and GEM-MACH Predicted PM2.5 Concentrations for Jan.-Feb. 2014 for Vancouver and Ottawa Using Original (OPS) and Upgraded (SET2.1.1) EmissionsObservedGM-OPSGM avec SET2.1.1

Observed

GM-OPS

GM avec SET2.1.1

VANCOUVER

OTTAWASlide28

Time

Series of Observed and Predicted NO2, O3, and PM2.5 Concentrations for Halifax, Nova Scotia for Spring 2015ObservedOPSPAR

NO

2

PM

2.5

O

3Slide29

Conclusions

Analysis of gridded model emissions in Canadian urban areas suggested that primary pollutants such as NO2 and PM2.5 were being overallocated to these areas.Some new Canadian spatial surrogates have been developed for important source categories such as local traffic and RWC that reduce the allocation of emissions to urban areas.GEM-MACH model runs using emissions based on the new Canadian spatial surrogates have shown improved performance. Slide30

Thank you for your attention