
Sampling Trees: A Strategic Sampling and Analysis
TF
Published · 20 slides · 0 views
1 / 1


Description
Sampling Trees: A Strategic Sampling and Analysis Tool Dave Sartori, PPG sartorippg.com 2020 Discovery Summit PPG: 47,000 Global Employees Protecting and Beautifying Our World A leader in all our markets: construction, consumer products,
Related Topics
Share
Embed code
Download this presentation From Below
"Sampling Trees: A Strategic Sampling and Analysis" is the property of its rightful owner. Permission is granted to download and print the materials on this website for personal, non-commercial use only, and to display it on your personal computer provided you do not modify the materials and that you retain all copyright notices contained in the materials. By downloading content from our website, you accept the terms of this agreement.
Presentation Transcript
01
Sampling Trees: A Strategic Sampling and Analysis Tool Dave Sartori, PPG
sartori@ppg.com 2020 Discovery Summit<br>
sartori@ppg.com 2020 Discovery Summit<br>
02
PPG: 47,000 Global Employees
Protecting and Beautifying Our World A leader in all
our markets: construction, consumer products, industrial and transportation markets and aftermarkets. Headquartered
in Pittsburgh, Pennsylvania, with operations in more than 70 countries. Founded in 1883 Fortune 500: Ranked 180
Named to Fortune’s World’s Most Admired Company’s List (2019) A global maker of paints, coatings, and specialty materials 2020 Discovery Summit<br>
Named to Fortune’s World’s Most Admired Company’s List (2019) A global maker of paints, coatings, and specialty materials 2020 Discovery Summit<br>
03
Performance Coatings
Aerospace
Architectural Coatings – Americas & Asia Pacific
Architectural Coatings – EMEA (Europe, Middle East, Africa)
Automotive Refinish Coatings
Protective & Marine Coatings Industrial Coatings
Automotive OEM Coatings
Industrial Coatings
Packaging Coatings
Specialty Coatings & Materials
Coatings Services PPG: Two product segments drive our business 3 59% 41% 2020 Discovery Summit<br>
Aerospace
Architectural Coatings – Americas & Asia Pacific
Architectural Coatings – EMEA (Europe, Middle East, Africa)
Automotive Refinish Coatings
Protective & Marine Coatings Industrial Coatings
Automotive OEM Coatings
Industrial Coatings
Packaging Coatings
Specialty Coatings & Materials
Coatings Services PPG: Two product segments drive our business 3 59% 41% 2020 Discovery Summit<br>
04
Sampling Trees: An Overall Description A Sampling Tree is a simple graphical depiction of the data in a prospective sampling plan or one for which data has already been collected
In variation studies such as Gage R&Rs, general measurement system evaluations, or components of variance studies, the sampling tree can be a great tool for facilitating strategic thinking about:
What sources of process variance can or should be included?
How many levels within each factor or source of variation should be included?
How many measurements to take for each combination of factors and settings?
Strategically considering these questions before collecting any data helps define the limitations of the study, what can be learned from it, and what the overall effort to execute it will be 2020 Discovery Summit 4<br>
In variation studies such as Gage R&Rs, general measurement system evaluations, or components of variance studies, the sampling tree can be a great tool for facilitating strategic thinking about:
What sources of process variance can or should be included?
How many levels within each factor or source of variation should be included?
How many measurements to take for each combination of factors and settings?
Strategically considering these questions before collecting any data helps define the limitations of the study, what can be learned from it, and what the overall effort to execute it will be 2020 Discovery Summit 4<br>
05
Sampling Trees: An Overall Description The Sampling Tree is also useful for understanding the structure of factorial type designed experiments, especially if there are restrictions on randomization
“Lines of Restriction” on the sample tree can be used to indicate were the whole plots and split plots occur relative to the factors in the study and thus provide a better understanding of the error structure in the data
Sampling Trees have also been used when factorial designs are combined with variation studies such as COVs or MSEs
Such designs accelerate learning in parallel about factors thought to influence the mean and those related to variation in measuring responses 2020 Discovery Summit 5<br>
“Lines of Restriction” on the sample tree can be used to indicate were the whole plots and split plots occur relative to the factors in the study and thus provide a better understanding of the error structure in the data
Sampling Trees have also been used when factorial designs are combined with variation studies such as COVs or MSEs
Such designs accelerate learning in parallel about factors thought to influence the mean and those related to variation in measuring responses 2020 Discovery Summit 5<br>
06
Uses in Analysis of Data Once data is acquired, Sampling Trees can facilitate analysis of this data.
This is especially true for components of variance or measurement system evaluations
Inspection of the sampling tree facilitates selecting the correct variance component model in JMP®: Crossed, Nested, Nested then Crossed, or Crossed then Nested
Sampling Trees for control chart data aid in the interpretation of the Xbar and Range charts by making it clear what is varying within subgroup.
They are less useful for analysis of data from factorial type experiments
But they can be used to show lines of restriction in split-plot experiments and the relationship between factors when factorial designs are combined with variation studies 2020 Discovery Summit 6<br>
This is especially true for components of variance or measurement system evaluations
Inspection of the sampling tree facilitates selecting the correct variance component model in JMP®: Crossed, Nested, Nested then Crossed, or Crossed then Nested
Sampling Trees for control chart data aid in the interpretation of the Xbar and Range charts by making it clear what is varying within subgroup.
They are less useful for analysis of data from factorial type experiments
But they can be used to show lines of restriction in split-plot experiments and the relationship between factors when factorial designs are combined with variation studies 2020 Discovery Summit 6<br>
07
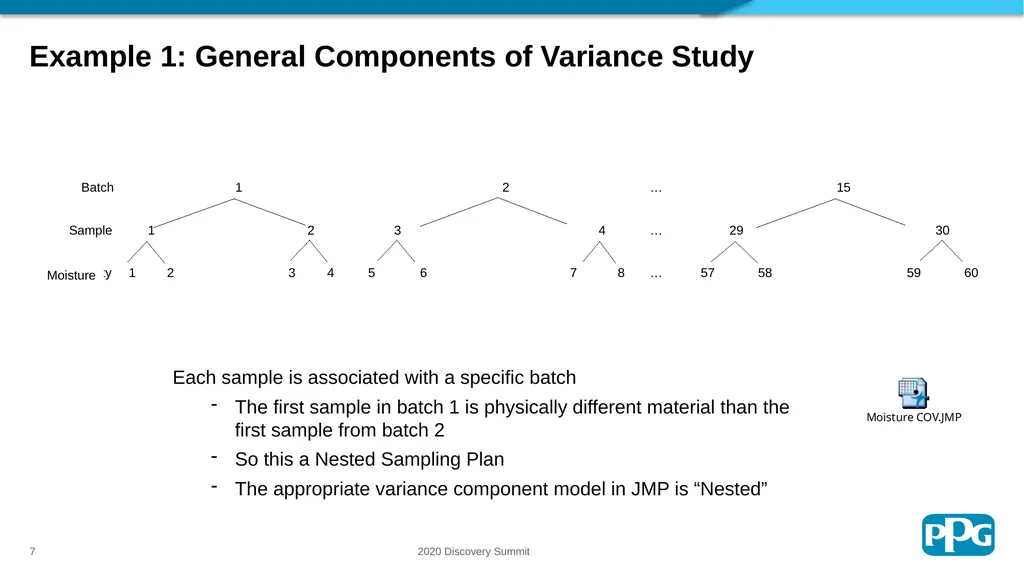
Example 1: General Components of Variance Study Each sample is associated with a specific batch
The first sample in batch 1 is physically different material than the first sample from batch 2
So this a Nested Sampling Plan
The appropriate variance component model in JMP is “Nested” 2020 Discovery Summit 7 Moisture<br>
The first sample in batch 1 is physically different material than the first sample from batch 2
So this a Nested Sampling Plan
The appropriate variance component model in JMP is “Nested” 2020 Discovery Summit 7 Moisture<br>
08
Example 1: General Components of Variance Study:
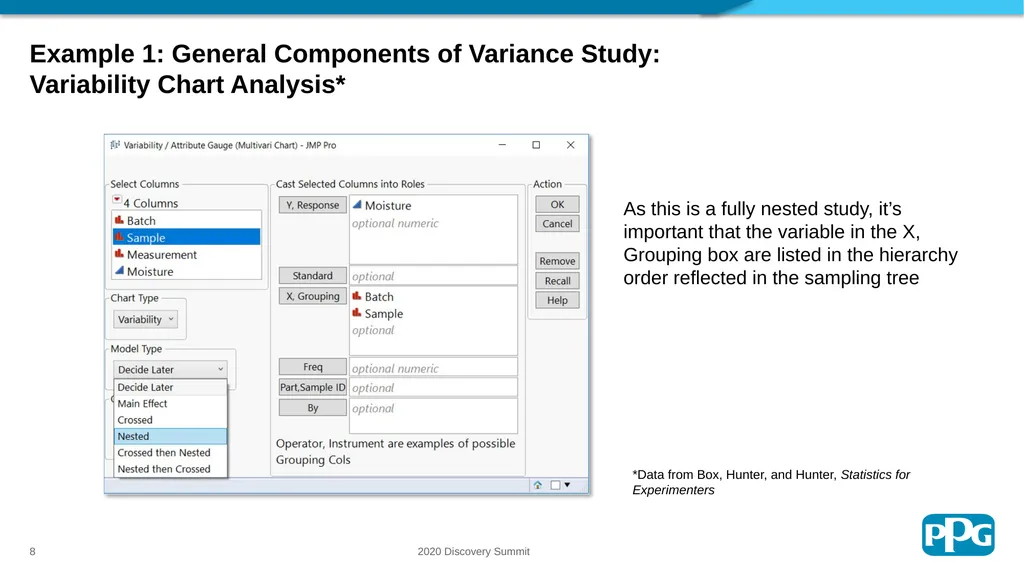
Variability Chart Analysis* As this is a fully nested study, it’s important that the variable in the X, Grouping box are listed in the hierarchy order reflected in the sampling tree *Data from Box, Hunter, and Hunter, Statistics for Experimenters 2020 Discovery Summit 8<br>
09
Example 1: General Components of Variance Study:
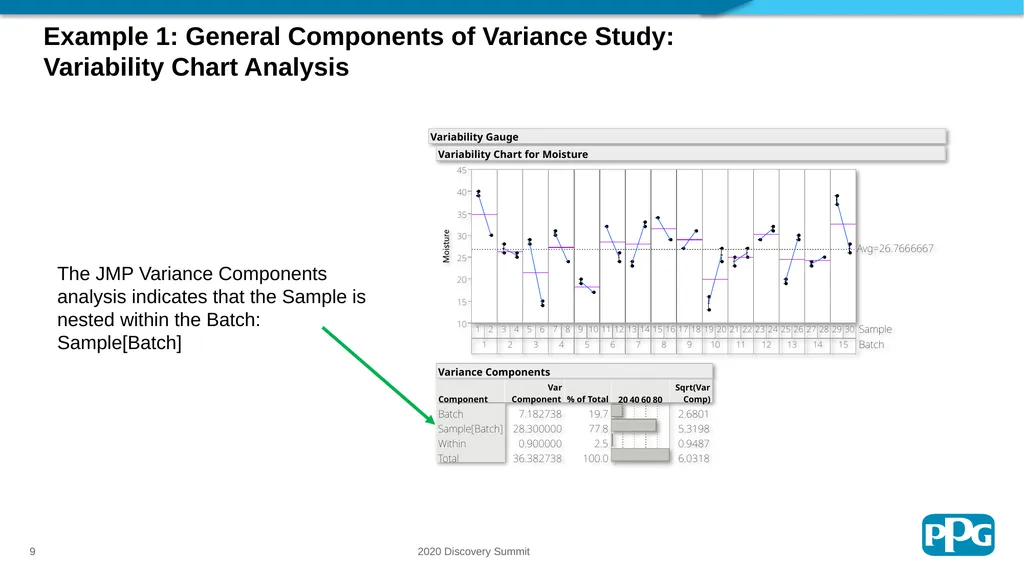
Variability Chart Analysis The JMP Variance Components analysis indicates that the Sample is nested within the Batch: Sample[Batch] 2020 Discovery Summit 9<br>
10
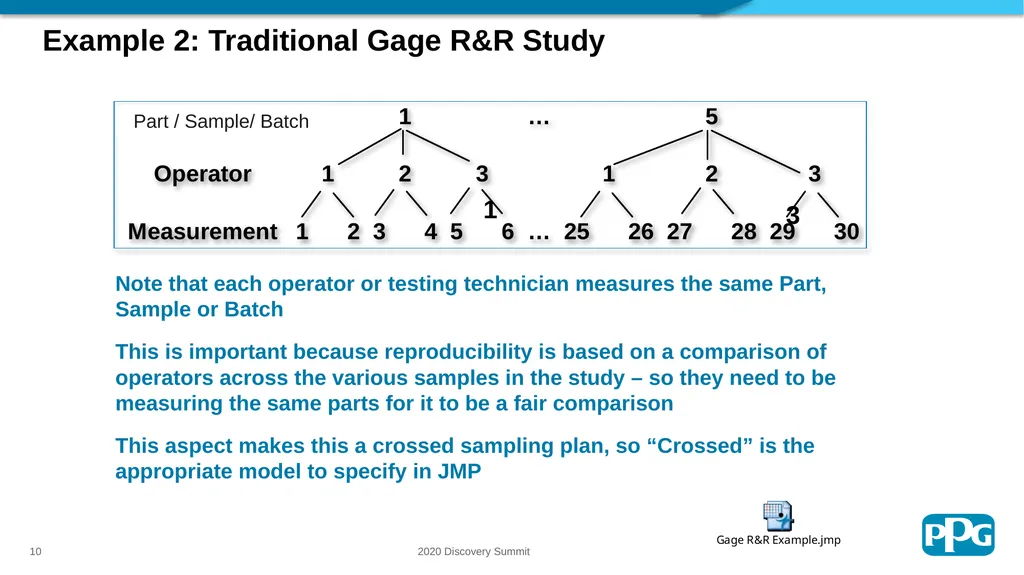
Example 2: Traditional Gage R&R Study Note that each operator or testing technician measures the same Part, Sample or Batch
This is important because reproducibility is based on a comparison of operators across the various samples in the study – so they need to be measuring the same parts for it to be a fair comparison
This aspect makes this a crossed sampling plan, so “Crossed” is the appropriate model to specify in JMP 1 3 Part / Sample/ Batch 2020 Discovery Summit 10<br>
This is important because reproducibility is based on a comparison of operators across the various samples in the study – so they need to be measuring the same parts for it to be a fair comparison
This aspect makes this a crossed sampling plan, so “Crossed” is the appropriate model to specify in JMP 1 3 Part / Sample/ Batch 2020 Discovery Summit 10<br>
11
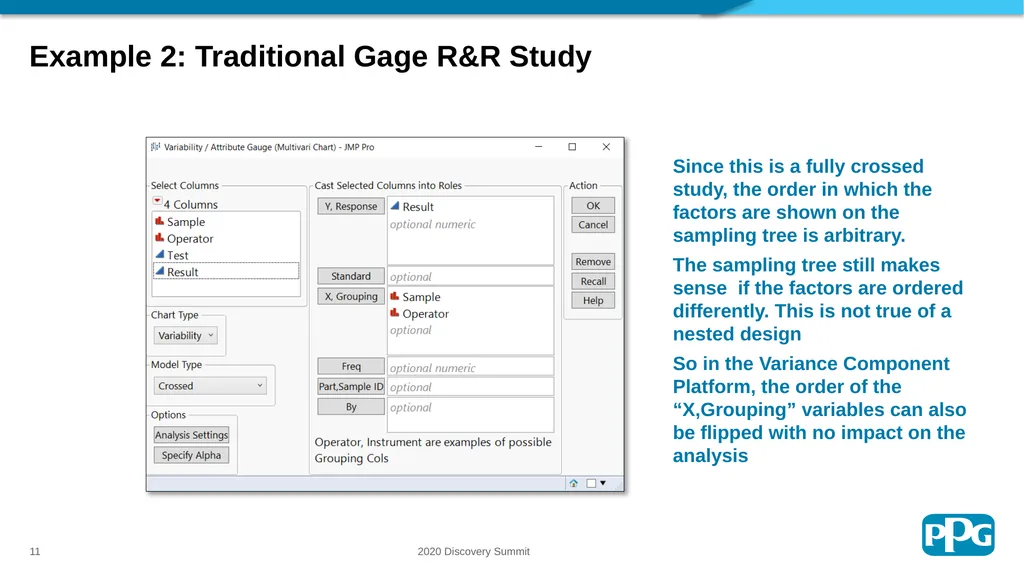
Example 2: Traditional Gage R&R Study Since this is a fully crossed study, the order in which the factors are shown on the sampling tree is arbitrary.
The sampling tree still makes sense if the factors are ordered differently. This is not true of a nested design
So in the Variance Component Platform, the order of the “X,Grouping” variables can also be flipped with no impact on the analysis 2020 Discovery Summit 11<br>
The sampling tree still makes sense if the factors are ordered differently. This is not true of a nested design
So in the Variance Component Platform, the order of the “X,Grouping” variables can also be flipped with no impact on the analysis 2020 Discovery Summit 11<br>
12
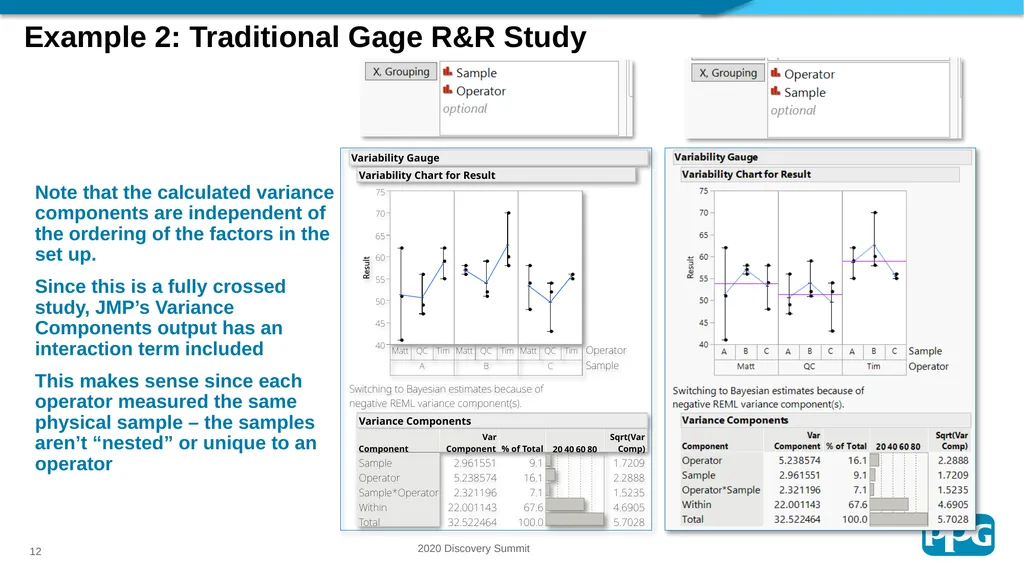
Example 2: Traditional Gage R&R Study Note that the calculated variance components are independent of the ordering of the factors in the set up.
Since this is a fully crossed study, JMP’s Variance Components output has an interaction term included
This makes sense since each operator measured the same physical sample – the samples aren’t “nested” or unique to an operator 2020 Discovery Summit 12<br>
Since this is a fully crossed study, JMP’s Variance Components output has an interaction term included
This makes sense since each operator measured the same physical sample – the samples aren’t “nested” or unique to an operator 2020 Discovery Summit 12<br>
13
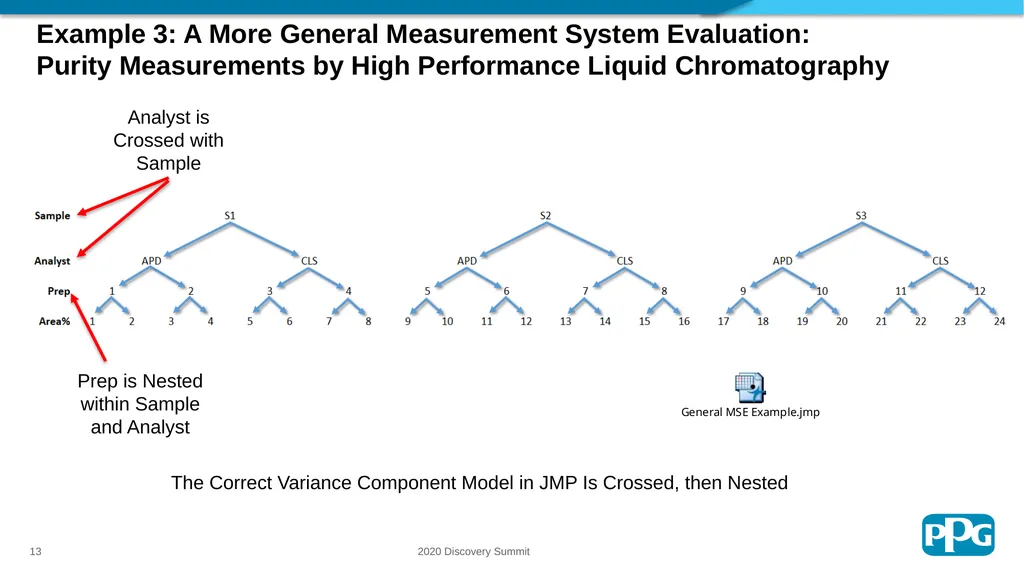
Example 3: A More General Measurement System Evaluation:
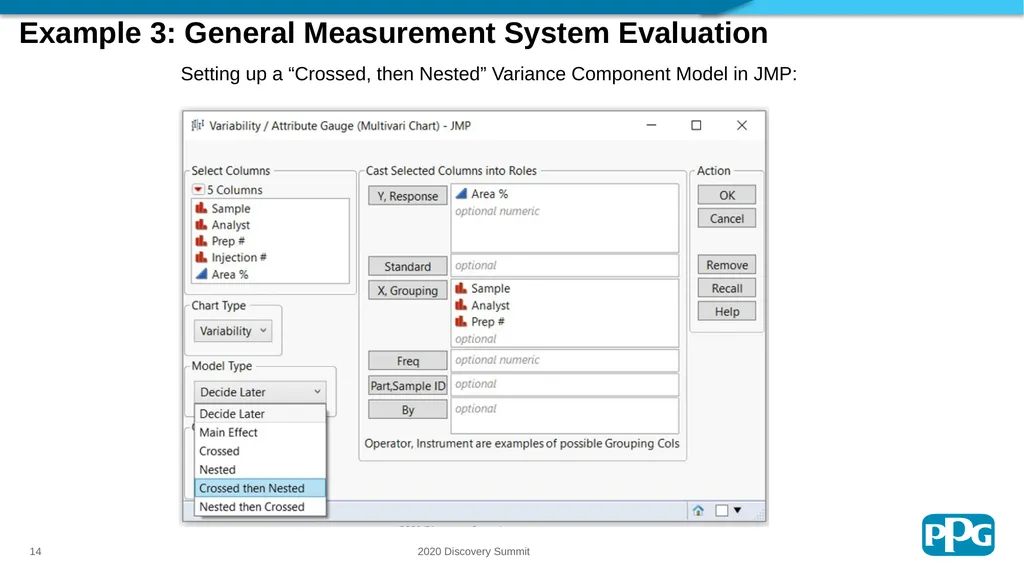
Purity Measurements by High Performance Liquid Chromatography Analyst is Crossed with Sample Prep is Nested within Sample and Analyst The Correct Variance Component Model in JMP Is Crossed, then Nested 2020 Discovery Summit 13<br>
14
Example 3: General Measurement System Evaluation Setting up a “Crossed, then Nested” Variance Component Model in JMP: 2020 Discovery Summit 14<br>
15
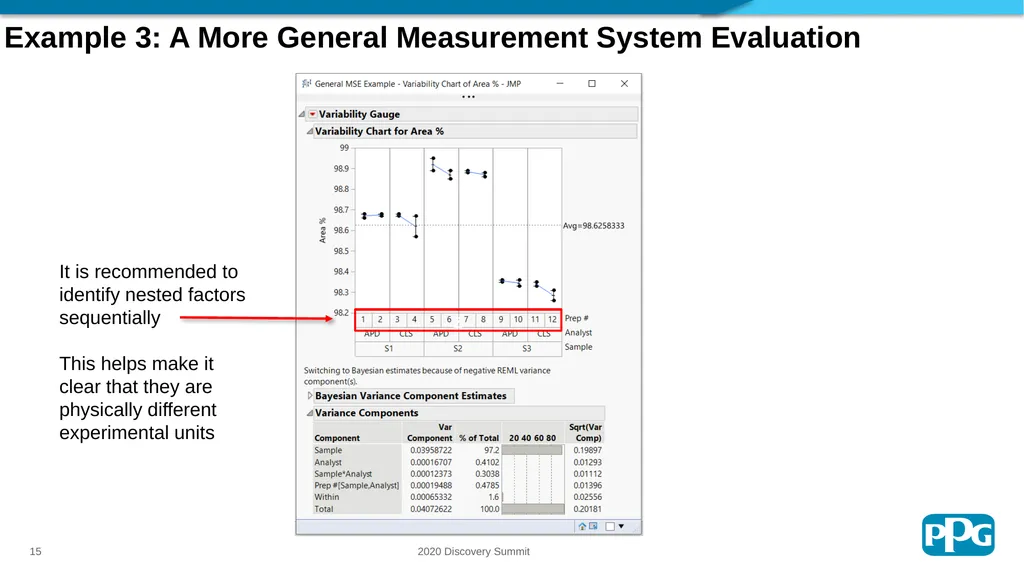
Example 3: A More General Measurement System Evaluation It is recommended to identify nested factors sequentially
This helps make it clear that they are physically different experimental units z 2020 Discovery Summit 15<br>
This helps make it clear that they are physically different experimental units z 2020 Discovery Summit 15<br>
16
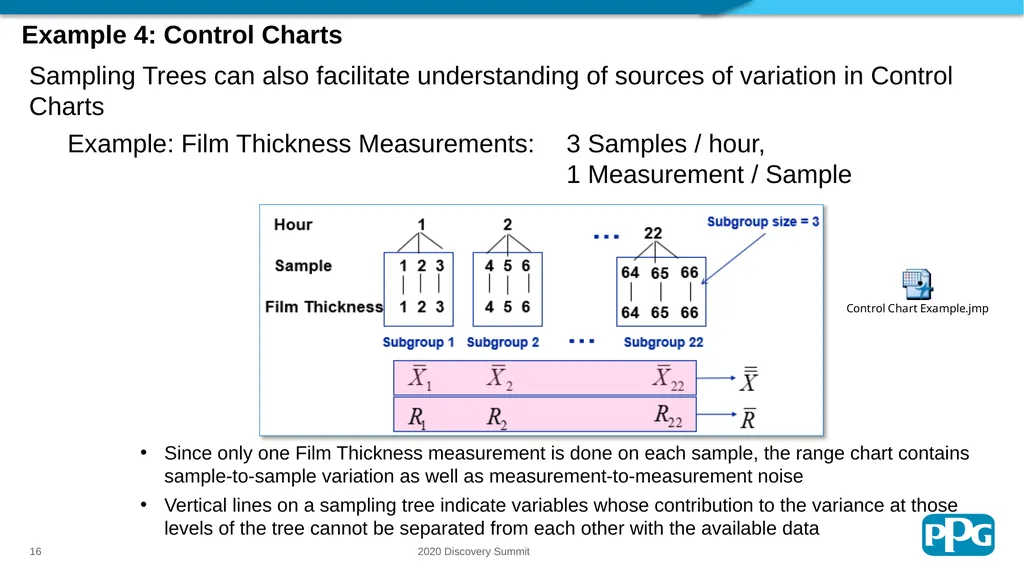
Example 4: Control Charts Since only one Film Thickness measurement is done on each sample, the range chart contains sample-to-sample variation as well as measurement-to-measurement noise
Vertical lines on a sampling tree indicate variables whose contribution to the variance at those levels of the tree cannot be separated from each other with the available data Sampling Trees can also facilitate understanding of sources of variation in Control Charts
Example: Film Thickness Measurements: 3 Samples / hour, 1 Measurement / Sample 2020 Discovery Summit 16<br>
Vertical lines on a sampling tree indicate variables whose contribution to the variance at those levels of the tree cannot be separated from each other with the available data Sampling Trees can also facilitate understanding of sources of variation in Control Charts
Example: Film Thickness Measurements: 3 Samples / hour, 1 Measurement / Sample 2020 Discovery Summit 16<br>
17
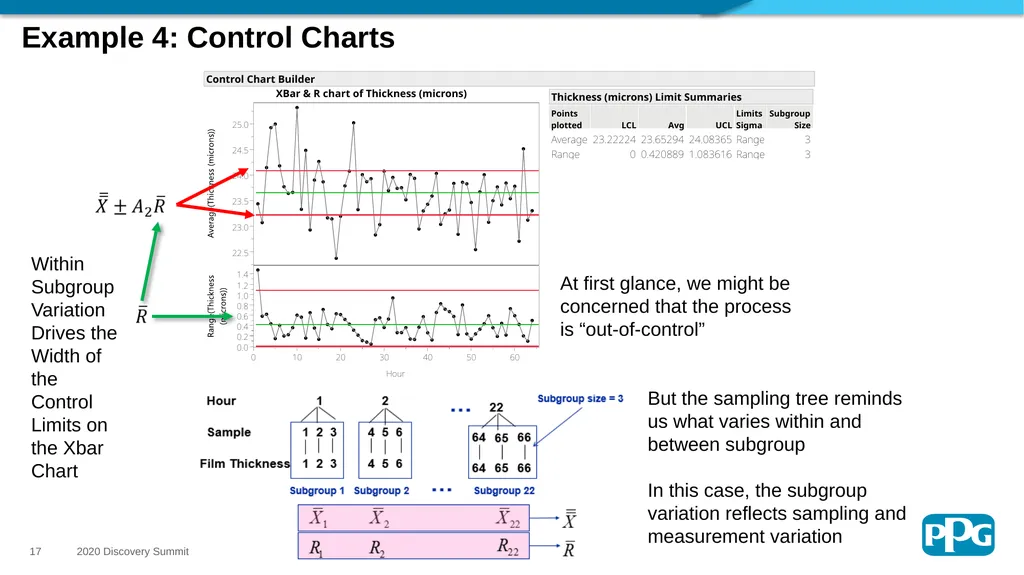
Example 4: Control Charts At first glance, we might be concerned that the process is “out-of-control” But the sampling tree reminds us what varies within and between subgroup
In this case, the subgroup variation reflects sampling and measurement variation Within
Subgroup Variation Drives the Width of the Control Limits on the Xbar Chart 2020 Discovery Summit 17<br>
In this case, the subgroup variation reflects sampling and measurement variation Within
Subgroup Variation Drives the Width of the Control Limits on the Xbar Chart 2020 Discovery Summit 17<br>
18
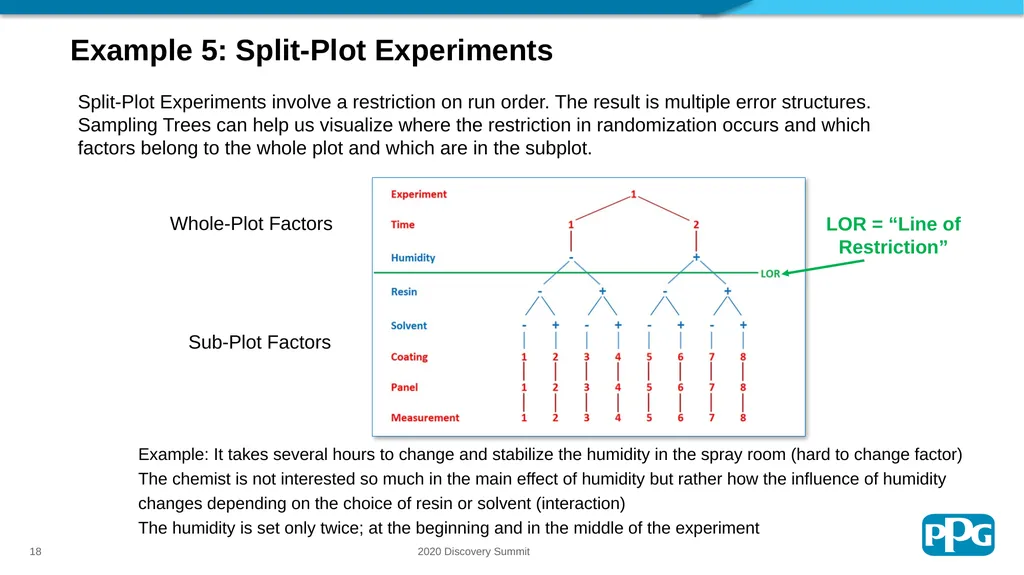
Example 5: Split-Plot Experiments Example: It takes several hours to change and stabilize the humidity in the spray room (hard to change factor)
The chemist is not interested so much in the main effect of humidity but rather how the influence of humidity changes depending on the choice of resin or solvent (interaction)
The humidity is set only twice; at the beginning and in the middle of the experiment LOR = “Line of Restriction” Split-Plot Experiments involve a restriction on run order. The result is multiple error structures. Sampling Trees can help us visualize where the restriction in randomization occurs and which factors belong to the whole plot and which are in the subplot. Whole-Plot Factors Sub-Plot Factors 2020 Discovery Summit 18<br>
The chemist is not interested so much in the main effect of humidity but rather how the influence of humidity changes depending on the choice of resin or solvent (interaction)
The humidity is set only twice; at the beginning and in the middle of the experiment LOR = “Line of Restriction” Split-Plot Experiments involve a restriction on run order. The result is multiple error structures. Sampling Trees can help us visualize where the restriction in randomization occurs and which factors belong to the whole plot and which are in the subplot. Whole-Plot Factors Sub-Plot Factors 2020 Discovery Summit 18<br>
19
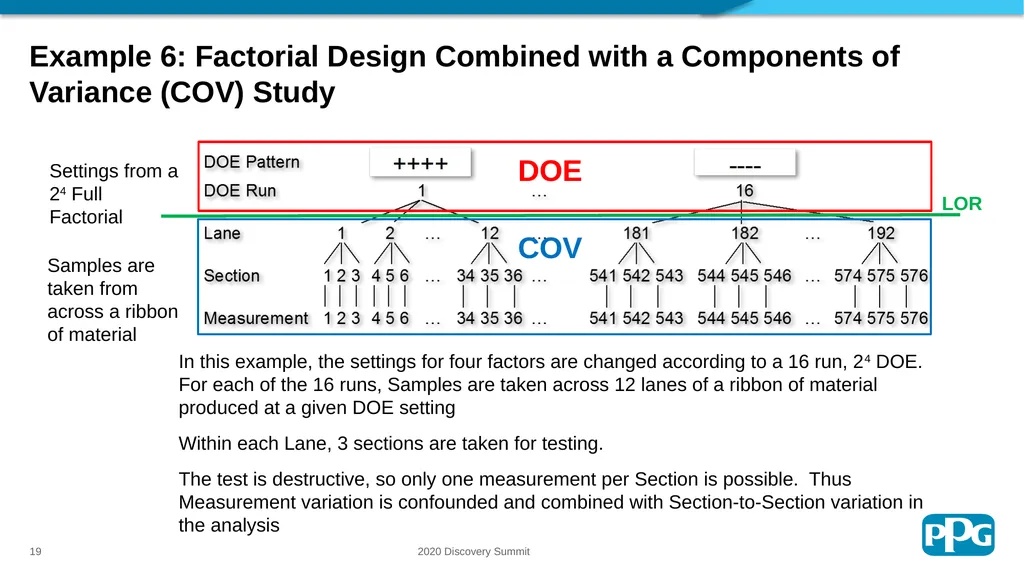
Example 6: Factorial Design Combined with a Components of Variance (COV) Study Settings from a 24 Full Factorial Samples are taken from across a ribbon of material DOE COV In this example, the settings for four factors are changed according to a 16 run, 24 DOE.
For each of the 16 runs, Samples are taken across 12 lanes of a ribbon of material produced at a given DOE setting
Within each Lane, 3 sections are taken for testing.
The test is destructive, so only one measurement per Section is possible. Thus Measurement variation is confounded and combined with Section-to-Section variation in the analysis LOR 2020 Discovery Summit 19<br>
For each of the 16 runs, Samples are taken across 12 lanes of a ribbon of material produced at a given DOE setting
Within each Lane, 3 sections are taken for testing.
The test is destructive, so only one measurement per Section is possible. Thus Measurement variation is confounded and combined with Section-to-Section variation in the analysis LOR 2020 Discovery Summit 19<br>
20
Summary Sampling trees are simple yet powerful graphical tools for both the design of strategic sampling plans and analyzing them once the data is collected
They can be especially helpful in setting up the Variability Chart for analysis and specifying the correct variance components model
Examples have also been provided in which sampling trees have been applied to Control Chart Analysis and Design of Experiments
A Sampling Tree associated with a control chart can highlight what varies within and between subgroups.
Applied to DOEs, sampling trees can highlight lines of restricted randomization and in so doing, elucidate the whole and sub-plot structure of the experiment 2020 Discovery Summit 20<br>
They can be especially helpful in setting up the Variability Chart for analysis and specifying the correct variance components model
Examples have also been provided in which sampling trees have been applied to Control Chart Analysis and Design of Experiments
A Sampling Tree associated with a control chart can highlight what varies within and between subgroups.
Applied to DOEs, sampling trees can highlight lines of restricted randomization and in so doing, elucidate the whole and sub-plot structure of the experiment 2020 Discovery Summit 20<br>