Sharpe Ratio under Long-Range Dependent and Heavy-Tailed Log-Returns Obeying AR-GARCH Process: Theory and Empirical Evidence Lie-Jane Kao Heriot-Watt University Malaysia Cheng-Few Lee Rutgers University, NJ, USA National Chiao-Tung
"Sharpe Ratio under Long-Range Dependent and" is the property of its rightful owner. Permission is granted to
download and print the materials on this website for personal, non-commercial use only, and to display it
on your personal computer provided you do not modify the materials and that you retain all copyright
notices contained in the materials. By downloading content from our website, you accept the terms of this
agreement.
Presentation Transcript
01
Sharpe Ratio under Long-Range Dependent and Heavy-Tailed Log-Returns Obeying AR-GARCH Process: Theory and Empirical Evidence Lie-Jane Kao
Heriot-Watt University Malaysia
Cheng-Few Lee
Rutgers University, NJ, USA
National Chiao-Tung University<br>
02
Part I.
Limiting Distribution of Estimated Sharpe Ratio
when Log-returns are i.i.d. or Strictly-Stationary
with Finite 4th Moment<br>
03
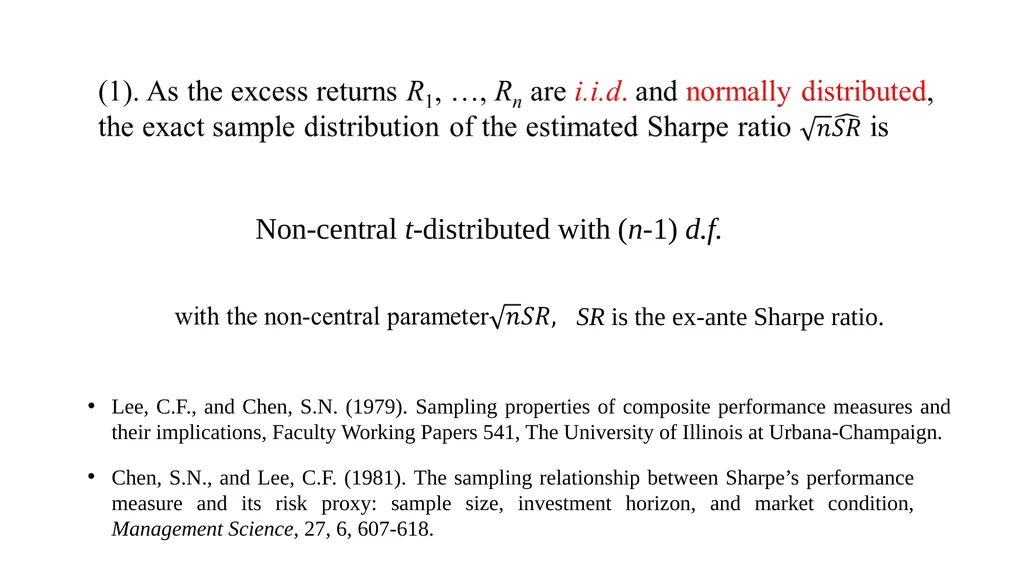
Non-central t-distributed with (n-1) d.f. Chen, S.N., and Lee, C.F. (1981). The sampling relationship between Sharpe’s performance measure and its risk proxy: sample size, investment horizon, and market condition, Management Science, 27, 6, 607-618. Lee, C.F., and Chen, S.N. (1979). Sampling properties of composite performance measures and their implications, Faculty Working Papers 541, The University of Illinois at Urbana-Champaign. SR is the ex-ante Sharpe ratio.<br>
04
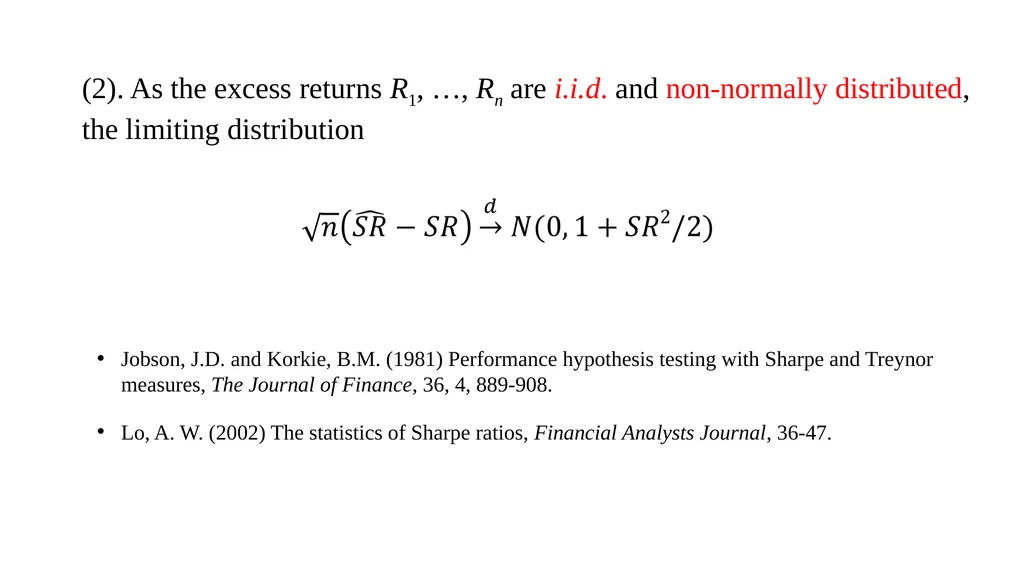
(2). As the excess returns R1, …, Rn are i.i.d. and non-normally distributed,
the limiting distribution Jobson, J.D. and Korkie, B.M. (1981) Performance hypothesis testing with Sharpe and Treynor measures, The Journal of Finance, 36, 4, 889-908. Lo, A. W. (2002) The statistics of Sharpe ratios, Financial Analysts Journal, 36-47.<br>
05
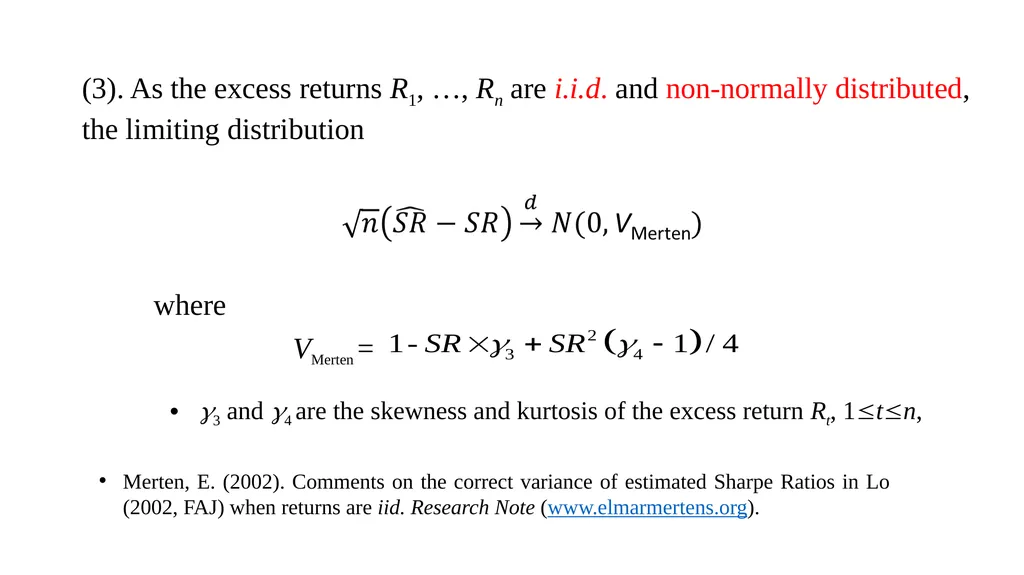
(3). As the excess returns R1, …, Rn are i.i.d. and non-normally distributed,
the limiting distribution where 3 and 4 are the skewness and kurtosis of the excess return Rt, 1tn, VMerten = Merten, E. (2002). Comments on the correct variance of estimated Sharpe Ratios in Lo (2002, FAJ) when returns are iid. Research Note (www.elmarmertens.org).<br>
06
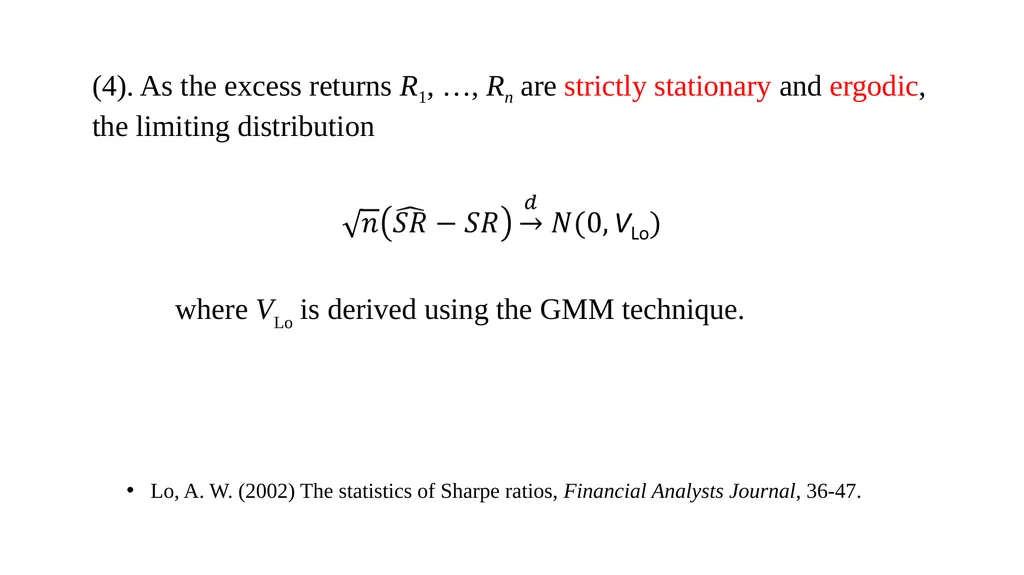
(4). As the excess returns R1, …, Rn are strictly stationary and ergodic,
the limiting distribution Lo, A. W. (2002) The statistics of Sharpe ratios, Financial Analysts Journal, 36-47. where VLo is derived using the GMM technique.<br>
07
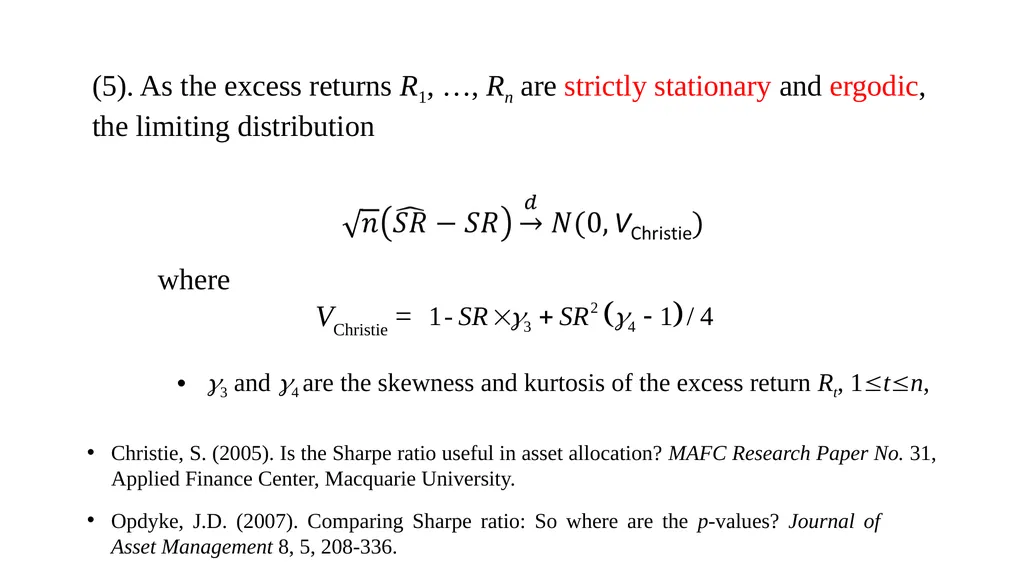
(5). As the excess returns R1, …, Rn are strictly stationary and ergodic,
the limiting distribution where VChristie = 3 and 4 are the skewness and kurtosis of the excess return Rt, 1tn, Christie, S. (2005). Is the Sharpe ratio useful in asset allocation? MAFC Research Paper No. 31, Applied Finance Center, Macquarie University. Opdyke, J.D. (2007). Comparing Sharpe ratio: So where are the p-values? Journal of Asset Management 8, 5, 208-336.<br>
08
Part II.
Limiting Distribution of Estimated Sharpe Ratio when
Log-returns follow AR(1)-GARCH (1,1) Model<br>
09
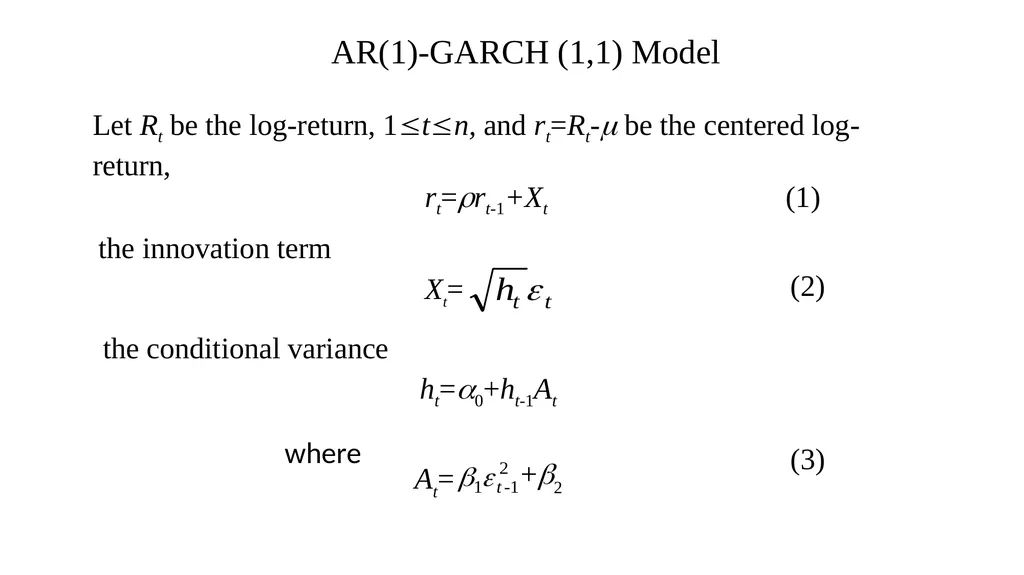
rt=rt-1+Xt (1) Xt= AR(1)-GARCH (1,1) Model Let Rt be the log-return, 1tn, and rt=Rt- be the centered log-return, the innovation term ht=0+ht-1At the conditional variance (2) At= +2 where (3)<br>
10
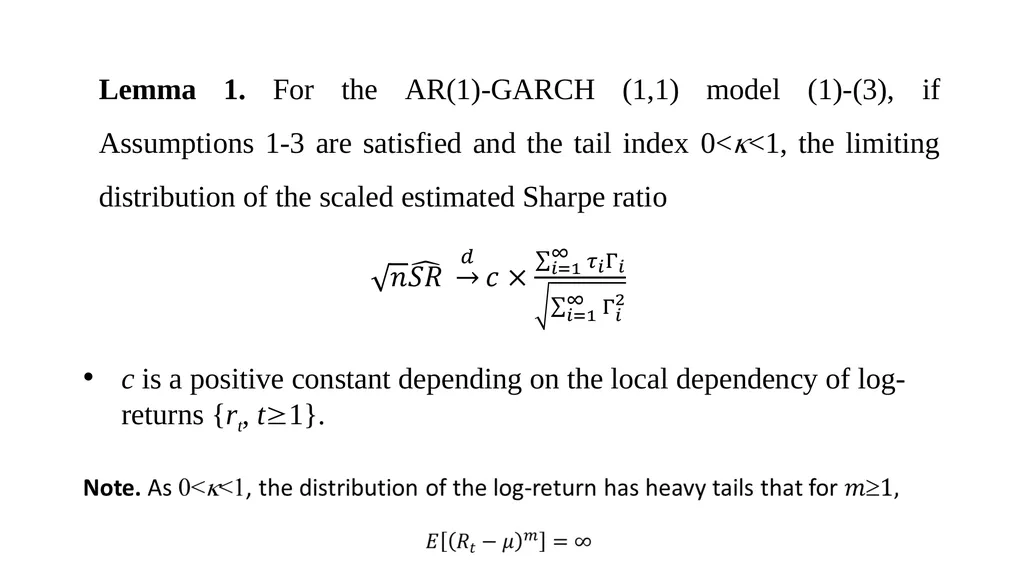
Lemma 1. For the AR(1)-GARCH (1,1) model (1)-(3), if Assumptions 1-3 are satisfied and the tail index 0<<1, the limiting distribution of the scaled estimated Sharpe ratio c is a positive constant depending on the local dependency of log-returns {rt, t1}.<br>
11
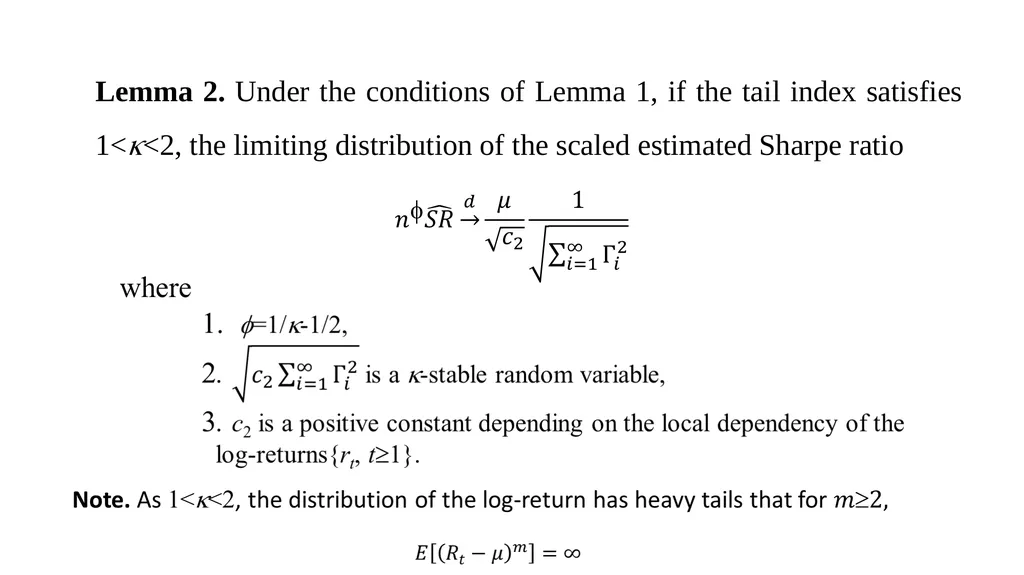
Lemma 2. Under the conditions of Lemma 1, if the tail index satisfies 1<<2, the limiting distribution of the scaled estimated Sharpe ratio<br>
12
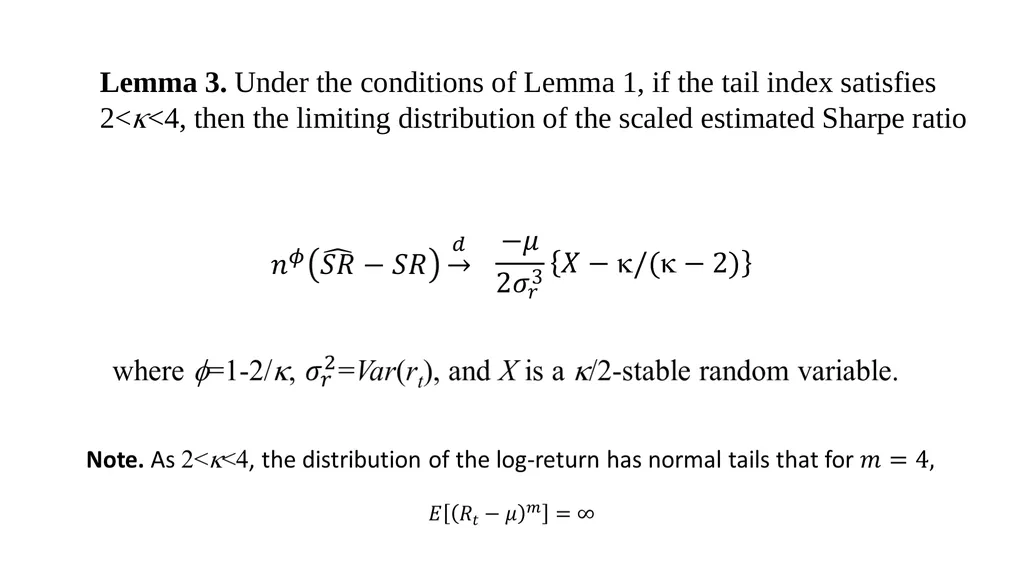
Lemma 3. Under the conditions of Lemma 1, if the tail index satisfies 2<<4, then the limiting distribution of the scaled estimated Sharpe ratio<br>
13
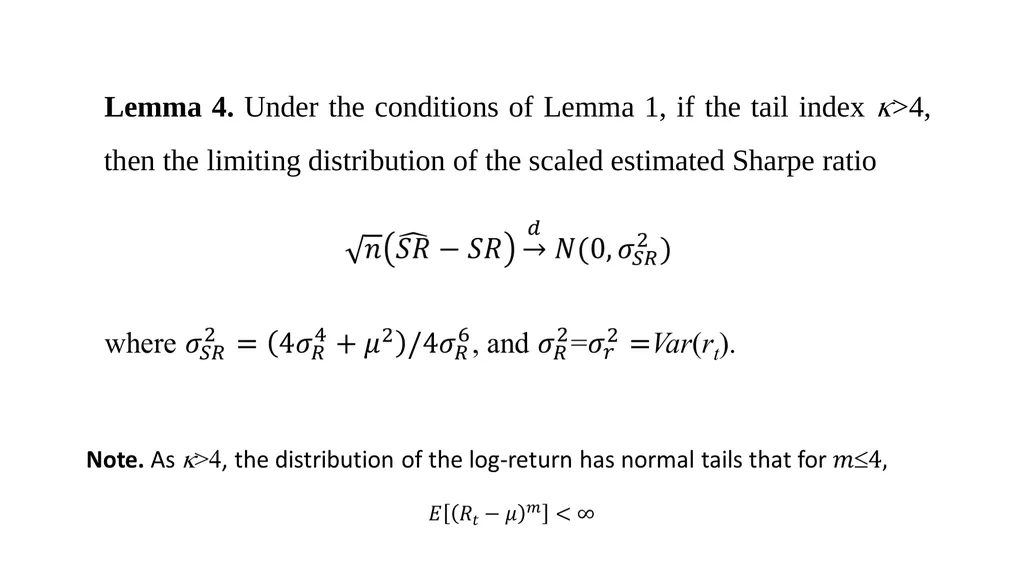
Lemma 4. Under the conditions of Lemma 1, if the tail index >4, then the limiting distribution of the scaled estimated Sharpe ratio<br>
14
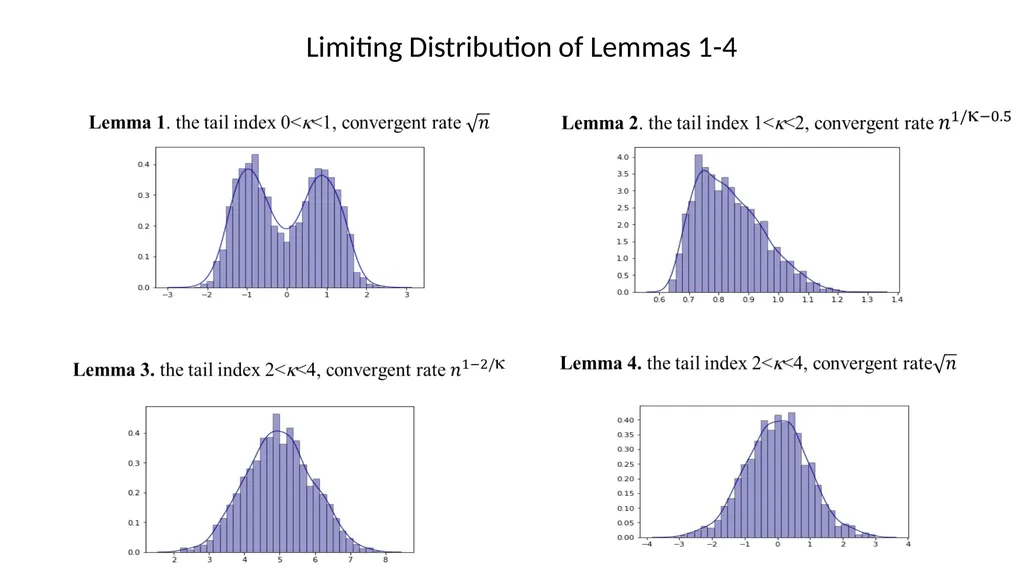
Limiting Distribution of Lemmas 1-4<br>
15
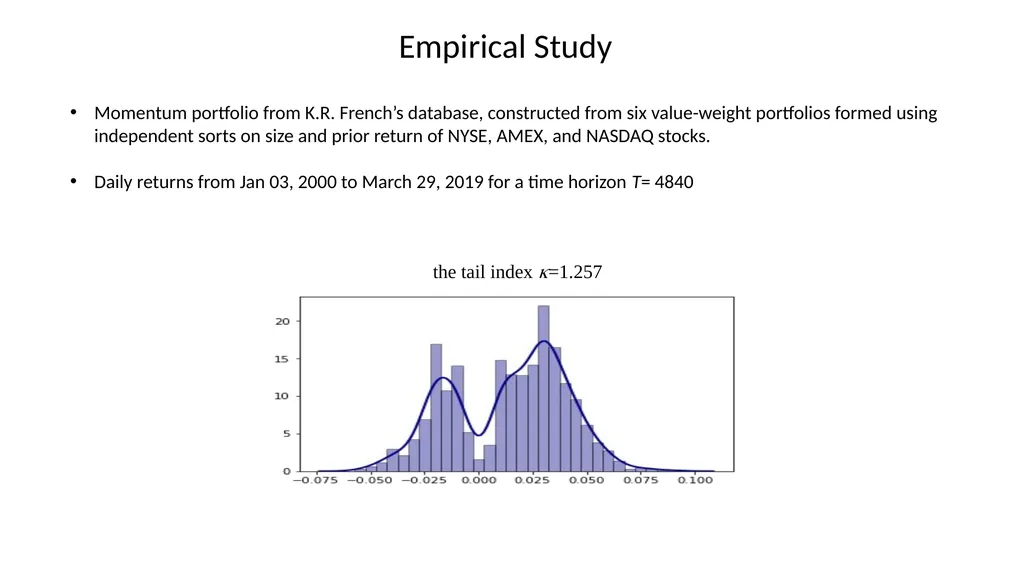
Momentum portfolio from K.R. French’s database, constructed from six value-weight portfolios formed using independent sorts on size and prior return of NYSE, AMEX, and NASDAQ stocks.
Daily returns from Jan 03, 2000 to March 29, 2019 for a time horizon T= 4840 Empirical Study the tail index =1.257<br>
16
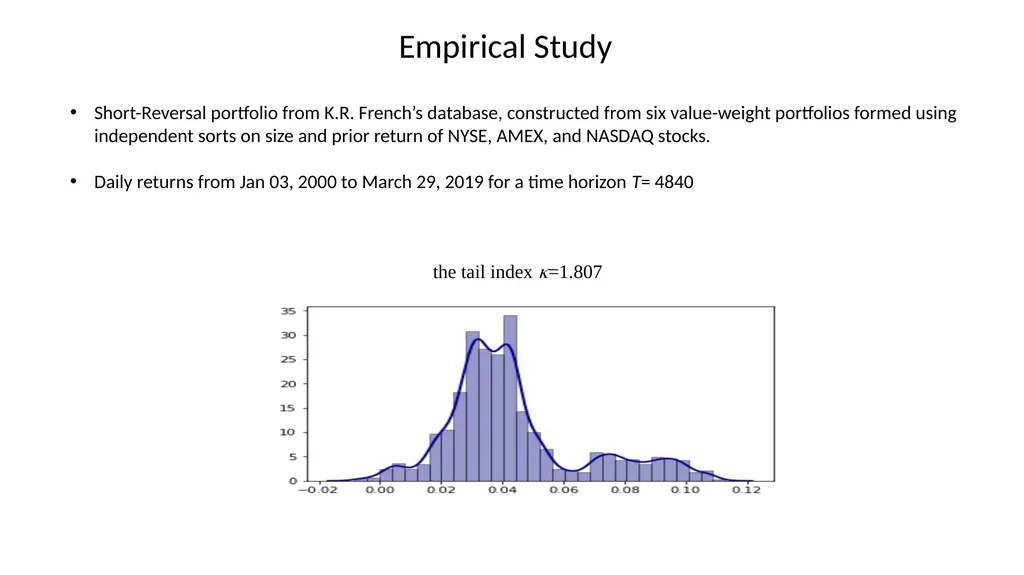
Short-Reversal portfolio from K.R. French’s database, constructed from six value-weight portfolios formed using independent sorts on size and prior return of NYSE, AMEX, and NASDAQ stocks.
Daily returns from Jan 03, 2000 to March 29, 2019 for a time horizon T= 4840 Empirical Study the tail index =1.807<br>