/
Dependent and Independent Variables Dependent and Independent Variables

Dependent and Independent Variables - PowerPoint Presentation

tatyana-admore
tatyana-admore . @tatyana-admore
Follow
535 views
Uploaded On 2016-02-28

Dependent and Independent Variables - PPT Presentation

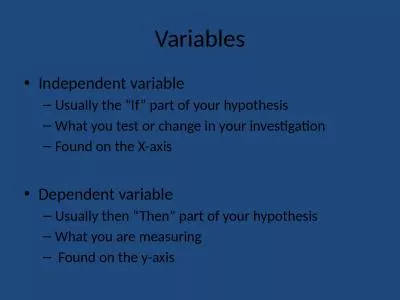
Lesson 707 After completing this lesson you will be able to say I can use variables to represent quantities that have a relationship I can show the relationship between two variables using tables and equations ID: 234690

independent variable equation dependent variable independent dependent equation variables number relationship table values diameter circumference batteries equations show inches current height check

Share:

Link:

Embed:

Download Presentation from below link

Download Presentation The PPT/PDF document "Dependent and Independent Variables" is the property of its rightful owner. Permission is granted to download and print the materials on this web site for personal, non-commercial use only, and to display it on your personal computer provided you do not modify the materials and that you retain all copyright notices contained in the materials. By downloading content from our website, you accept the terms of this agreement.


Presentation Transcript

Slide1

Dependent and Independent Variables

Lesson

7.07Slide2

After completing this lesson, you will be able to say:

I

can

use variables to represent quantities that have a relationship

.

I

can

show the relationship between two variables using tables and equations

.

I

can

use an equation to show the relationship between two variables.Slide3

Key Terms

Dependent variable:

A variable with a value that is dependent on the value of another variable

.

Independent variable:

A variable that affects another variable; it may have its value freely chosen without considering the other variable's value.Slide4

Using Independent and Dependent Variables

Peter is another student at the science fair. He studied the effects of air resistance on paper airplanes.

He did so by adding flaps to the wings of the paper airplane and watching how far the plane travels.

Determine the independent

variable and Dependent variableSlide5

Using Independent and Dependent Variables

You can identify the

independent variable

by determining which variable is affecting the other

.

Peter is changing the amount of air resistance, so this is the independent variable.

The

dependent variable

depends on changes to the independent variable

.

The flight distance changes depending on the amount of air resistance. Therefore, flight distance is the dependent variable.Slide6

Try It

Let's say someone is counting how many cartwheels are completed in one minute, then two minutes, and finally three minutes. In this scenario, what are the dependent and independent variables?Slide7

Check your work

The number of minutes is chosen by the person doing the cartwheels.

Therefore

, the number of minutes (or time) is the independent variable.

How

many cartwheels this person can do depends on the amount of time allowed; the number of cartwheels is the dependent variable.Slide8

Recording Values

An organized method of recording information can help you identify and show relationships. A

table

is a great way to do this.

Using a two-column table, you can record the values of the independent variable in the first column. Then, you can record the resulting values of the dependent variable in the second column.

Independent Variable

Dependent VariableSlide9

Example

Consider the relationship between the diameter of a circle and its circumference.

First, you need to identify the dependent and independent variables

Because the

diameter changes the value of the circumference

, diameter is our independent variable. This makes circumference the dependent variable

.

Next, set up your table. It should look like this

Diameter in inches

Circumference in inchesSlide10

Because you are changing the independent variable

, enter those values in the left column of the table before making measurements. This helps keep things organized and lets you know what to do next

Diameter in inches

Circumference in inches

1

2

3

4

5Slide11

The next step is to use the values that you chose for the independent variable and make those changes to the circle. Then, record the dependent variable.

When these steps are carried out, the final table looks like

this:

Diameter in inches

Circumference in inches

1

3.14

2

6.28

3

9.42

4

12.56

5

15.70Slide12

Analyze the relationship

Now that the information is recorded, give the table another look to see if you notice a pattern.

If you look closely at the changes in circumference when the diameter is changed, you can see that for a 1-inch increase in diameter, these is a 3.14-inch increase in circumference.

This is a special ratio that exists between the diameter of a circle and the circumference of the circle.Slide13

Writing Equations

Relationships between two variables can be analyzed even further by writing

equations

Before you write equations to represent relationships, you must define the variable. In general, the variable x is used for the independent variable and the variable y is used for the dependent variable.

In an electrical circuit, the current (measured in amperes) is related to the voltage supplied from batteries.

Another student investigates this relationship in his science fair project. He is going to increase the number of batteries in a circuit and record the current in the circuit for each number of batteries.

Let’s Look at this further:Slide14

Writing Equations

Show the variables and the recorded information

The number of batteries is the variable that is changing. The number of batteries is the

independent variable

.

The current goes up or down depending on the number of batteries. The current is the

dependent variable

.Slide15

Write an equation that represents this relationship

Define variables:

Let B equal the number of batteries (the independent variable).

Let C equal the amount of current (the dependent variable).

Looking at the table

, you can see that for one battery, the current was 0.8 ampere. Every one increase in the number of batteries causes the current to increase 0.8 ampere.

The equation C = 0.8B represents this relationship.Slide16

Verify the equation

It is very

helpful to check the equation for accuracy, so let's do that this time. To check this equation, you can substitute values from the table.

What is the value for C if B = 4?

C = 0.8B

C = 0.8 ⋅ (4)

C = 3.2, which matches the value in the table.

The equation and the table both show the same relationship.Slide17

Try It!

Given the following table, write an equation that shows the relationship between the number of months and the height of the plant.Slide18

Check your Work

The height depends on the number of months the plant grows. The height is the dependent variable. The independent variable is the number of months. As the number of months changes, it affects the height of the plant.

For each month of growth, the plant gains 2 inches in height. Define your variables:

Let y represent the height

Let x represent the number of months.

In this scenario, the equation is y = 2x.Slide19

Using Equations

SPLAT! While working on his project display, a student accidentally drops his pizza on his data table. He should have finished his lunch in the cafeteria!

His project is about the motion of snails, but now he has to re-create his data. It's a good thing he had the equation written down. The relationship between the amount of time the snail travels, x, and the distance it travels, y, is represented with this equation y = 1.6x.

Using this equation, how can this student re-create the table?Slide20

Using Equations

You have used substitution of the value for the independent variable to calculate the value for the dependent variable. So how is this different?

You have both values for the first row of information, so you can use them to get started

.

Start

with the equation: y = 1.6x.

Substitute a value for the dependent variable: (1.6) = 1.6x.

Solve for x: x = 1.

Now you use the same steps to calculate the missing values from the table. Use the known values for distance and use inverse operations to calculate the missing values for time.Slide21

Try it

Use the equation y

=

1.6x to solve for x when y = 3.2 and y = 6.4 Slide22

Check your workSlide23

Using EquationsSlide24

Now that you completed this lesson, you should be able to say:

I

can

use variables to represent quantities that have a relationship.

I

can

show the relationship between two variables using tables and equations.

I

can

use an equation to show the relationship between two variables.