
SIR 201: Calculating the Measure, Generating
AS
Published · 44 slides · 0 views
1 / 1


Description
SIR 201: Calculating the Measure, Generating Reports, and Presenting the Data Dana Burshell, MPH, CPH, CIC HAI Epidemiologist Virginia Department of Health SIR 101 available online SIR 101: Interpretation and public reporting April 19th,
Related Topics
Share
Embed code
Download this presentation From Below
"SIR 201: Calculating the Measure, Generating" is the property of its rightful owner. Permission is granted to download and print the materials on this website for personal, non-commercial use only, and to display it on your personal computer provided you do not modify the materials and that you retain all copyright notices contained in the materials. By downloading content from our website, you accept the terms of this agreement.
Presentation Transcript
01
SIR 201: Calculating the Measure, Generating Reports, and Presenting the Data Dana Burshell, MPH, CPH, CIC
HAI Epidemiologist
Virginia Department of Health<br>
HAI Epidemiologist
Virginia Department of Health<br>
02
SIR 101 available online SIR 101: Interpretation and public reporting
April 19th, 2012
Reviewed basic SIR calculation and interpretation
Introduced publicly available SIR reports
NHSN, Hospital Compare, Virginia Department of Health
Archived and available at: http://www.vdh.virginia.gov/epidemiology/ surveillance/hai/communication.htm<br>
April 19th, 2012
Reviewed basic SIR calculation and interpretation
Introduced publicly available SIR reports
NHSN, Hospital Compare, Virginia Department of Health
Archived and available at: http://www.vdh.virginia.gov/epidemiology/ surveillance/hai/communication.htm<br>
03
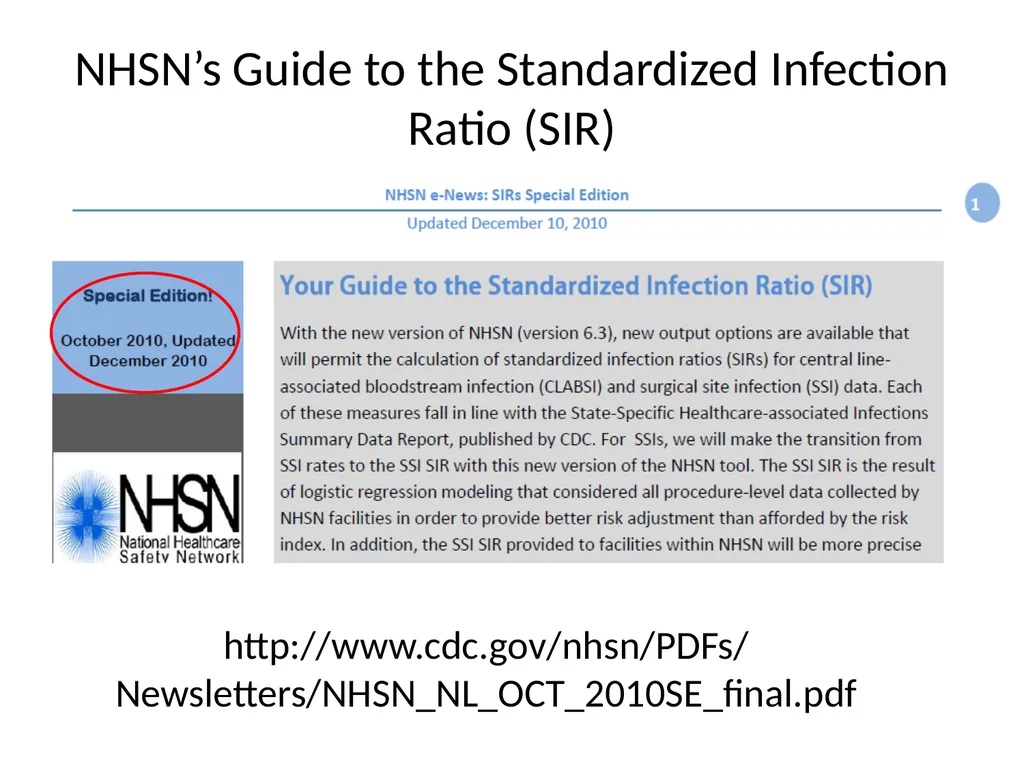
NHSN’s Guide to the Standardized Infection Ratio (SIR) http://www.cdc.gov/nhsn/PDFs/Newsletters/NHSN_NL_OCT_2010SE_final.pdf<br>
04
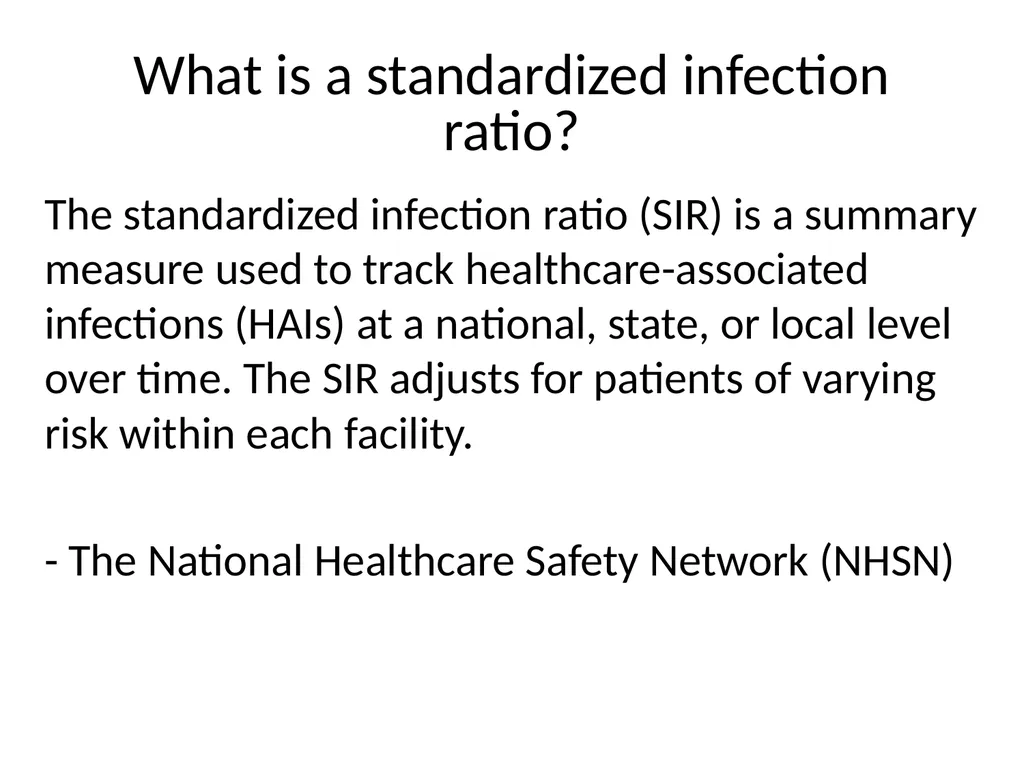
What is a standardized infection ratio? The standardized infection ratio (SIR) is a summary measure used to track healthcare-associated infections (HAIs) at a national, state, or local level over time. The SIR adjusts for patients of varying risk within each facility.
- The National Healthcare Safety Network (NHSN)<br>
- The National Healthcare Safety Network (NHSN)<br>
05
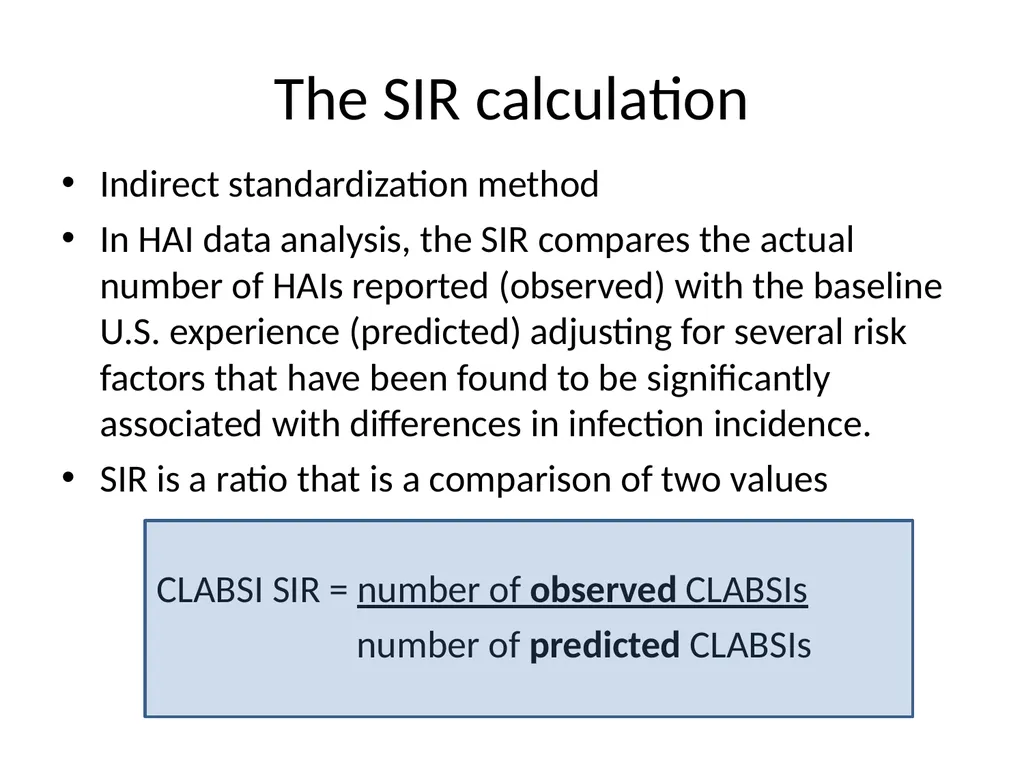
The SIR calculation Indirect standardization method
In HAI data analysis, the SIR compares the actual number of HAIs reported (observed) with the baseline U.S. experience (predicted) adjusting for several risk factors that have been found to be significantly associated with differences in infection incidence.
SIR is a ratio that is a comparison of two values
CLABSI SIR = number of observed CLABSIs
number of predicted CLABSIs<br>
In HAI data analysis, the SIR compares the actual number of HAIs reported (observed) with the baseline U.S. experience (predicted) adjusting for several risk factors that have been found to be significantly associated with differences in infection incidence.
SIR is a ratio that is a comparison of two values
CLABSI SIR = number of observed CLABSIs
number of predicted CLABSIs<br>
06
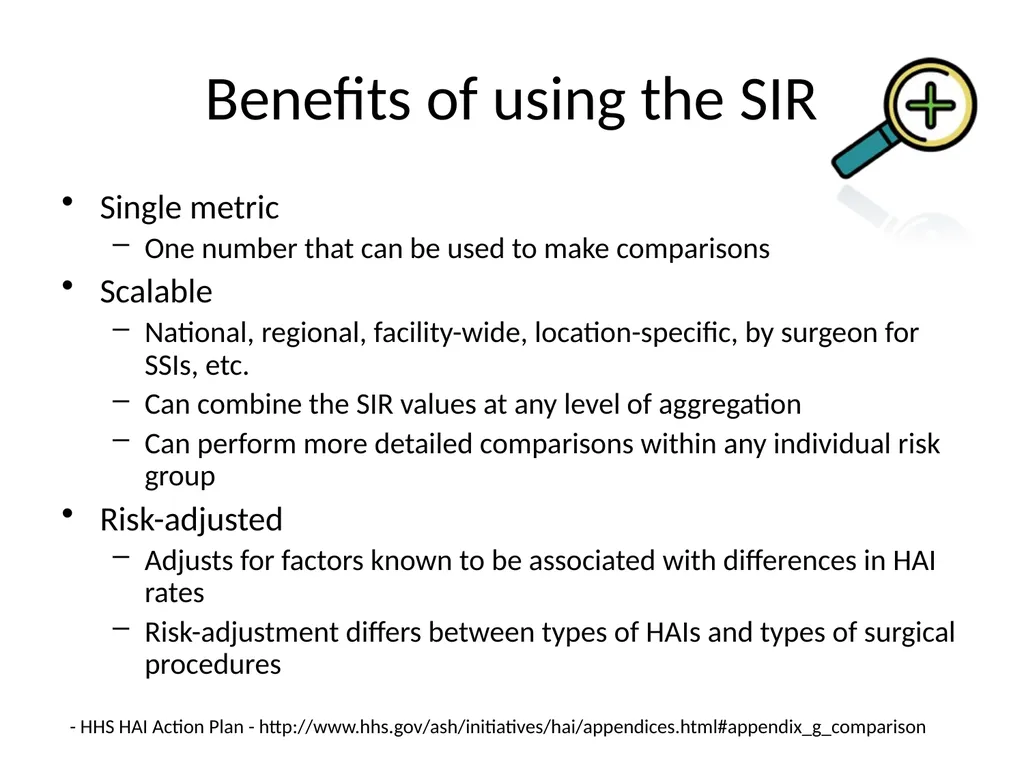
Benefits of using the SIR Single metric
One number that can be used to make comparisons
Scalable
National, regional, facility-wide, location-specific, by surgeon for SSIs, etc.
Can combine the SIR values at any level of aggregation
Can perform more detailed comparisons within any individual risk group
Risk-adjusted
Adjusts for factors known to be associated with differences in HAI rates
Risk-adjustment differs between types of HAIs and types of surgical procedures - HHS HAI Action Plan - http://www.hhs.gov/ash/initiatives/hai/appendices.html#appendix_g_comparison<br>
One number that can be used to make comparisons
Scalable
National, regional, facility-wide, location-specific, by surgeon for SSIs, etc.
Can combine the SIR values at any level of aggregation
Can perform more detailed comparisons within any individual risk group
Risk-adjusted
Adjusts for factors known to be associated with differences in HAI rates
Risk-adjustment differs between types of HAIs and types of surgical procedures - HHS HAI Action Plan - http://www.hhs.gov/ash/initiatives/hai/appendices.html#appendix_g_comparison<br>
07
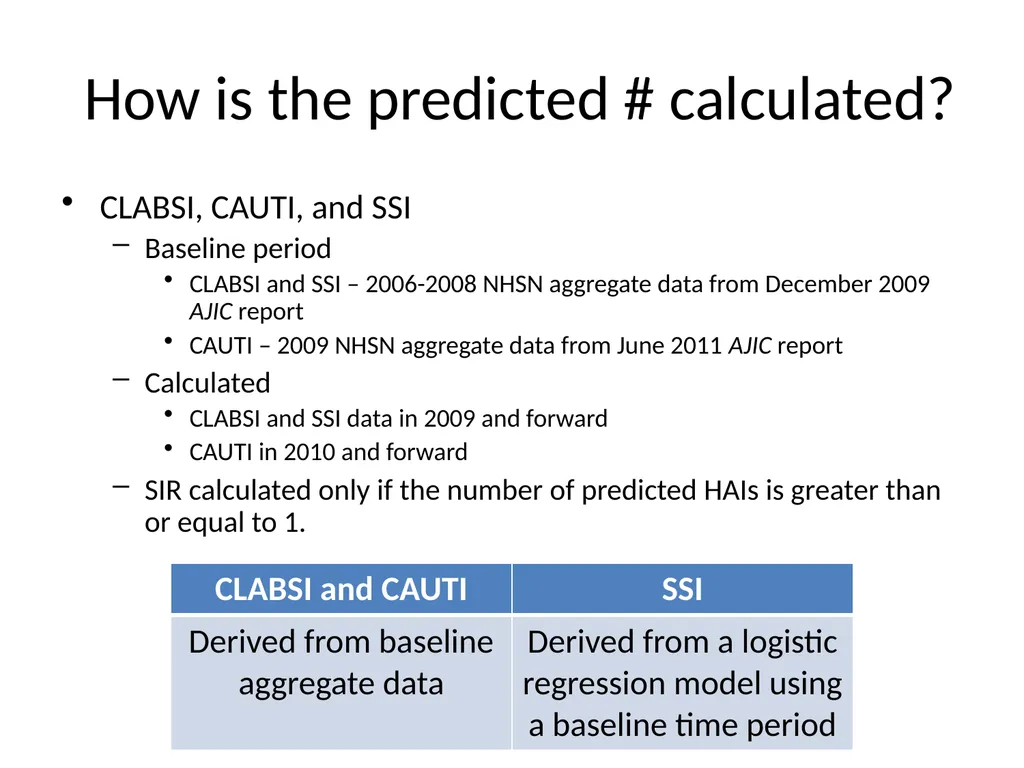
How is the predicted # calculated? CLABSI, CAUTI, and SSI
Baseline period
CLABSI and SSI – 2006-2008 NHSN aggregate data from December 2009 AJIC report
CAUTI – 2009 NHSN aggregate data from June 2011 AJIC report
Calculated
CLABSI and SSI data in 2009 and forward
CAUTI in 2010 and forward
SIR calculated only if the number of predicted HAIs is greater than or equal to 1.<br>
Baseline period
CLABSI and SSI – 2006-2008 NHSN aggregate data from December 2009 AJIC report
CAUTI – 2009 NHSN aggregate data from June 2011 AJIC report
Calculated
CLABSI and SSI data in 2009 and forward
CAUTI in 2010 and forward
SIR calculated only if the number of predicted HAIs is greater than or equal to 1.<br>
08
CLABSI Central line-associated bloodstream infection<br>
09
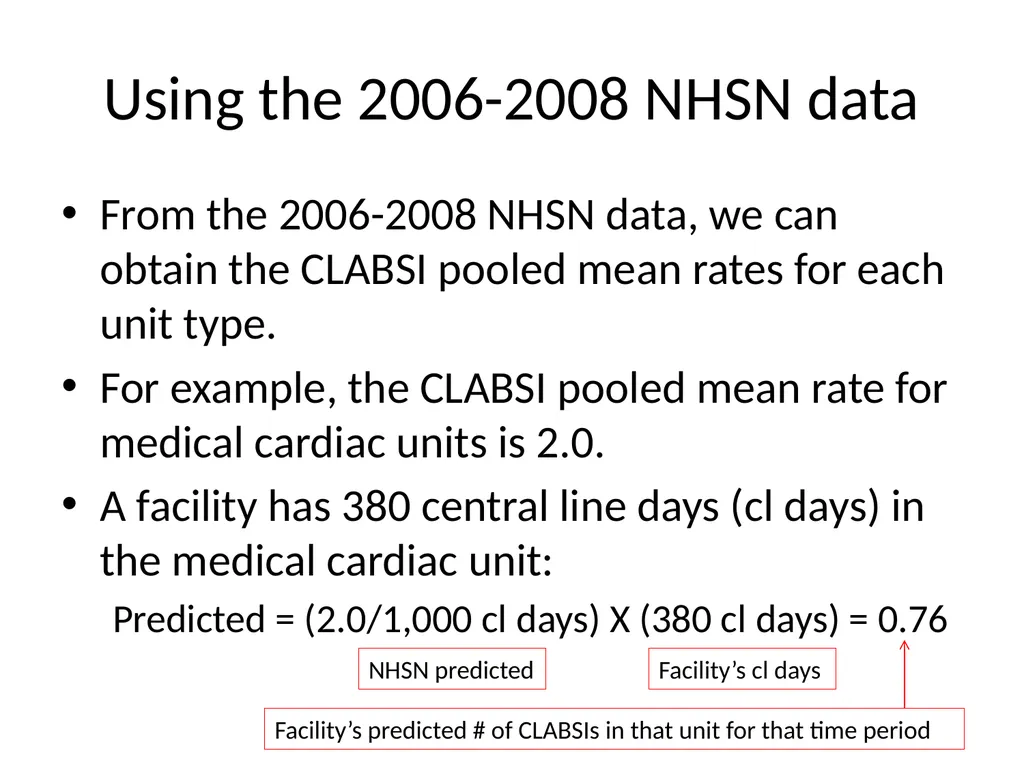
Using the 2006-2008 NHSN data From the 2006-2008 NHSN data, we can obtain the CLABSI pooled mean rates for each unit type.
For example, the CLABSI pooled mean rate for medical cardiac units is 2.0.
A facility has 380 central line days (cl days) in the medical cardiac unit:
Predicted = (2.0/1,000 cl days) X (380 cl days) = 0.76 NHSN predicted Facility’s cl days Facility’s predicted # of CLABSIs in that unit for that time period<br>
For example, the CLABSI pooled mean rate for medical cardiac units is 2.0.
A facility has 380 central line days (cl days) in the medical cardiac unit:
Predicted = (2.0/1,000 cl days) X (380 cl days) = 0.76 NHSN predicted Facility’s cl days Facility’s predicted # of CLABSIs in that unit for that time period<br>
10
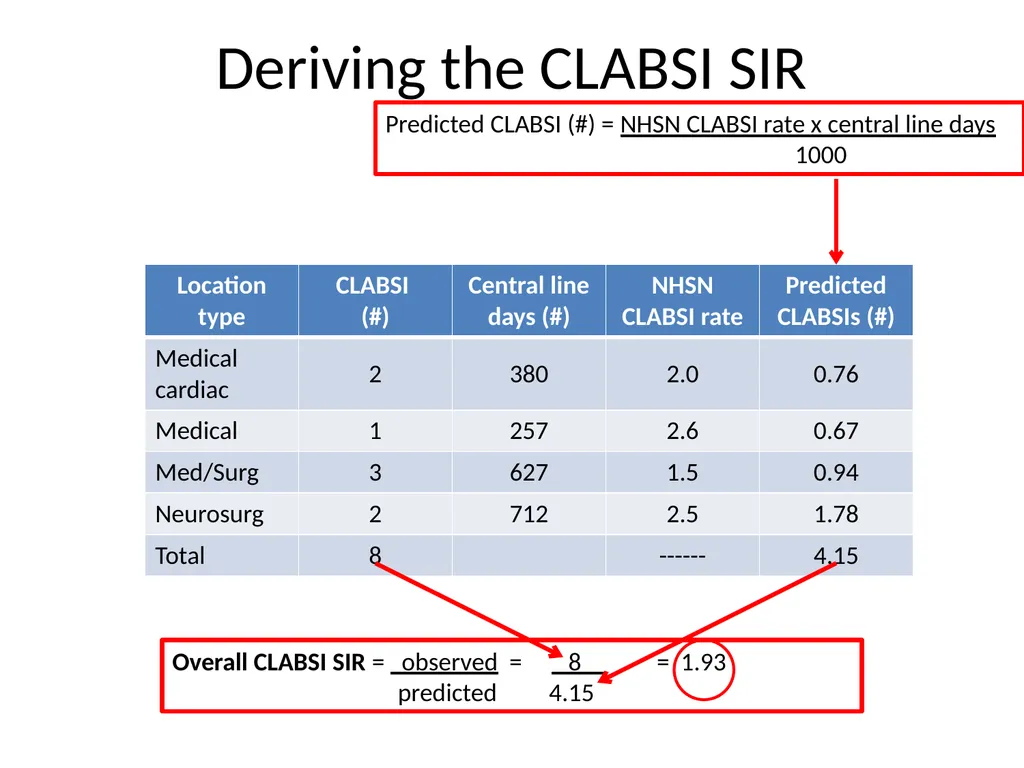
Deriving the CLABSI SIR Predicted CLABSI (#) = NHSN CLABSI rate x central line days
1000 Overall CLABSI SIR = observed = 8 = 1.93
predicted 4.15<br>
1000 Overall CLABSI SIR = observed = 8 = 1.93
predicted 4.15<br>
11
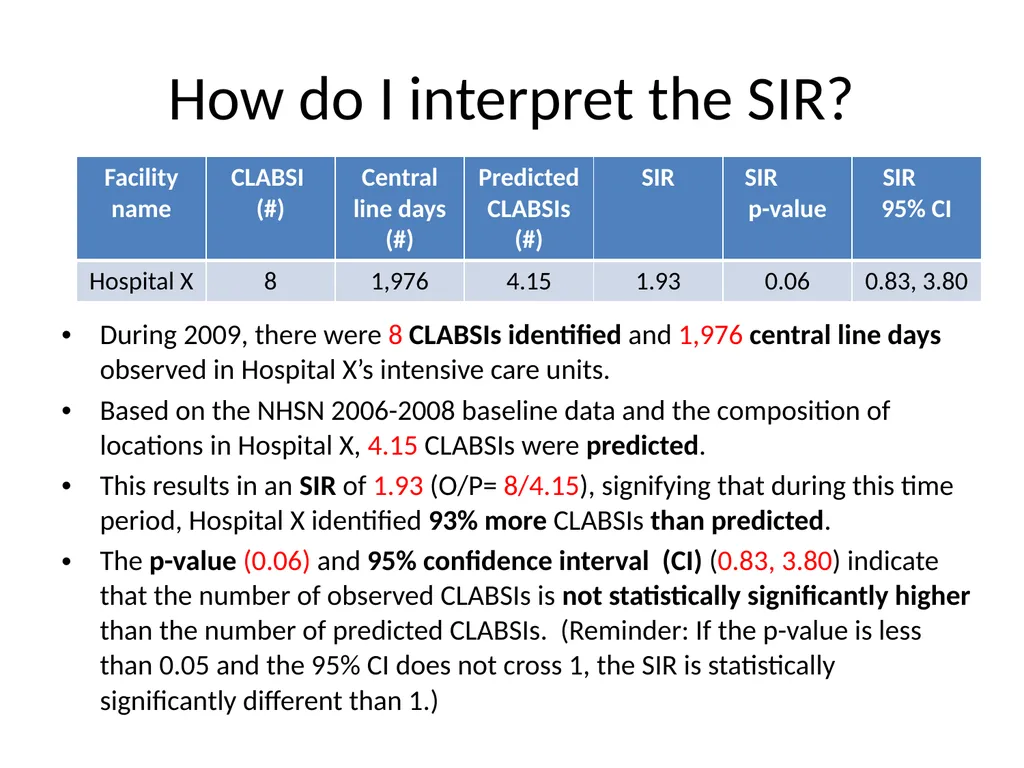
How do I interpret the SIR? During 2009, there were 8 CLABSIs identified and 1,976 central line days observed in Hospital X’s intensive care units.
Based on the NHSN 2006-2008 baseline data and the composition of locations in Hospital X, 4.15 CLABSIs were predicted.
This results in an SIR of 1.93 (O/P= 8/4.15), signifying that during this time period, Hospital X identified 93% more CLABSIs than predicted.
The p-value (0.06) and 95% confidence interval (CI) (0.83, 3.80) indicate that the number of observed CLABSIs is not statistically significantly higher than the number of predicted CLABSIs. (Reminder: If the p-value is less than 0.05 and the 95% CI does not cross 1, the SIR is statistically significantly different than 1.)<br>
Based on the NHSN 2006-2008 baseline data and the composition of locations in Hospital X, 4.15 CLABSIs were predicted.
This results in an SIR of 1.93 (O/P= 8/4.15), signifying that during this time period, Hospital X identified 93% more CLABSIs than predicted.
The p-value (0.06) and 95% confidence interval (CI) (0.83, 3.80) indicate that the number of observed CLABSIs is not statistically significantly higher than the number of predicted CLABSIs. (Reminder: If the p-value is less than 0.05 and the 95% CI does not cross 1, the SIR is statistically significantly different than 1.)<br>
12
Data quality for CLABSI Incomplete/missing
Box will pop-up upon log-in of NHSN (if you have not turned it off)
On the navigation bar
Event > Incomplete
Summary Data > Incomplete
Embedded within the SIR report at the end
Months with 0 or missing device days<br>
Box will pop-up upon log-in of NHSN (if you have not turned it off)
On the navigation bar
Event > Incomplete
Summary Data > Incomplete
Embedded within the SIR report at the end
Months with 0 or missing device days<br>
13
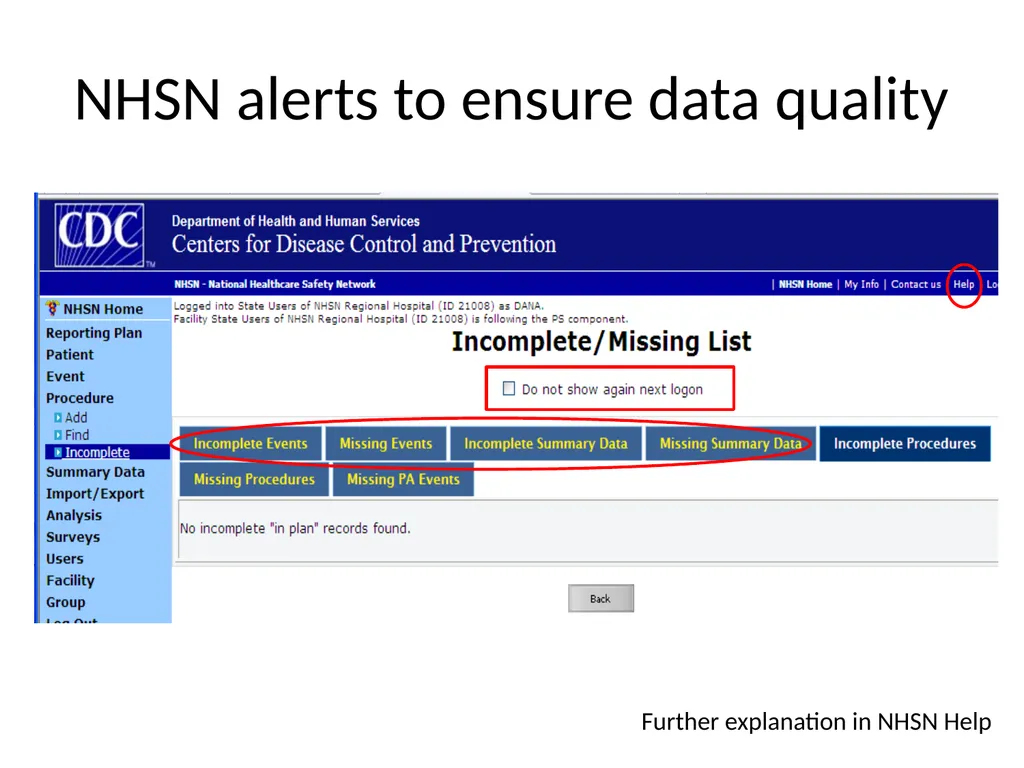
NHSN alerts to ensure data quality Further explanation in NHSN Help<br>
14
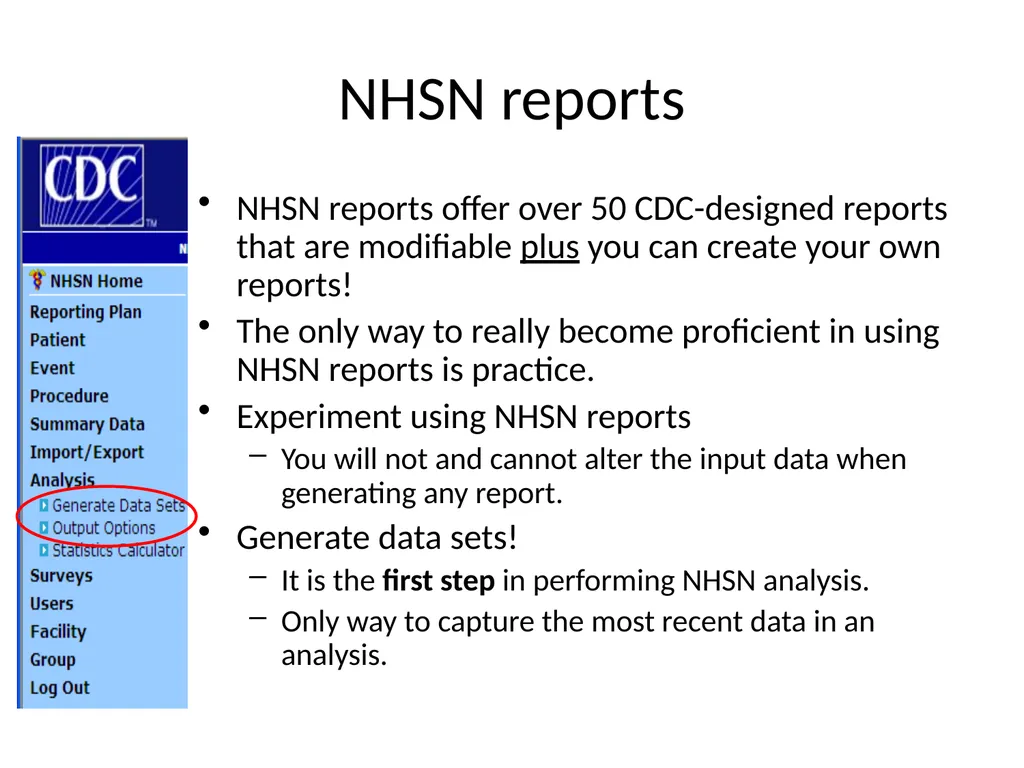
NHSN reports NHSN reports offer over 50 CDC-designed reports that are modifiable plus you can create your own reports!
The only way to really become proficient in using NHSN reports is practice.
Experiment using NHSN reports
You will not and cannot alter the input data when generating any report.
Generate data sets!
It is the first step in performing NHSN analysis.
Only way to capture the most recent data in an analysis.<br>
The only way to really become proficient in using NHSN reports is practice.
Experiment using NHSN reports
You will not and cannot alter the input data when generating any report.
Generate data sets!
It is the first step in performing NHSN analysis.
Only way to capture the most recent data in an analysis.<br>
15
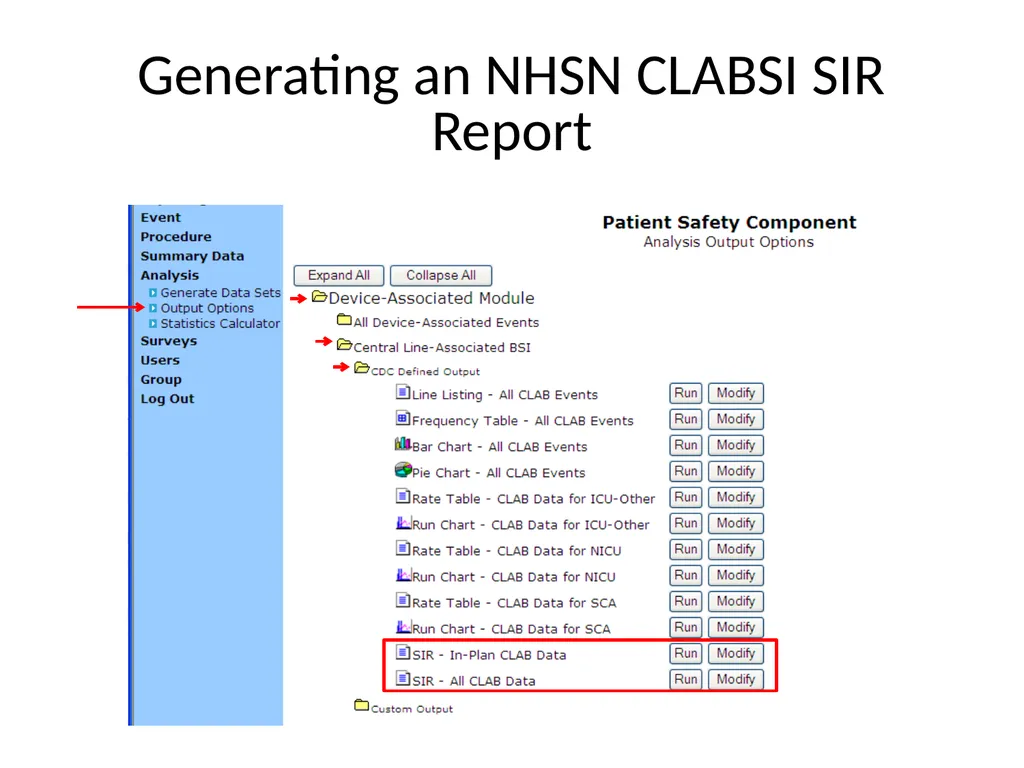
Generating an NHSN CLABSI SIR Report<br>
16
Monthly reporting plans The Patient Safety Monthly Reporting Plan Form (CDC 57.106) is used by NHSN institutions to inform CDC which Patient Safety modules are used during a given month. This allows CDC to select the data that should be included in the aggregate data pool for analysis. Each participating institution must enter a monthly Plan to indicate the module used, if any, and the events, locations and/or procedures they monitored.<br>
17
Output sections Sections in each output
Grouped by location
Overall
OrgID – facility
Location Type (ex. ICU-Other)
CDC Location Code - how facility is mapped to CDC’s location codes
By Location - name designated by your NHSN administrator
Months with Missing or 0 Device Days
Modifiable outputs
Examples: by month/quarter/half-year/year, by locations<br>
Grouped by location
Overall
OrgID – facility
Location Type (ex. ICU-Other)
CDC Location Code - how facility is mapped to CDC’s location codes
By Location - name designated by your NHSN administrator
Months with Missing or 0 Device Days
Modifiable outputs
Examples: by month/quarter/half-year/year, by locations<br>
18
NHSN CLABSI & CAUTI SIR output
for CMS IPPS Displays data being submitted to the Centers for Medicare and Medicaid Services (CMS) by NHSN on behalf of facilities participating in the Inpatient Quality Reporting Program
“SIR – CLAB Data for CMS IPPS”
“SIR – CAUTI Data for CMS IPPS”
Navigation instructions:
“Analysis” > “Output Options” > “Advanced” > “Summary Level Data” > “CDC-Defined Output”
More information available at www.cdc.gov/nhsn/library.html<br>
“SIR – CLAB Data for CMS IPPS”
“SIR – CAUTI Data for CMS IPPS”
Navigation instructions:
“Analysis” > “Output Options” > “Advanced” > “Summary Level Data” > “CDC-Defined Output”
More information available at www.cdc.gov/nhsn/library.html<br>
19
SSI Surgical site infections<br>
20
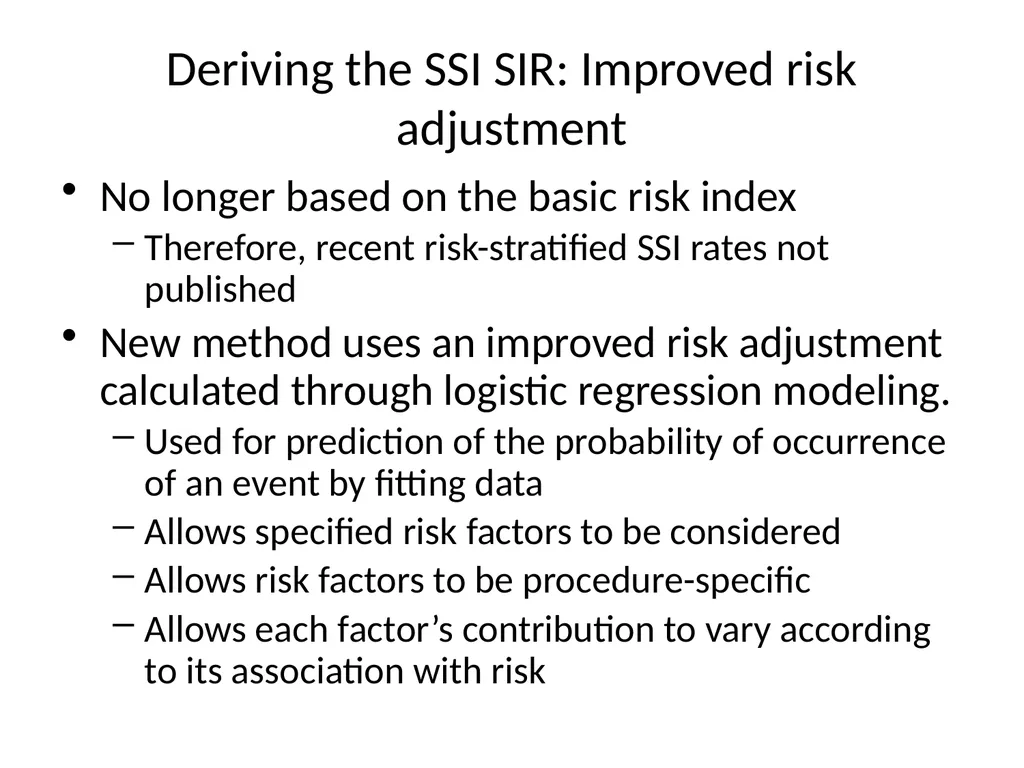
Deriving the SSI SIR: Improved risk adjustment No longer based on the basic risk index
Therefore, recent risk-stratified SSI rates not published
New method uses an improved risk adjustment calculated through logistic regression modeling.
Used for prediction of the probability of occurrence of an event by fitting data
Allows specified risk factors to be considered
Allows risk factors to be procedure-specific
Allows each factor’s contribution to vary according to its association with risk<br>
Therefore, recent risk-stratified SSI rates not published
New method uses an improved risk adjustment calculated through logistic regression modeling.
Used for prediction of the probability of occurrence of an event by fitting data
Allows specified risk factors to be considered
Allows risk factors to be procedure-specific
Allows each factor’s contribution to vary according to its association with risk<br>
21
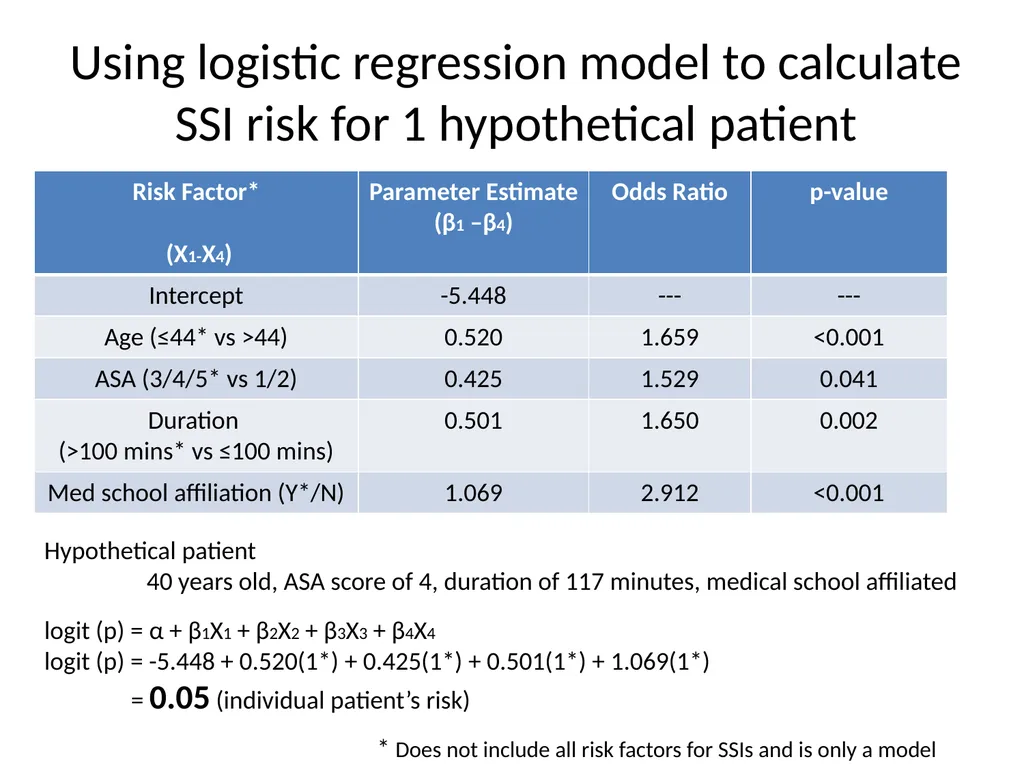
Using logistic regression model to calculate SSI risk for 1 hypothetical patient Hypothetical patient
40 years old, ASA score of 4, duration of 117 minutes, medical school affiliated
logit (p) = α + β1X1 + β2X2 + β3X3 + β4X4
logit (p) = -5.448 + 0.520(1*) + 0.425(1*) + 0.501(1*) + 1.069(1*)
= 0.05 (individual patient’s risk) * Does not include all risk factors for SSIs and is only a model<br>
40 years old, ASA score of 4, duration of 117 minutes, medical school affiliated
logit (p) = α + β1X1 + β2X2 + β3X3 + β4X4
logit (p) = -5.448 + 0.520(1*) + 0.425(1*) + 0.501(1*) + 1.069(1*)
= 0.05 (individual patient’s risk) * Does not include all risk factors for SSIs and is only a model<br>
22
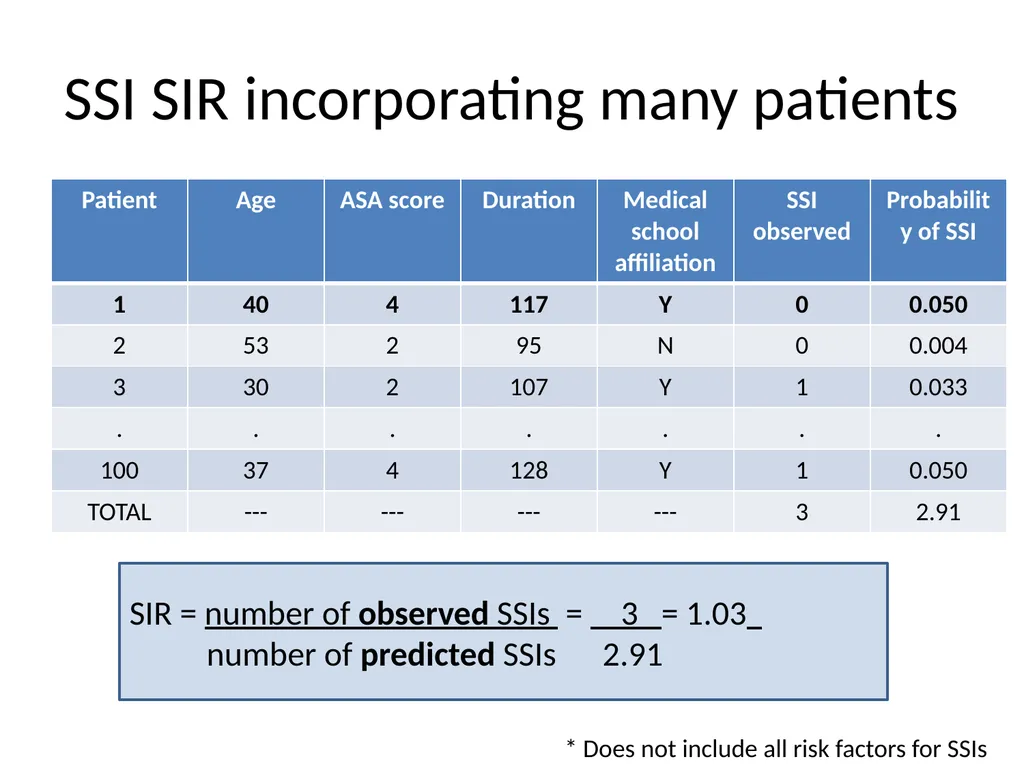
SSI SIR incorporating many patients SIR = number of observed SSIs = 3 = 1.03
number of predicted SSIs 2.91 * Does not include all risk factors for SSIs<br>
number of predicted SSIs 2.91 * Does not include all risk factors for SSIs<br>
23
Risk factors for COLO and HYST * As of April of 2012
**Taken from the annual facility survey http://www.cdc.gov/nhsn/PDFs/pscManual/SSI_ModelPaper.pdf<br>
**Taken from the annual facility survey http://www.cdc.gov/nhsn/PDFs/pscManual/SSI_ModelPaper.pdf<br>
24
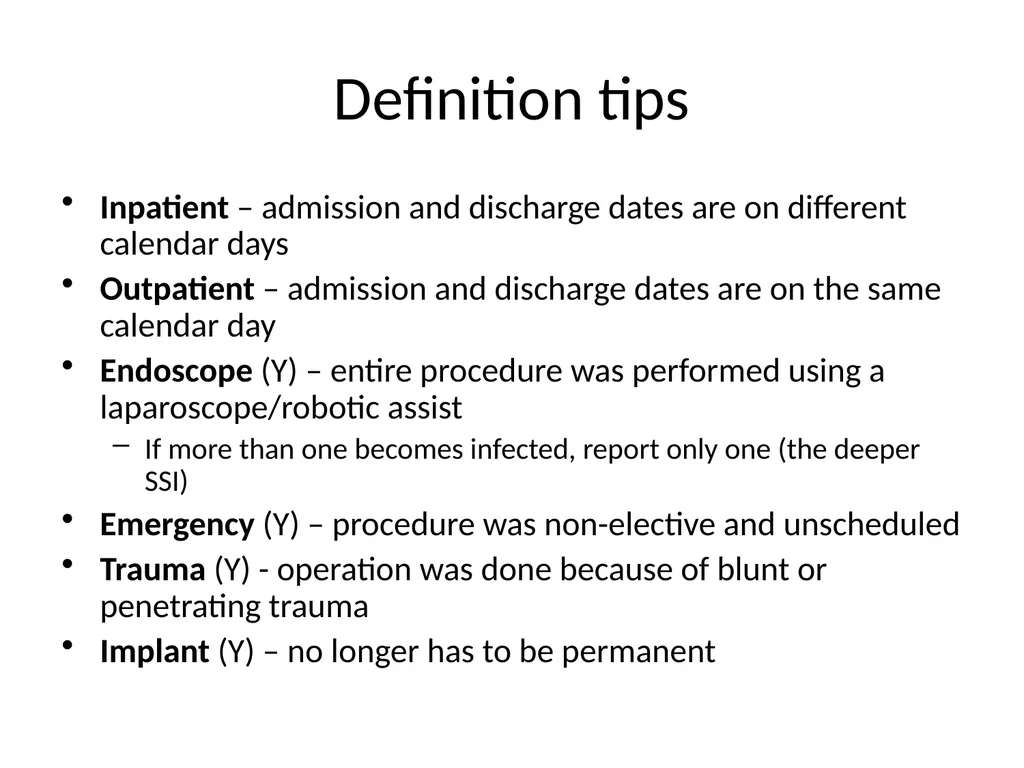
Definition tips Inpatient – admission and discharge dates are on different calendar days
Outpatient – admission and discharge dates are on the same calendar day
Endoscope (Y) – entire procedure was performed using a laparoscope/robotic assist
If more than one becomes infected, report only one (the deeper SSI)
Emergency (Y) – procedure was non-elective and unscheduled
Trauma (Y) - operation was done because of blunt or penetrating trauma
Implant (Y) – no longer has to be permanent<br>
Outpatient – admission and discharge dates are on the same calendar day
Endoscope (Y) – entire procedure was performed using a laparoscope/robotic assist
If more than one becomes infected, report only one (the deeper SSI)
Emergency (Y) – procedure was non-elective and unscheduled
Trauma (Y) - operation was done because of blunt or penetrating trauma
Implant (Y) – no longer has to be permanent<br>
25
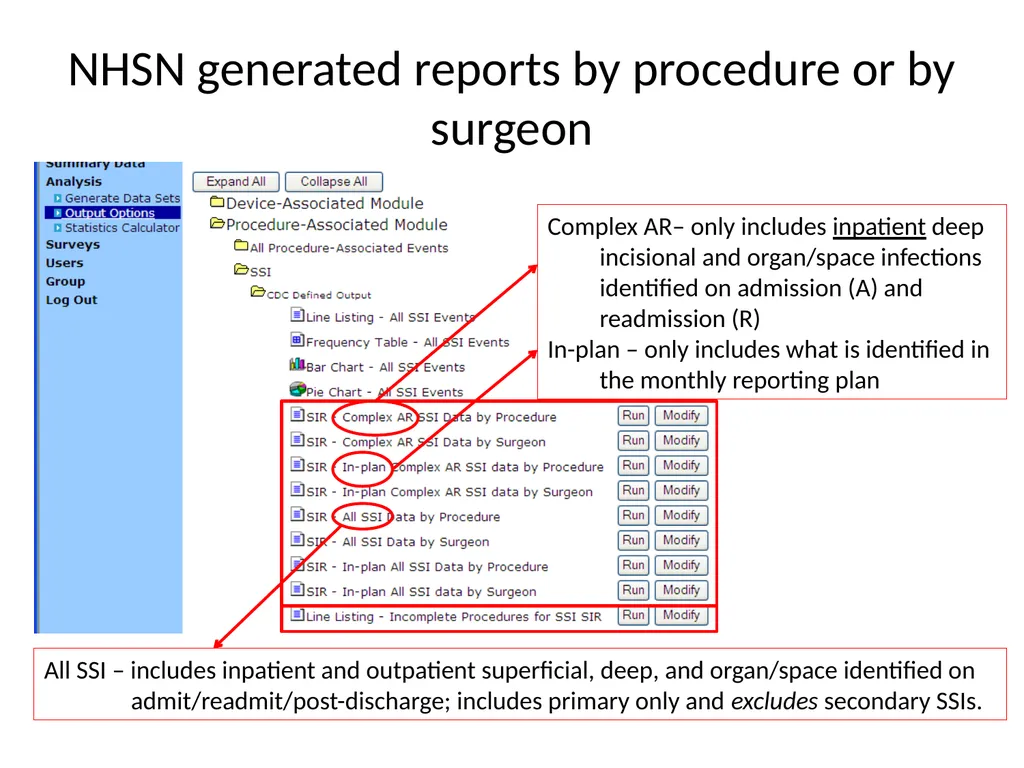
NHSN generated reports by procedure or by surgeon Complex AR– only includes inpatient deep
incisional and organ/space infections
identified on admission (A) and
readmission (R)
In-plan – only includes what is identified in
the monthly reporting plan All SSI – includes inpatient and outpatient superficial, deep, and organ/space identified on
admit/readmit/post-discharge; includes primary only and excludes secondary SSIs.<br>
incisional and organ/space infections
identified on admission (A) and
readmission (R)
In-plan – only includes what is identified in
the monthly reporting plan All SSI – includes inpatient and outpatient superficial, deep, and organ/space identified on
admit/readmit/post-discharge; includes primary only and excludes secondary SSIs.<br>
26
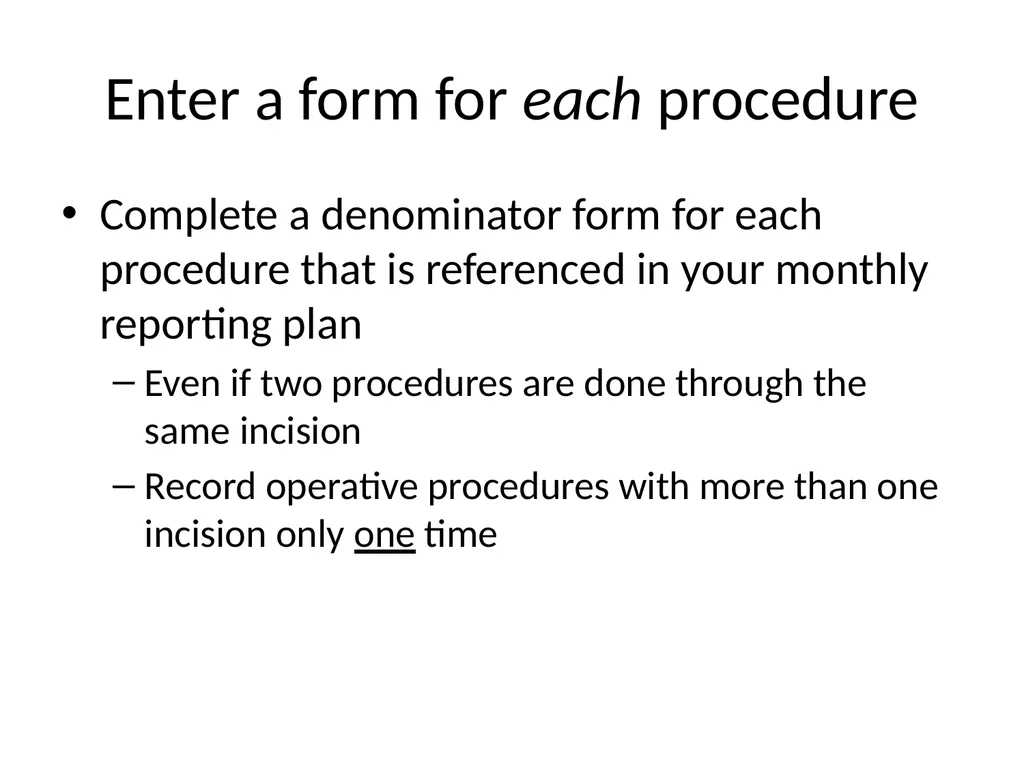
Enter a form for each procedure Complete a denominator form for each procedure that is referenced in your monthly reporting plan
Even if two procedures are done through the same incision
Record operative procedures with more than one incision only one time<br>
Even if two procedures are done through the same incision
Record operative procedures with more than one incision only one time<br>
27
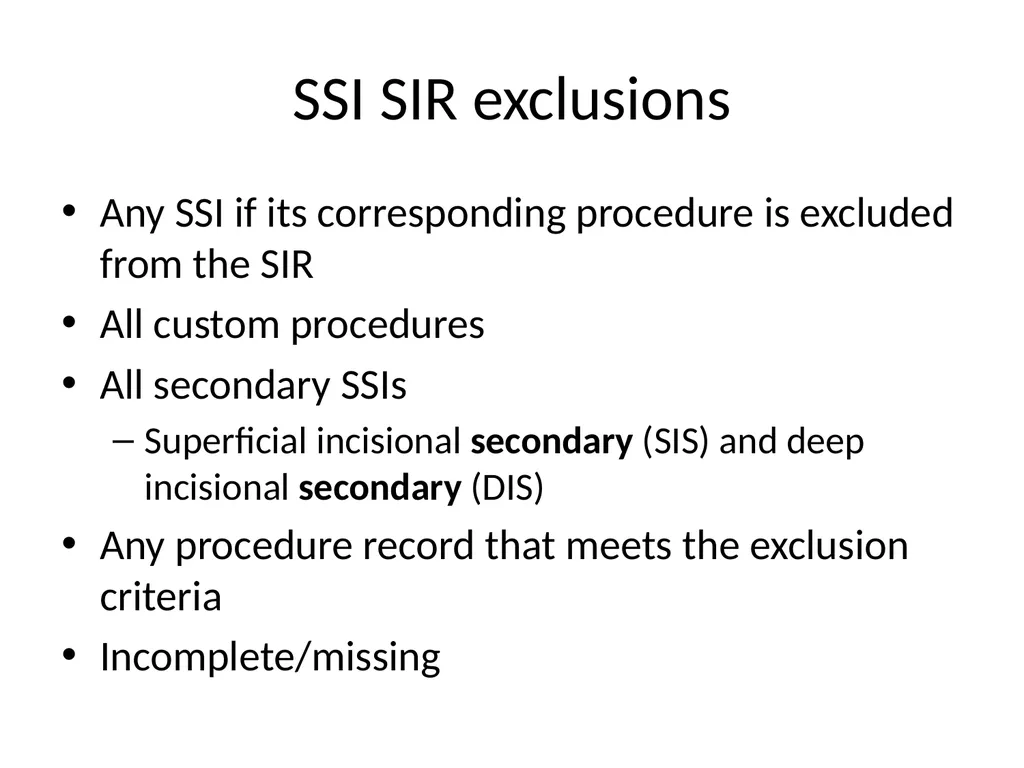
SSI SIR exclusions Any SSI if its corresponding procedure is excluded from the SIR
All custom procedures
All secondary SSIs
Superficial incisional secondary (SIS) and deep incisional secondary (DIS)
Any procedure record that meets the exclusion criteria
Incomplete/missing<br>
All custom procedures
All secondary SSIs
Superficial incisional secondary (SIS) and deep incisional secondary (DIS)
Any procedure record that meets the exclusion criteria
Incomplete/missing<br>
28
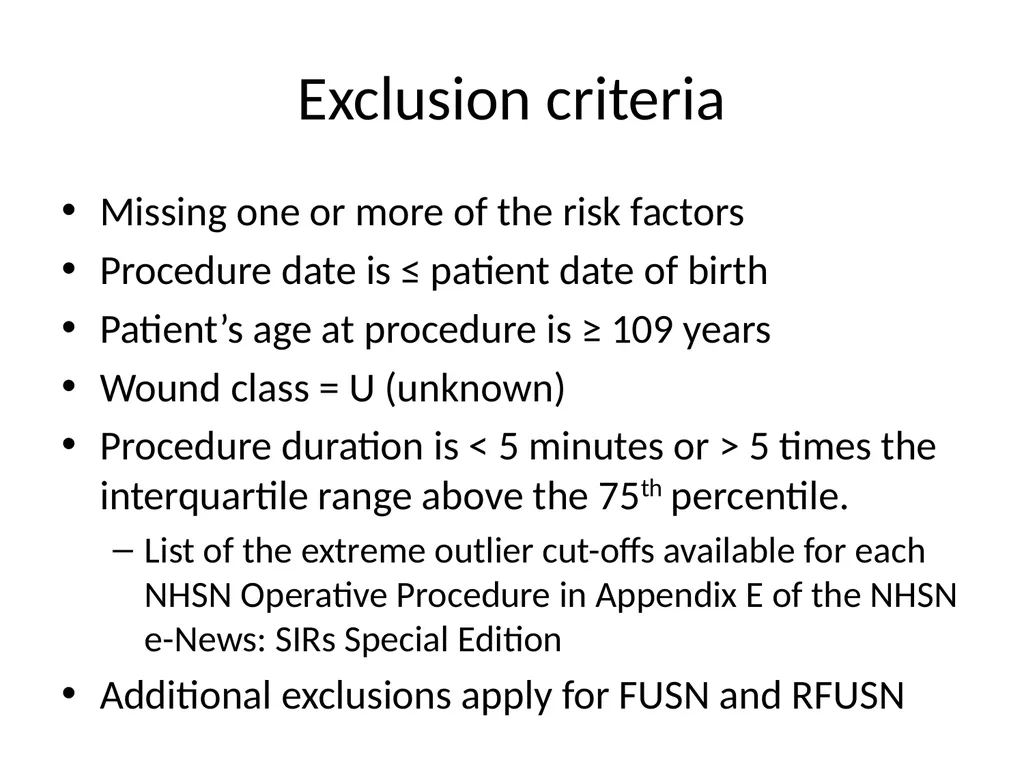
Exclusion criteria Missing one or more of the risk factors
Procedure date is ≤ patient date of birth
Patient’s age at procedure is ≥ 109 years
Wound class = U (unknown)
Procedure duration is < 5 minutes or > 5 times the interquartile range above the 75th percentile.
List of the extreme outlier cut-offs available for each NHSN Operative Procedure in Appendix E of the NHSN e-News: SIRs Special Edition
Additional exclusions apply for FUSN and RFUSN<br>
Procedure date is ≤ patient date of birth
Patient’s age at procedure is ≥ 109 years
Wound class = U (unknown)
Procedure duration is < 5 minutes or > 5 times the interquartile range above the 75th percentile.
List of the extreme outlier cut-offs available for each NHSN Operative Procedure in Appendix E of the NHSN e-News: SIRs Special Edition
Additional exclusions apply for FUSN and RFUSN<br>
29
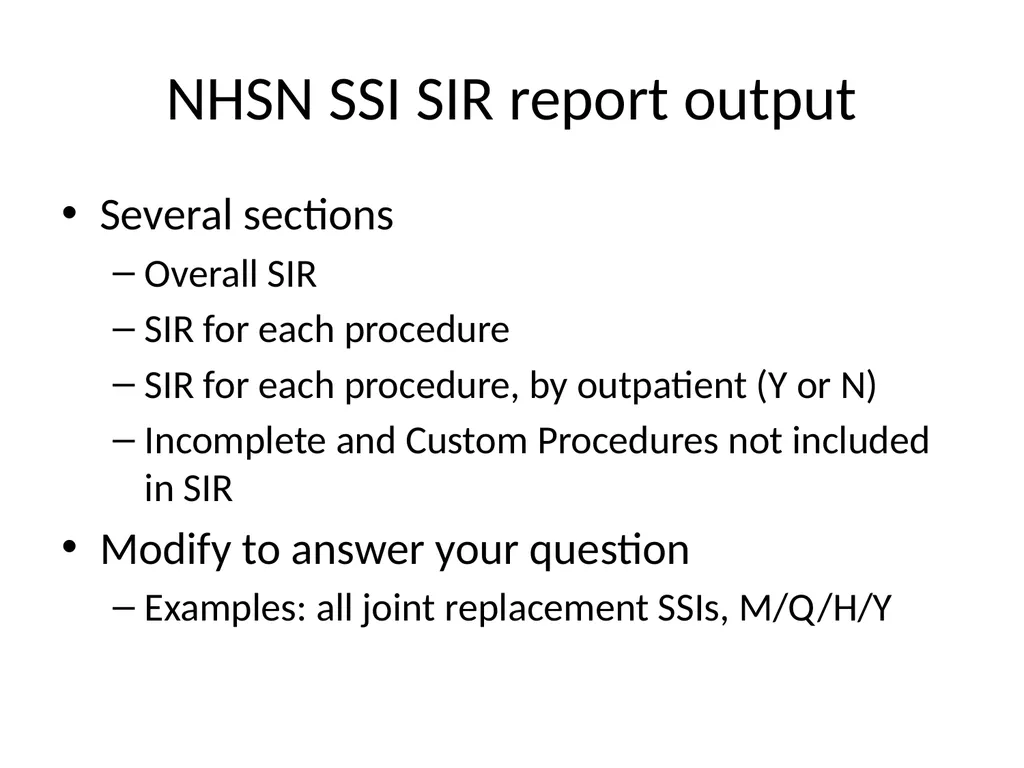
NHSN SSI SIR report output Several sections
Overall SIR
SIR for each procedure
SIR for each procedure, by outpatient (Y or N)
Incomplete and Custom Procedures not included in SIR
Modify to answer your question
Examples: all joint replacement SSIs, M/Q/H/Y<br>
Overall SIR
SIR for each procedure
SIR for each procedure, by outpatient (Y or N)
Incomplete and Custom Procedures not included in SIR
Modify to answer your question
Examples: all joint replacement SSIs, M/Q/H/Y<br>
30
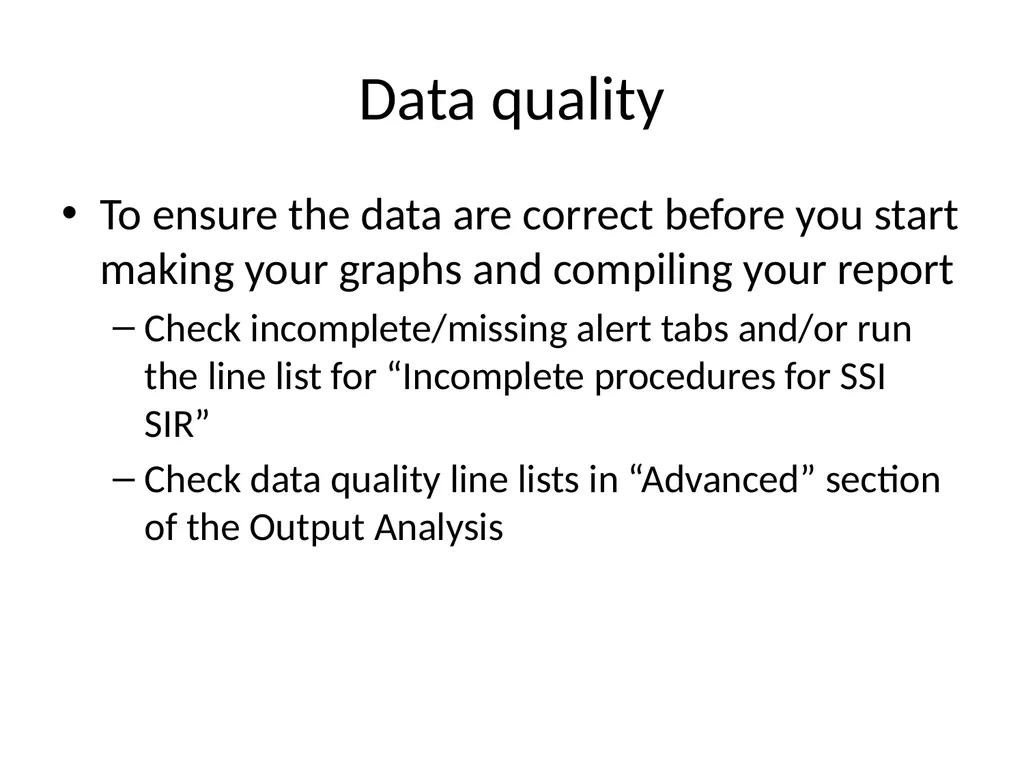
Data quality To ensure the data are correct before you start making your graphs and compiling your report
Check incomplete/missing alert tabs and/or run the line list for “Incomplete procedures for SSI SIR”
Check data quality line lists in “Advanced” section of the Output Analysis<br>
Check incomplete/missing alert tabs and/or run the line list for “Incomplete procedures for SSI SIR”
Check data quality line lists in “Advanced” section of the Output Analysis<br>
31
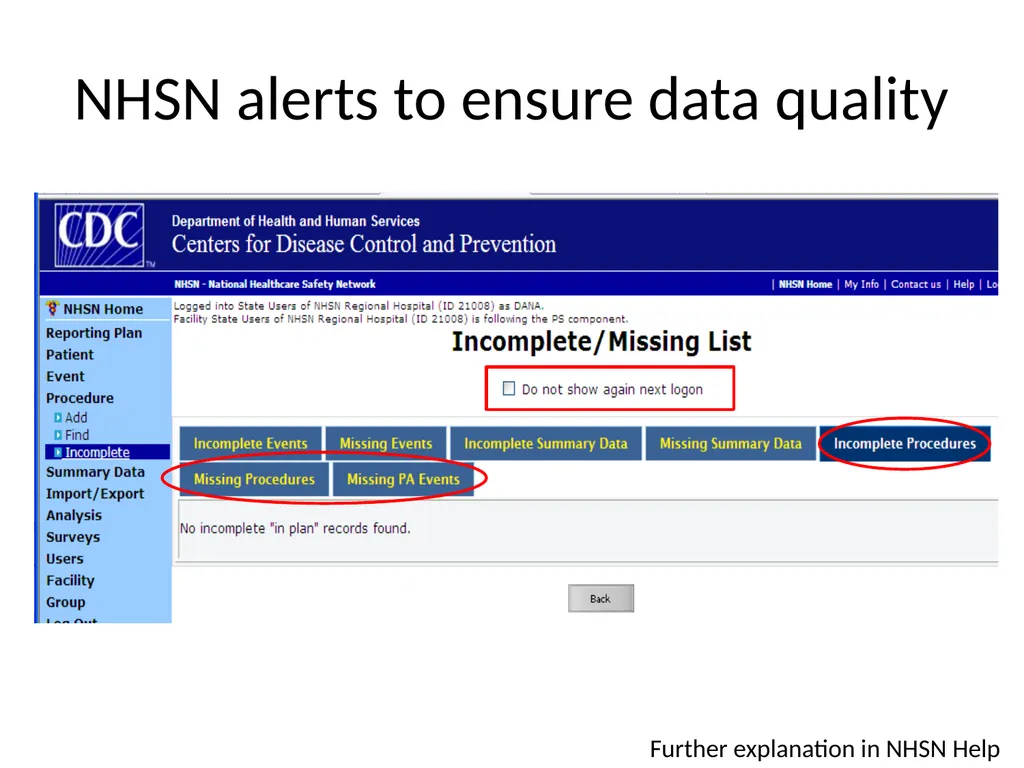
NHSN alerts to ensure data quality Further explanation in NHSN Help<br>
32
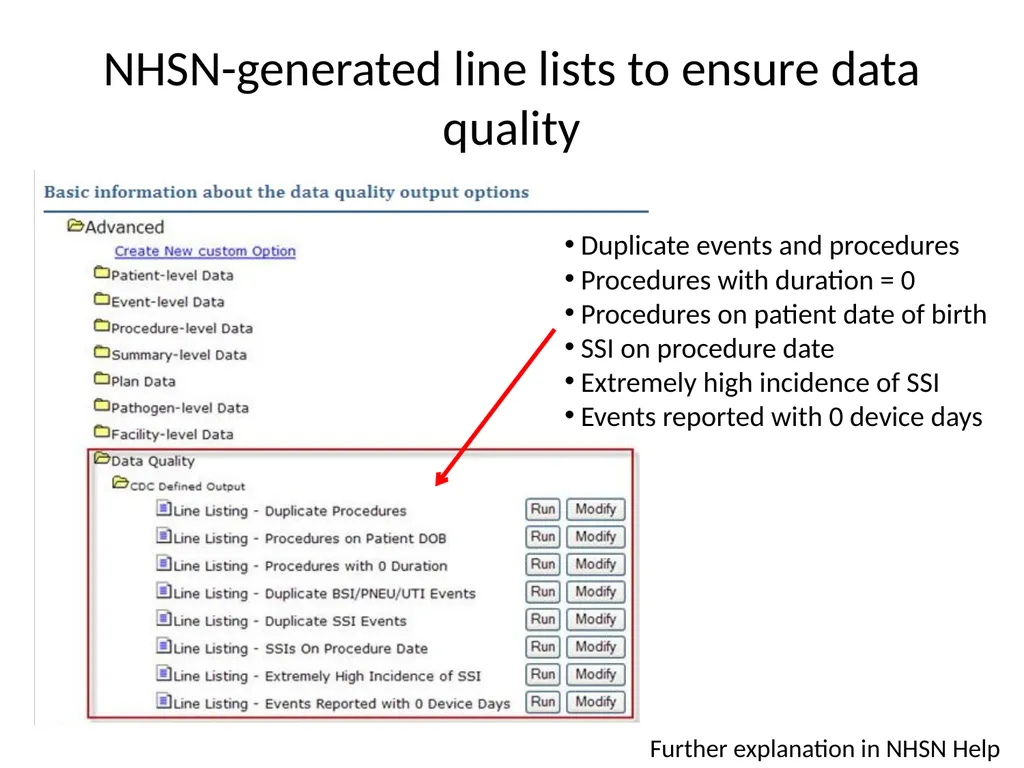
NHSN-generated line lists to ensure data quality Duplicate events and procedures
Procedures with duration = 0
Procedures on patient date of birth
SSI on procedure date
Extremely high incidence of SSI
Events reported with 0 device days Further explanation in NHSN Help<br>
Procedures with duration = 0
Procedures on patient date of birth
SSI on procedure date
Extremely high incidence of SSI
Events reported with 0 device days Further explanation in NHSN Help<br>
33
New NHSN SSI SIR Report for CMS IPPS “SIR – Complex 30-Day SSI Data for CMS IPPS”
Displays data being submitted to CMS by NHSN on behalf of facilities participating in the Inpatient Quality Reporting Program
Available in NHSN v6.6.1 (April 2012)
Navigation instructions: “Analysis” > “Output Options” > “Advanced” > “Summary Level Data” > “CDC-Defined Output”
More information available at www.cdc.gov/nhsn/library.html<br>
Displays data being submitted to CMS by NHSN on behalf of facilities participating in the Inpatient Quality Reporting Program
Available in NHSN v6.6.1 (April 2012)
Navigation instructions: “Analysis” > “Output Options” > “Advanced” > “Summary Level Data” > “CDC-Defined Output”
More information available at www.cdc.gov/nhsn/library.html<br>
34
Calculating your own SIR NHSN location rates are published and available on the NHSN website for CLABSI and CAUTI
SSI risk index data no longer published
We recommend that you use the 2006-2008 baseline rates
To be consistent with NHSN’s SIR calculation
To be able to have meaningful trended data over time
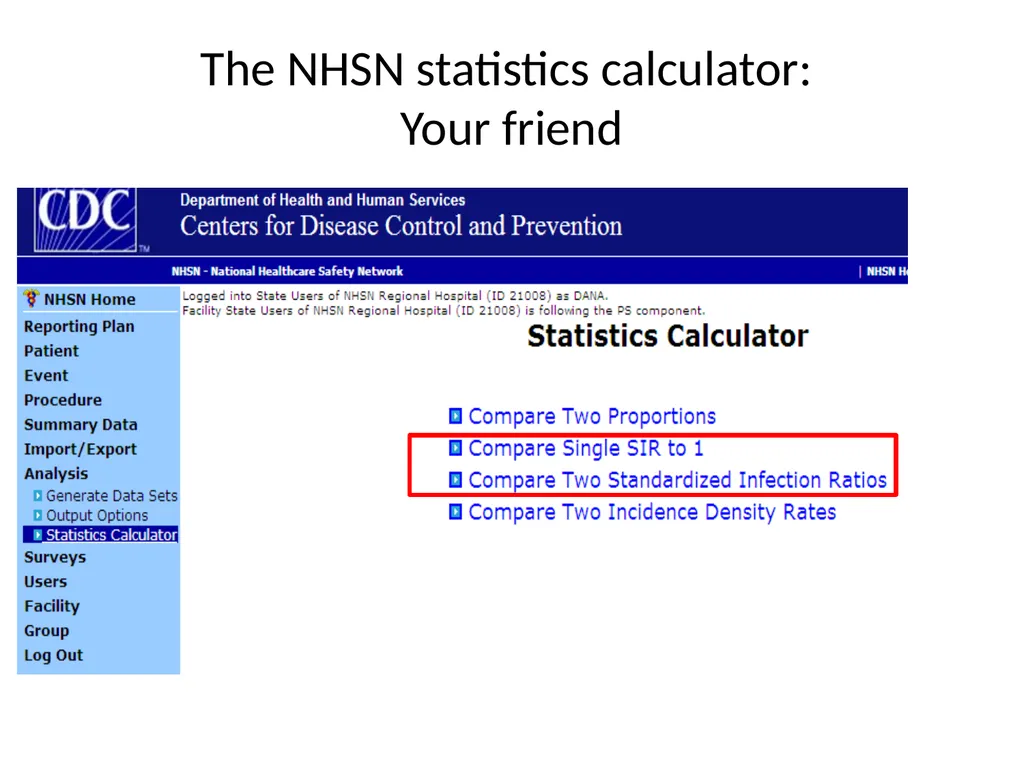
Use the NHSN statistics calculator to determine:
If the SIR is statistically significant
If the difference between two SIRs is statistically significant<br>
SSI risk index data no longer published
We recommend that you use the 2006-2008 baseline rates
To be consistent with NHSN’s SIR calculation
To be able to have meaningful trended data over time
Use the NHSN statistics calculator to determine:
If the SIR is statistically significant
If the difference between two SIRs is statistically significant<br>
35
The NHSN statistics calculator:
Your friend<br>
36
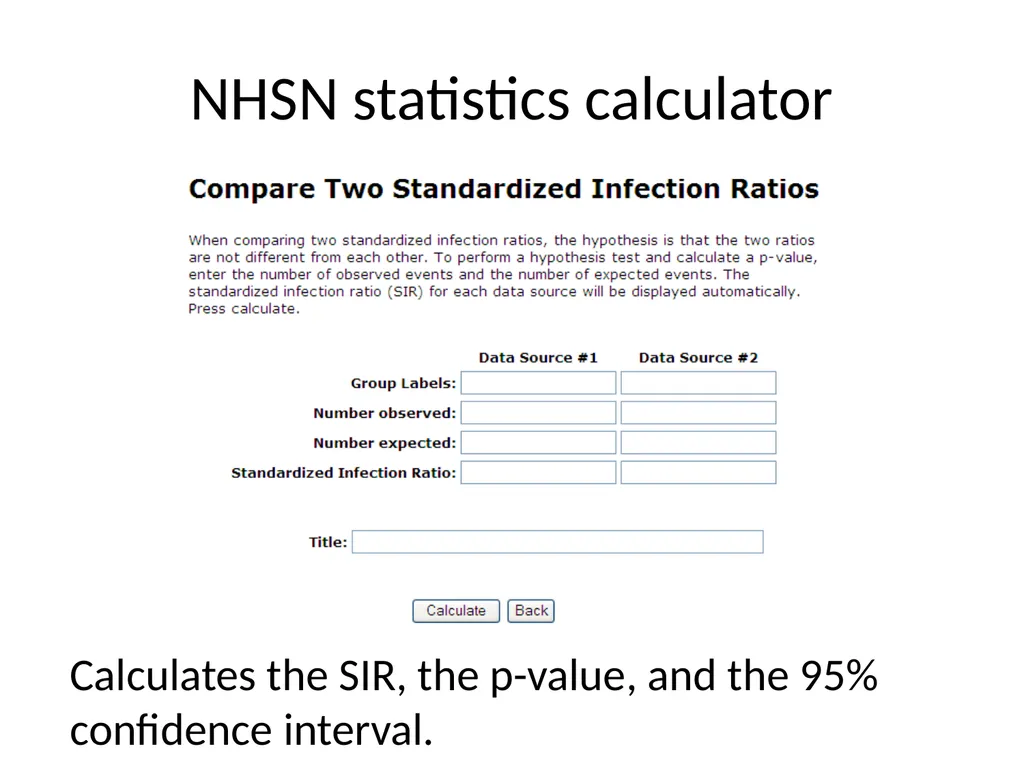
NHSN statistics calculator Calculates the SIR, the p-value, and the 95% confidence interval.<br>
37
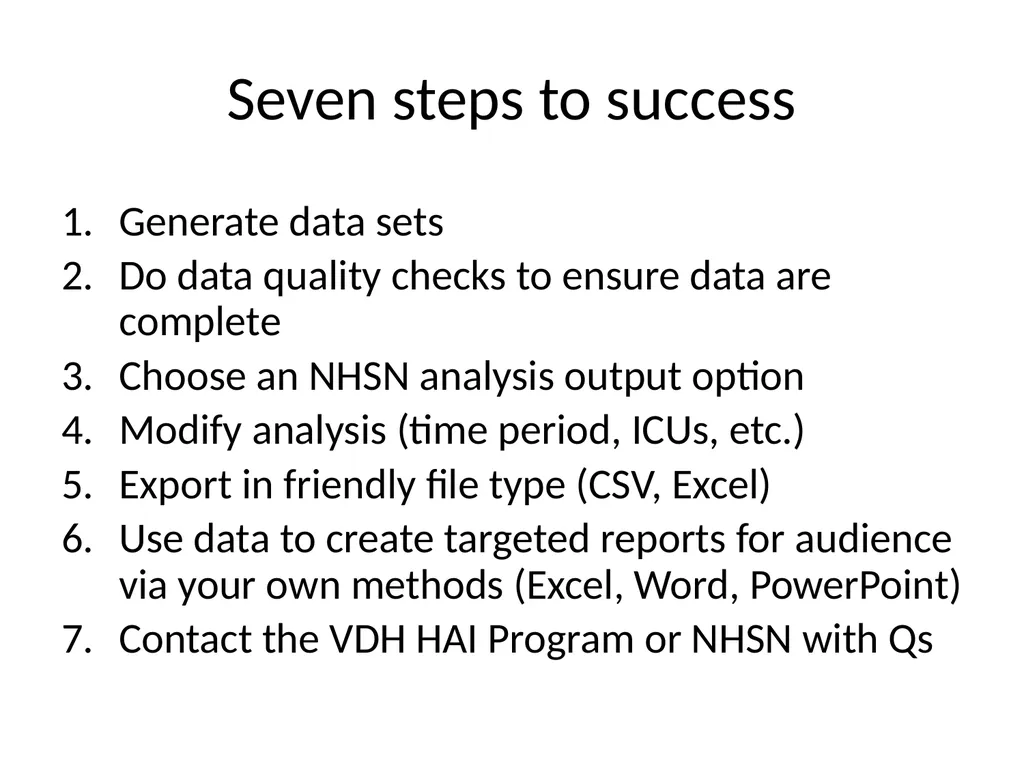
Seven steps to success Generate data sets
Do data quality checks to ensure data are complete
Choose an NHSN analysis output option
Modify analysis (time period, ICUs, etc.)
Export in friendly file type (CSV, Excel)
Use data to create targeted reports for audience via your own methods (Excel, Word, PowerPoint)
Contact the VDH HAI Program or NHSN with Qs<br>
Do data quality checks to ensure data are complete
Choose an NHSN analysis output option
Modify analysis (time period, ICUs, etc.)
Export in friendly file type (CSV, Excel)
Use data to create targeted reports for audience via your own methods (Excel, Word, PowerPoint)
Contact the VDH HAI Program or NHSN with Qs<br>
38
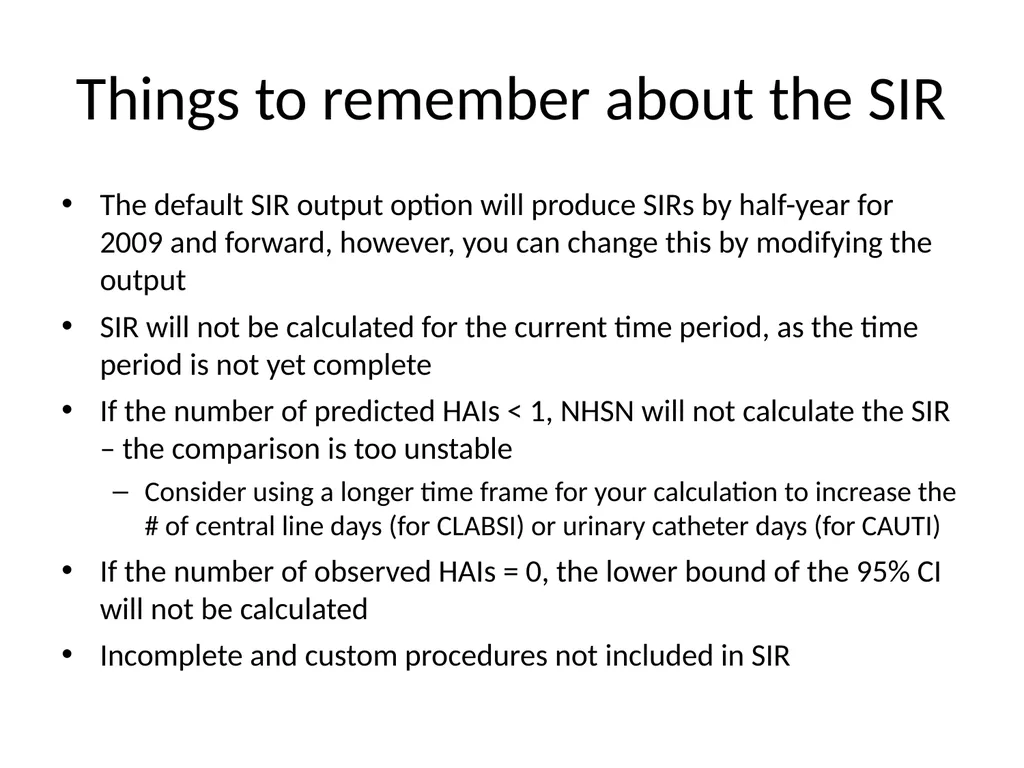
Things to remember about the SIR The default SIR output option will produce SIRs by half-year for 2009 and forward, however, you can change this by modifying the output
SIR will not be calculated for the current time period, as the time period is not yet complete
If the number of predicted HAIs < 1, NHSN will not calculate the SIR – the comparison is too unstable
Consider using a longer time frame for your calculation to increase the # of central line days (for CLABSI) or urinary catheter days (for CAUTI)
If the number of observed HAIs = 0, the lower bound of the 95% CI will not be calculated
Incomplete and custom procedures not included in SIR<br>
SIR will not be calculated for the current time period, as the time period is not yet complete
If the number of predicted HAIs < 1, NHSN will not calculate the SIR – the comparison is too unstable
Consider using a longer time frame for your calculation to increase the # of central line days (for CLABSI) or urinary catheter days (for CAUTI)
If the number of observed HAIs = 0, the lower bound of the 95% CI will not be calculated
Incomplete and custom procedures not included in SIR<br>
39
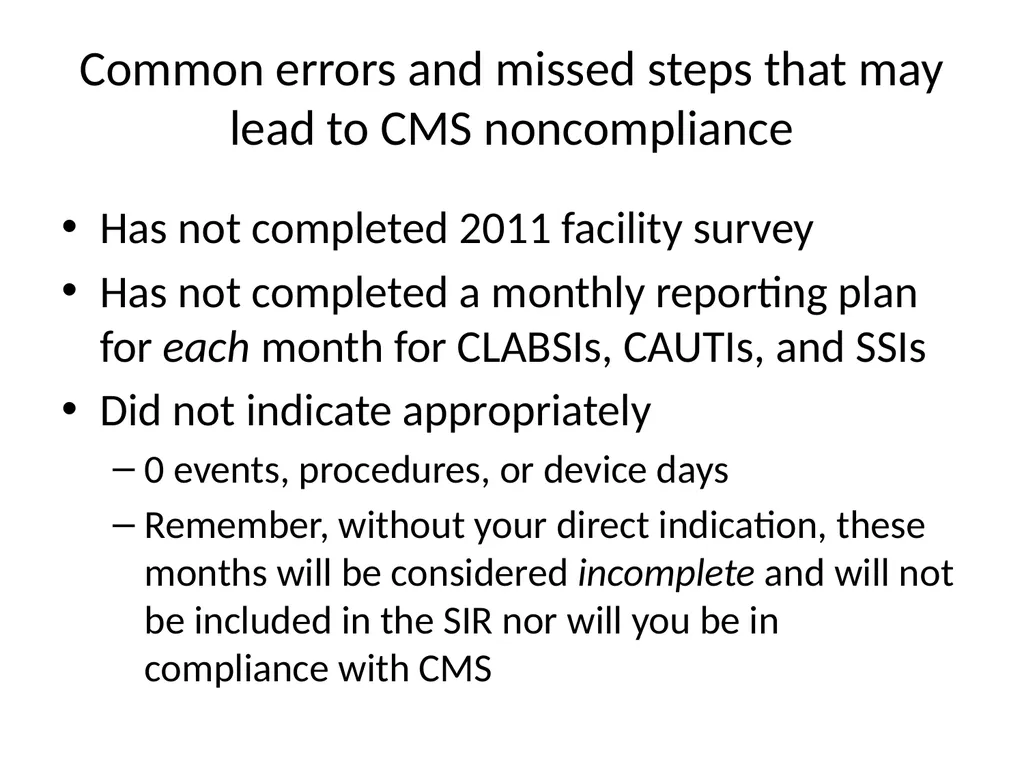
Common errors and missed steps that may lead to CMS noncompliance Has not completed 2011 facility survey
Has not completed a monthly reporting plan for each month for CLABSIs, CAUTIs, and SSIs
Did not indicate appropriately
0 events, procedures, or device days
Remember, without your direct indication, these months will be considered incomplete and will not be included in the SIR nor will you be in compliance with CMS<br>
Has not completed a monthly reporting plan for each month for CLABSIs, CAUTIs, and SSIs
Did not indicate appropriately
0 events, procedures, or device days
Remember, without your direct indication, these months will be considered incomplete and will not be included in the SIR nor will you be in compliance with CMS<br>
40
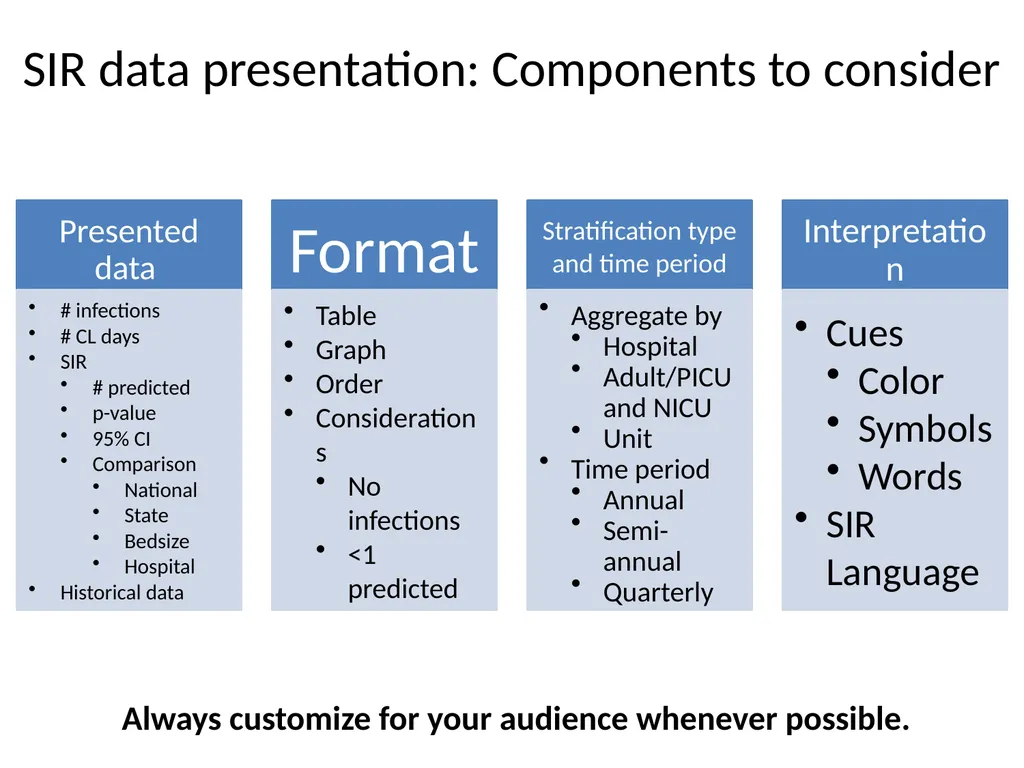
SIR data presentation: Components to consider Always customize for your audience whenever possible.<br>
41
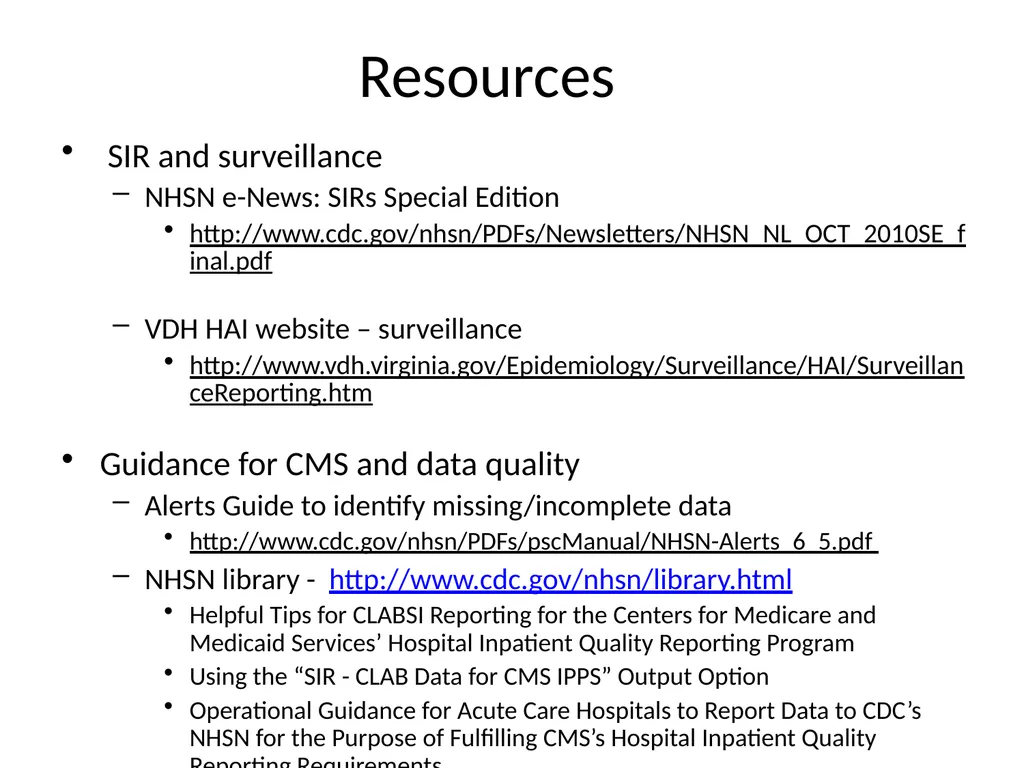
Resources SIR and surveillance
NHSN e-News: SIRs Special Edition
http://www.cdc.gov/nhsn/PDFs/Newsletters/NHSN_NL_OCT_2010SE_final.pdf
VDH HAI website – surveillance
http://www.vdh.virginia.gov/Epidemiology/Surveillance/HAI/SurveillanceReporting.htm
Guidance for CMS and data quality
Alerts Guide to identify missing/incomplete data
http://www.cdc.gov/nhsn/PDFs/pscManual/NHSN-Alerts_6_5.pdf
NHSN library - http://www.cdc.gov/nhsn/library.html
Helpful Tips for CLABSI Reporting for the Centers for Medicare and Medicaid Services’ Hospital Inpatient Quality Reporting Program
Using the “SIR - CLAB Data for CMS IPPS” Output Option
Operational Guidance for Acute Care Hospitals to Report Data to CDC’s NHSN for the Purpose of Fulfilling CMS’s Hospital Inpatient Quality Reporting Requirements<br>
NHSN e-News: SIRs Special Edition
http://www.cdc.gov/nhsn/PDFs/Newsletters/NHSN_NL_OCT_2010SE_final.pdf
VDH HAI website – surveillance
http://www.vdh.virginia.gov/Epidemiology/Surveillance/HAI/SurveillanceReporting.htm
Guidance for CMS and data quality
Alerts Guide to identify missing/incomplete data
http://www.cdc.gov/nhsn/PDFs/pscManual/NHSN-Alerts_6_5.pdf
NHSN library - http://www.cdc.gov/nhsn/library.html
Helpful Tips for CLABSI Reporting for the Centers for Medicare and Medicaid Services’ Hospital Inpatient Quality Reporting Program
Using the “SIR - CLAB Data for CMS IPPS” Output Option
Operational Guidance for Acute Care Hospitals to Report Data to CDC’s NHSN for the Purpose of Fulfilling CMS’s Hospital Inpatient Quality Reporting Requirements<br>
42
Thank you! Dana.Burshell@vdh.virginia.gov 804-864-7550
Andrea.Alvarez@vdh.virginia.gov 804-864-8097<br>
Andrea.Alvarez@vdh.virginia.gov 804-864-8097<br>
43
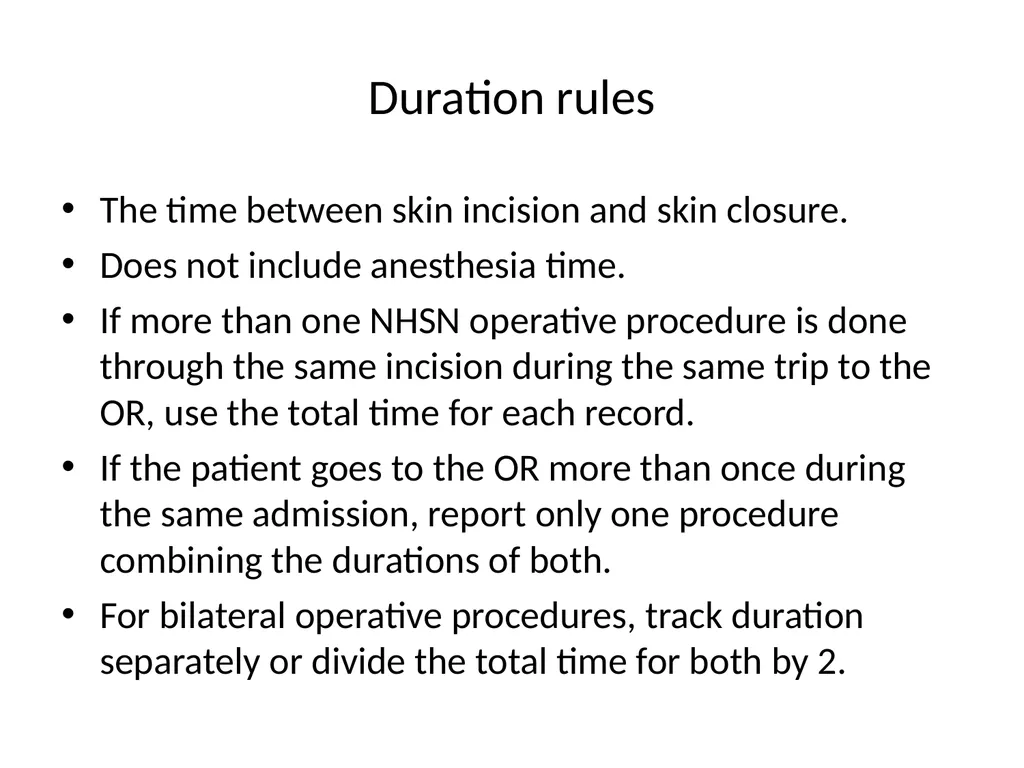
Duration rules The time between skin incision and skin closure.
Does not include anesthesia time.
If more than one NHSN operative procedure is done through the same incision during the same trip to the OR, use the total time for each record.
If the patient goes to the OR more than once during the same admission, report only one procedure combining the durations of both.
For bilateral operative procedures, track duration separately or divide the total time for both by 2.<br>
Does not include anesthesia time.
If more than one NHSN operative procedure is done through the same incision during the same trip to the OR, use the total time for each record.
If the patient goes to the OR more than once during the same admission, report only one procedure combining the durations of both.
For bilateral operative procedures, track duration separately or divide the total time for both by 2.<br>
44
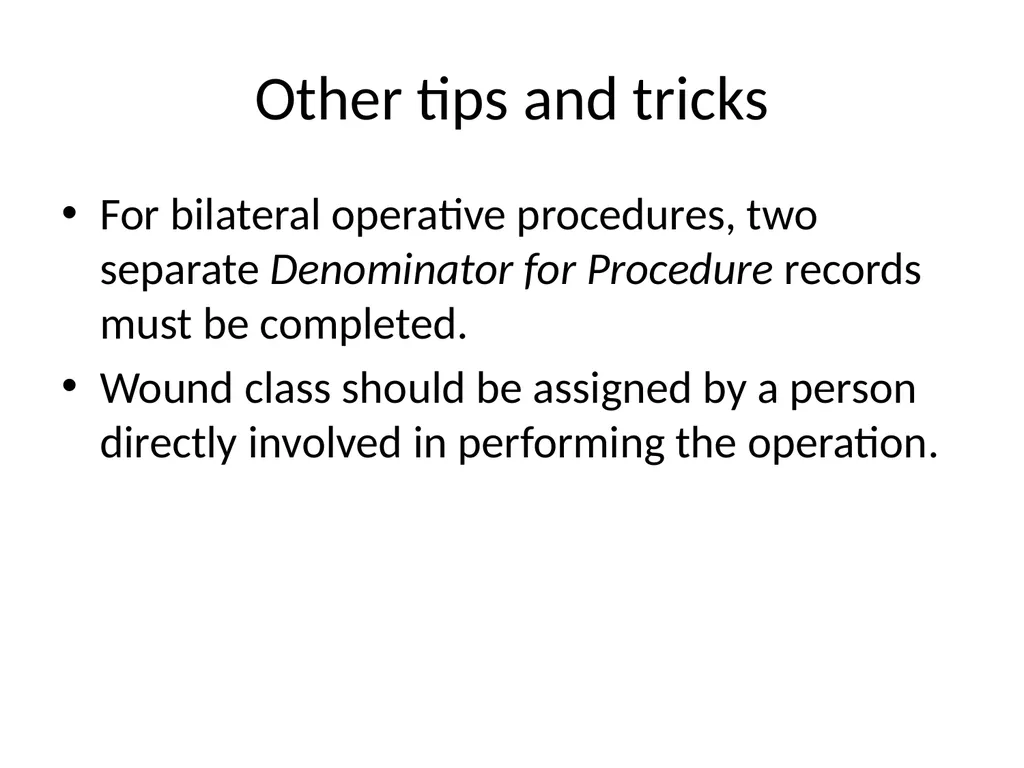
Other tips and tricks For bilateral operative procedures, two separate Denominator for Procedure records must be completed.
Wound class should be assigned by a person directly involved in performing the operation.<br>
Wound class should be assigned by a person directly involved in performing the operation.<br>