
Slide 1 Tutorial: Optimal Learning in the
Description: Slide 1 Tutorial: Optimal Learning in the Laboratory Sciences Building a belief model December 10, 2014 Warren B. Powell Kris Reyes Si Chen Princeton University http:www.castlelab.princeton.edu Slide 1 2010 Warren B. Powell Slide 2
Related Topics
Download Presentation
"Slide 1 Tutorial: Optimal Learning in the" is the property of its rightful owner. Permission is granted to download and print the materials on this website for personal, non-commercial use only, and to display it on your personal computer provided you do not modify the materials and that you retain all copyright notices contained in the materials. By downloading content from our website, you accept the terms of this agreement.
Presentation Transcript
slide1. Slide 1 Tutorial:
Optimal Learning in the Laboratory Sciences
Building a belief model
December 10, 2014 Warren B. Powell
Kris Reyes
Si Chen
Princeton University
http://www.castlelab.princeton.edu Slide 1<br>
slide2. © 2010 Warren B. Powell Slide 2 Lecture outline Slide 2 Building a belief model<br>
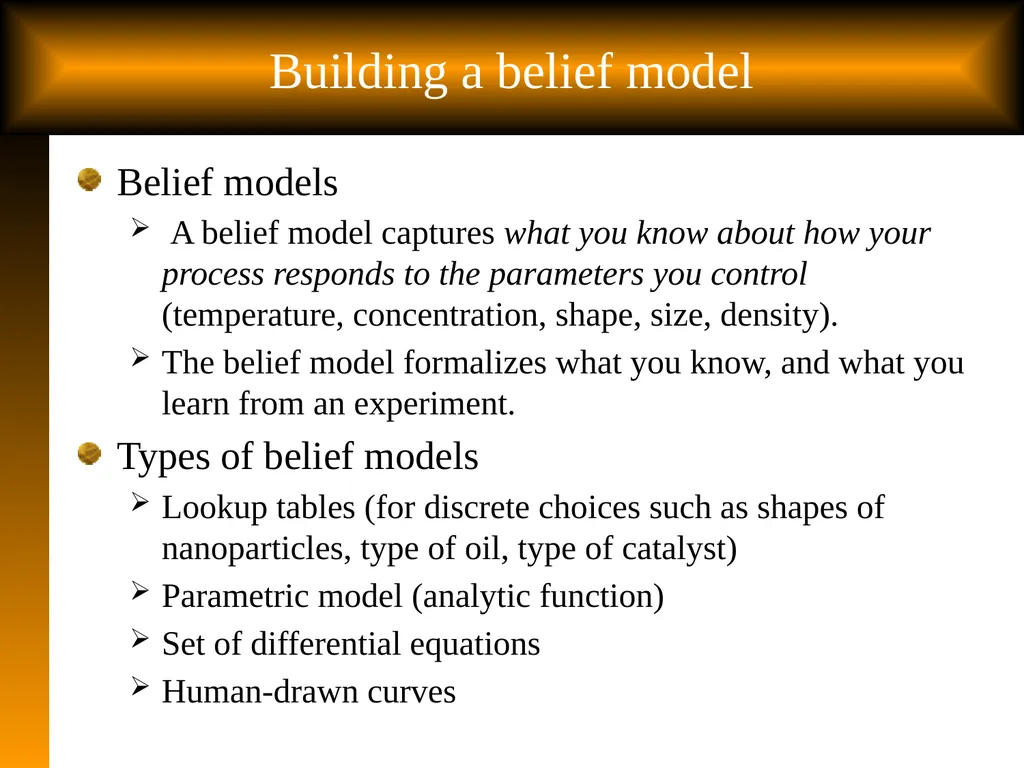
slide3. Building a belief model Belief models
A belief model captures what you know about how your process responds to the parameters you control (temperature, concentration, shape, size, density).
The belief model formalizes what you know, and what you learn from an experiment.
Types of belief models
Lookup tables (for discrete choices such as shapes of nanoparticles, type of oil, type of catalyst)
Parametric model (analytic function)
Set of differential equations
Human-drawn curves 3<br>
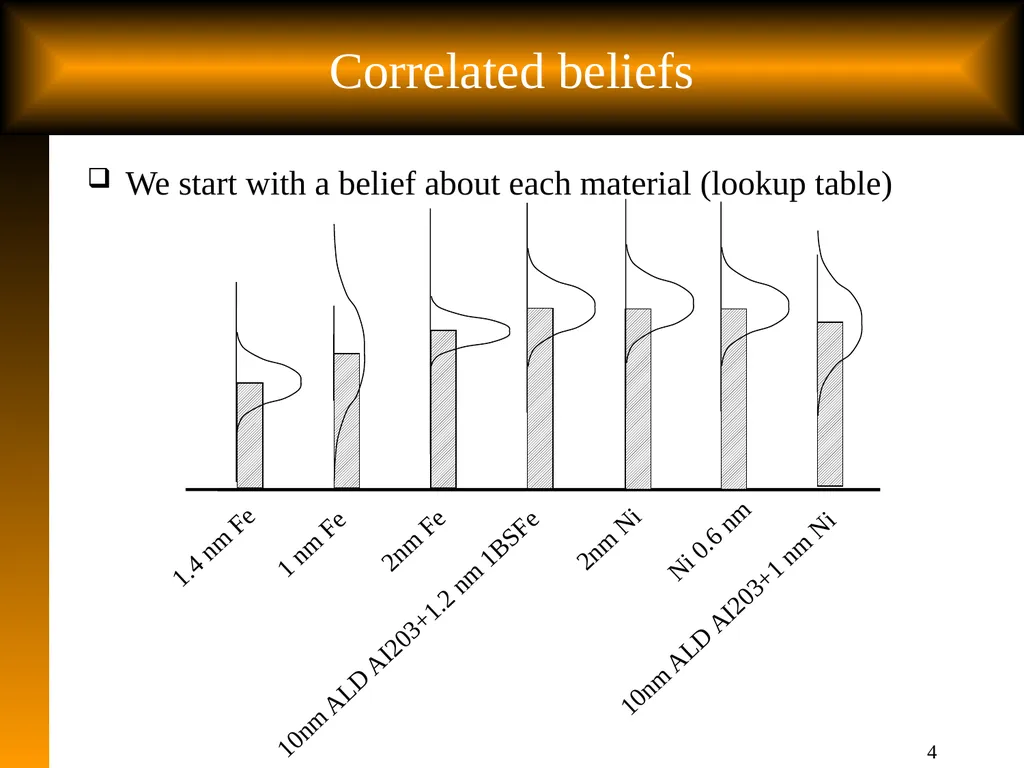
slide4. 4 4 Correlated beliefs We start with a belief about each material (lookup table) 1 2 3 4 4 5 1.4 nm Fe 1 nm Fe 10nm ALD AI203+1.2 nm 1BSFe 2nm Fe Ni 0.6 nm 10nm ALD AI203+1 nm Ni 2nm Ni<br>
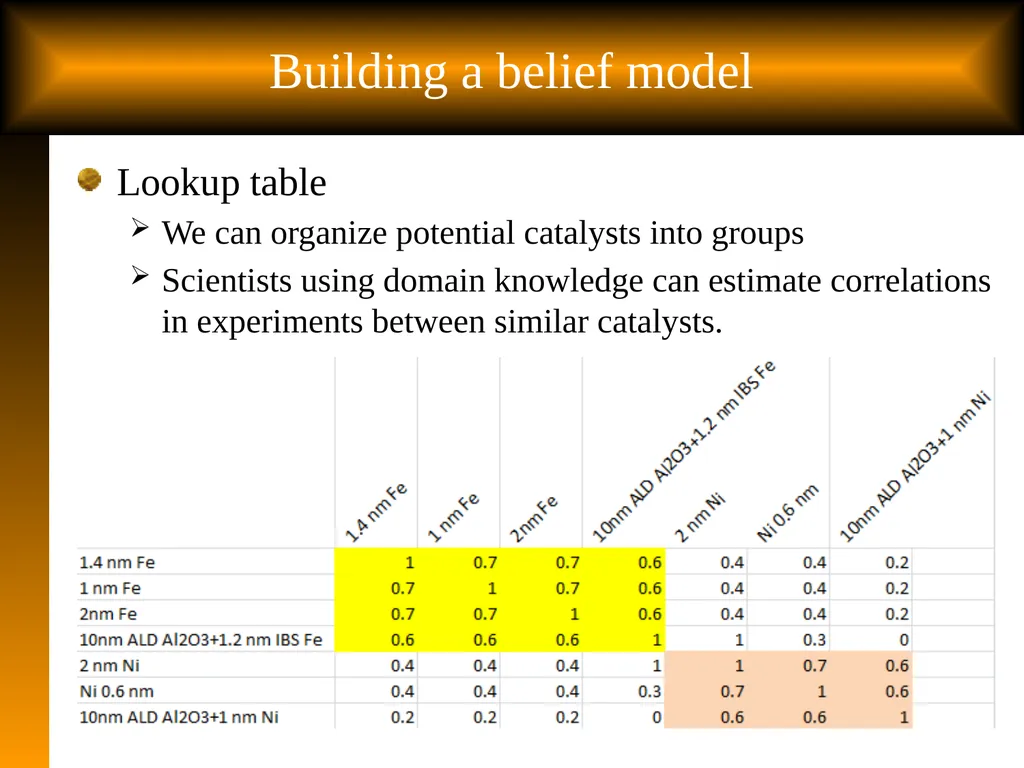
slide5. Building a belief model Lookup table
We can organize potential catalysts into groups
Scientists using domain knowledge can estimate correlations in experiments between similar catalysts. 5<br>
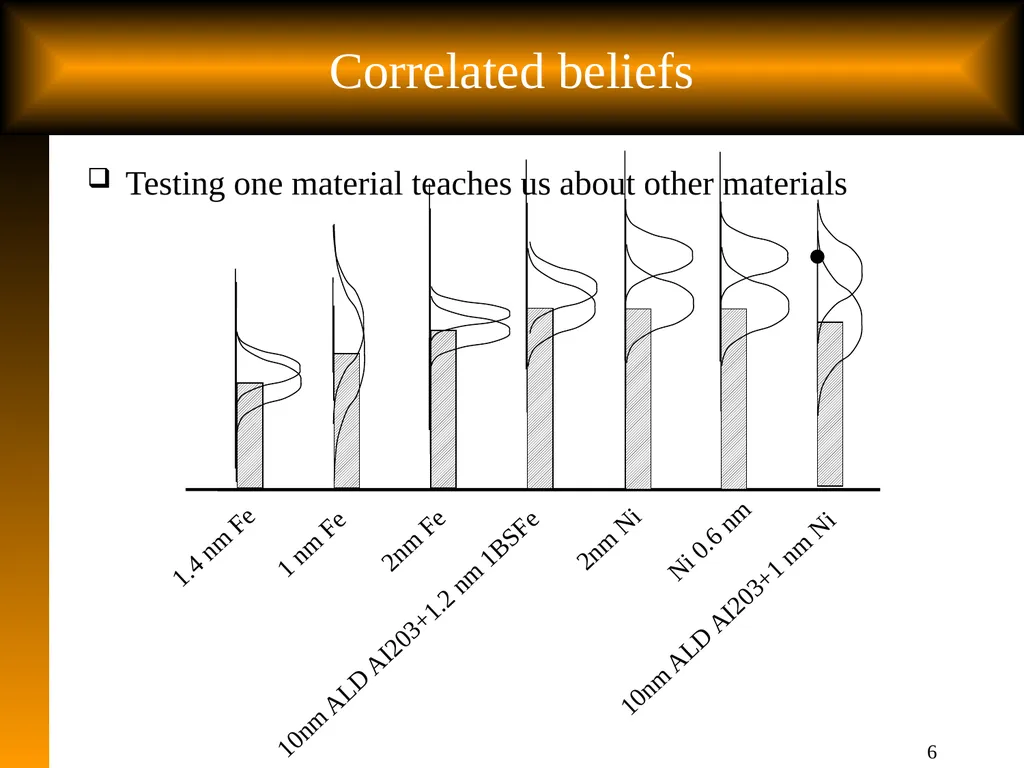
slide6. 6 6 Correlated beliefs Testing one material teaches us about other materials 1 2 3 4 4 5 1.4 nm Fe 1 nm Fe 10nm ALD AI203+1.2 nm 1BSFe 2nm Fe Ni 0.6 nm 10nm ALD AI203+1 nm Ni 2nm Ni<br>
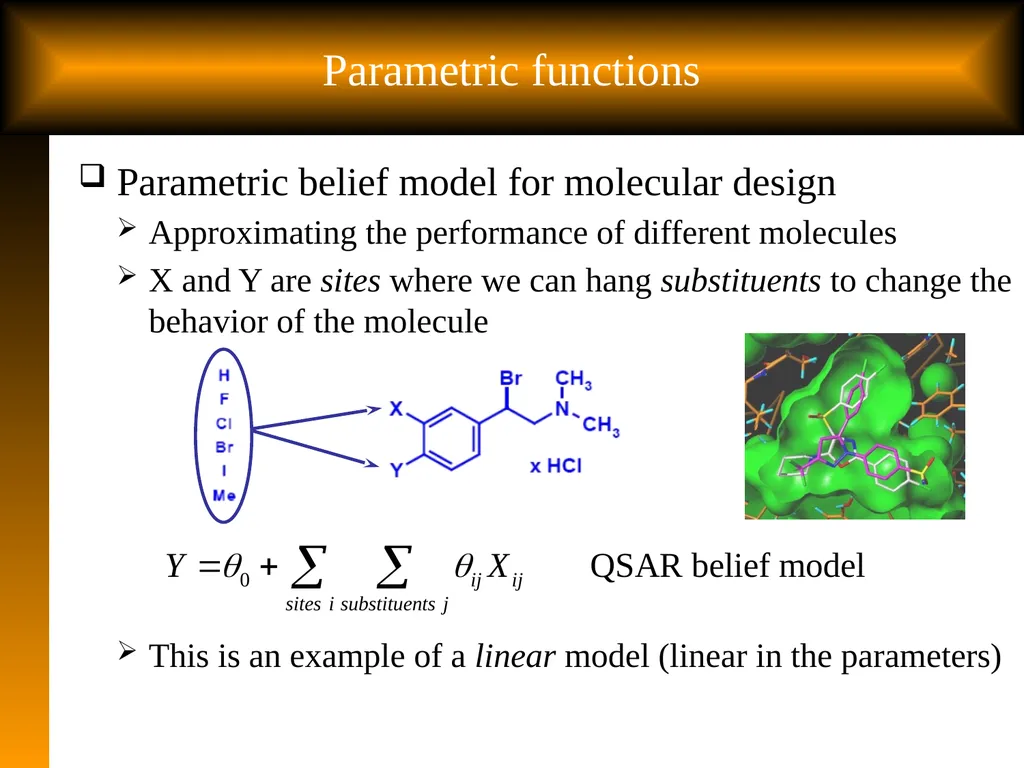
slide7. 7 Parametric functions Parametric belief model for molecular design
Approximating the performance of different molecules
X and Y are sites where we can hang substituents to change the behavior of the molecule
This is an example of a linear model (linear in the parameters)<br>
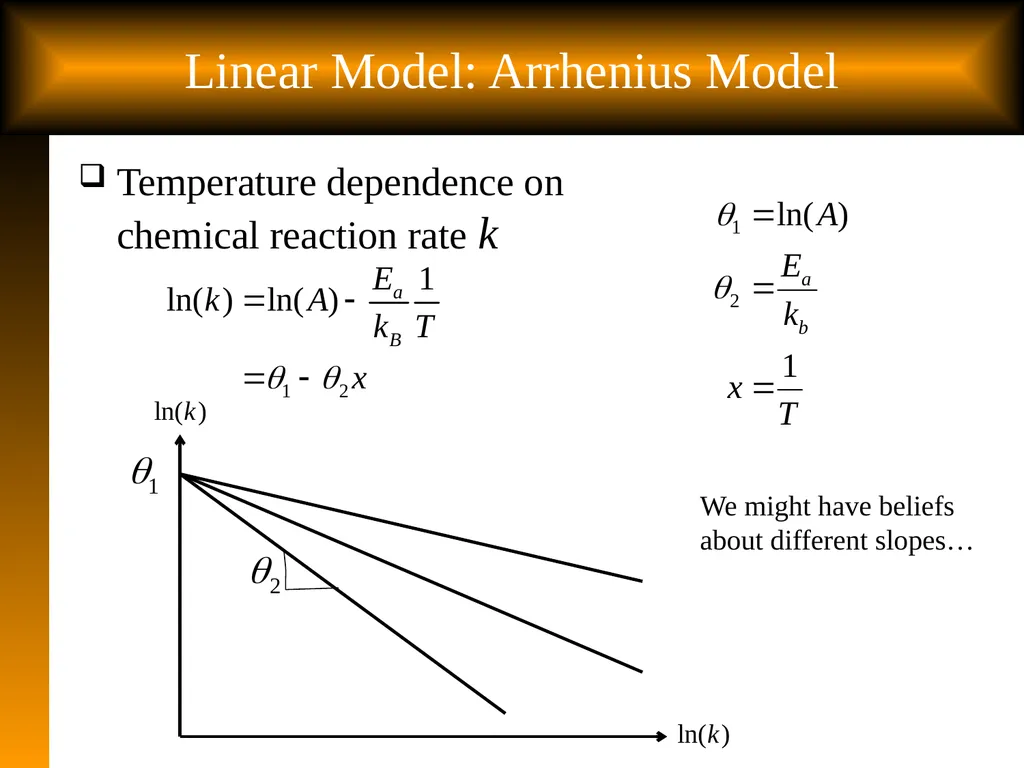
slide8. Linear Model: Arrhenius Model Temperature dependence on chemical reaction rate k We might have beliefs about different slopes…<br>
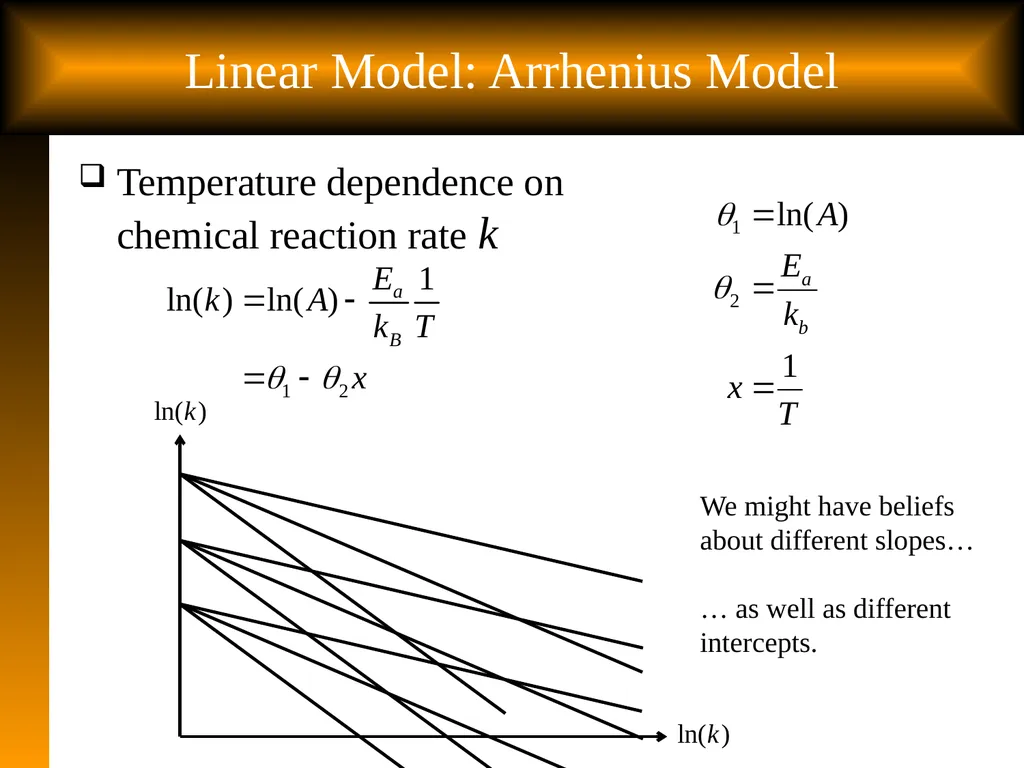
slide9. Linear Model: Arrhenius Model Temperature dependence on chemical reaction rate k We might have beliefs about different slopes…
… as well as different intercepts.<br>
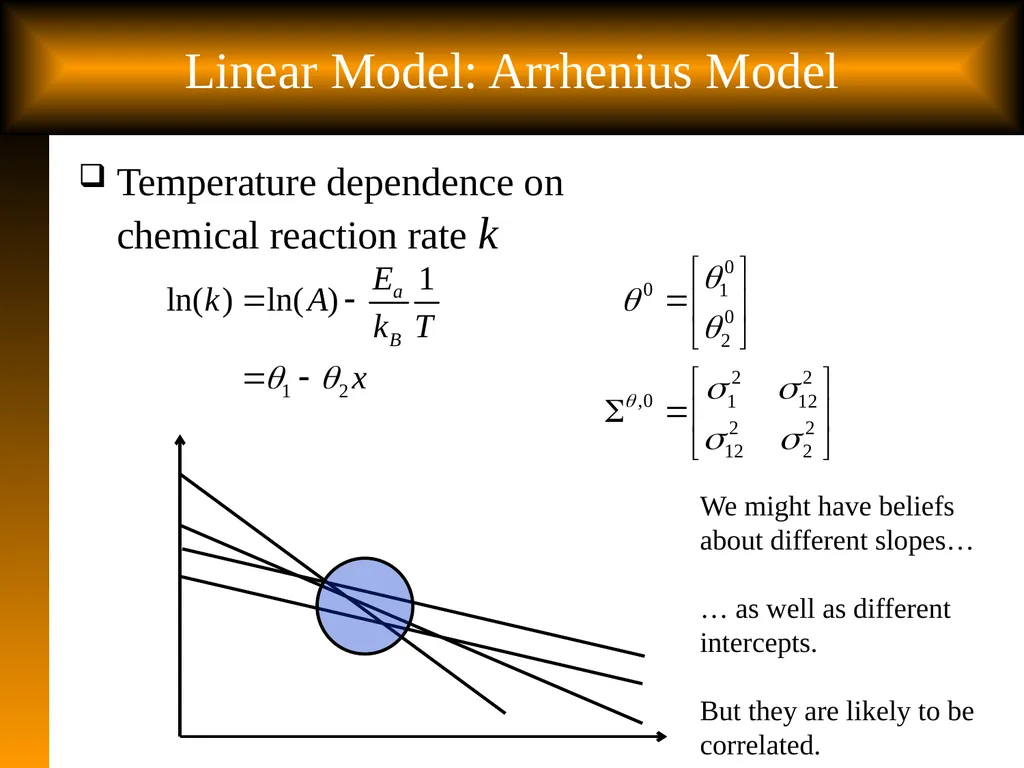
slide10. Linear Model: Arrhenius Model Temperature dependence on chemical reaction rate k We might have beliefs about different slopes…
… as well as different intercepts.
But they are likely to be correlated.<br>
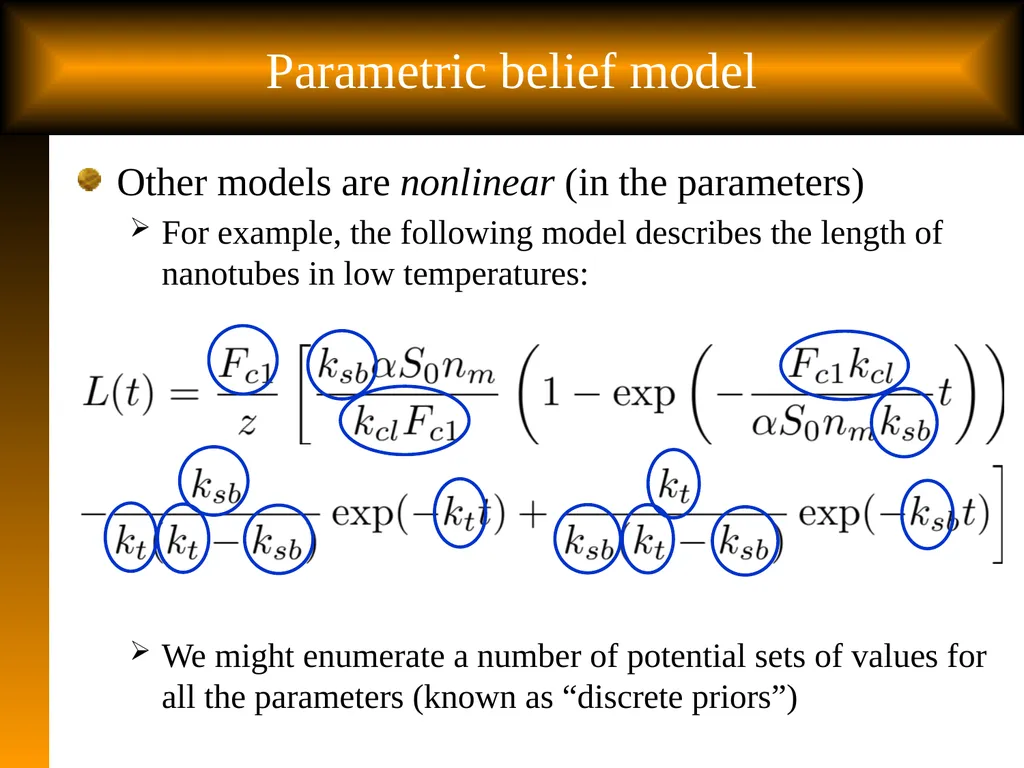
slide11. Parametric belief model Other models are nonlinear (in the parameters)
For example, the following model describes the length of nanotubes in low temperatures:
We might enumerate a number of potential sets of values for all the parameters (known as “discrete priors”)<br>
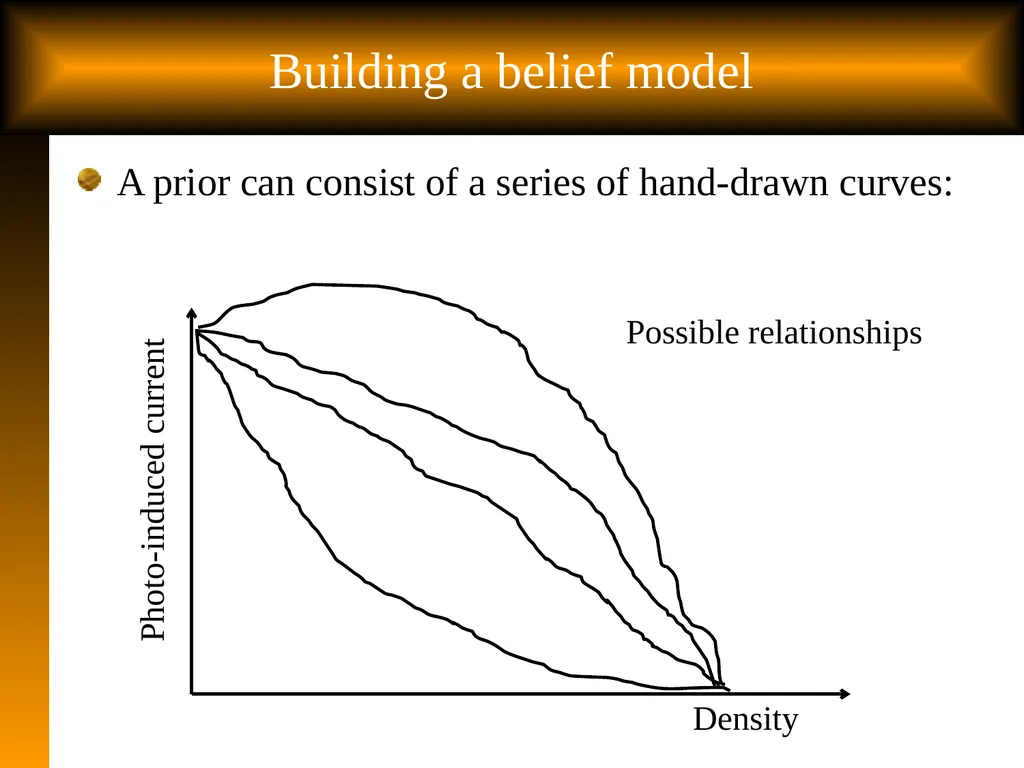
slide12. Building a belief model A prior can consist of a series of hand-drawn curves: 12 Density Photo-induced current Possible relationships<br>
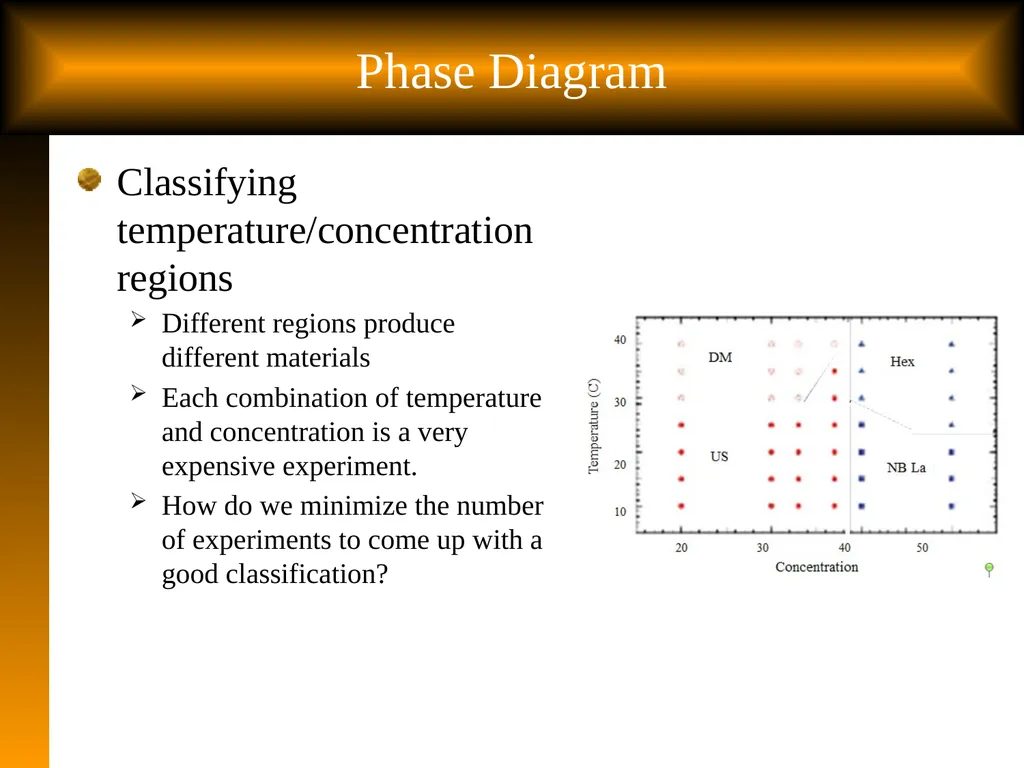
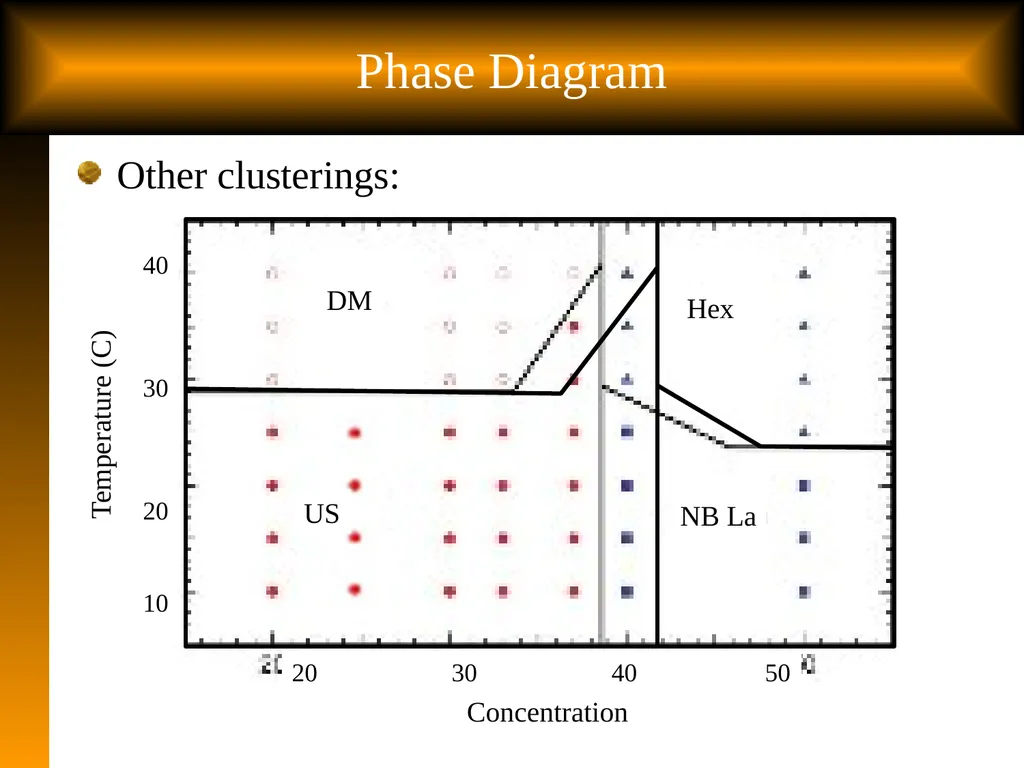
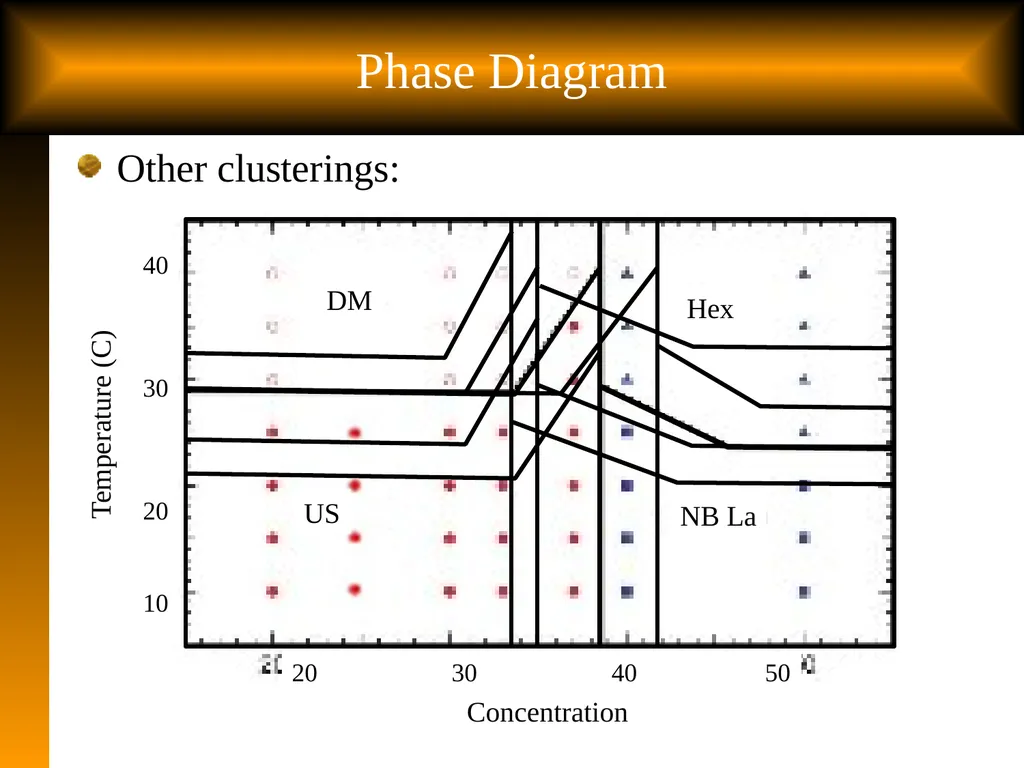
slide13. Phase Diagram Classifying temperature/concentration regions
Different regions produce different materials
Each combination of temperature and concentration is a very expensive experiment.
How do we minimize the number of experiments to come up with a good classification? 13<br>
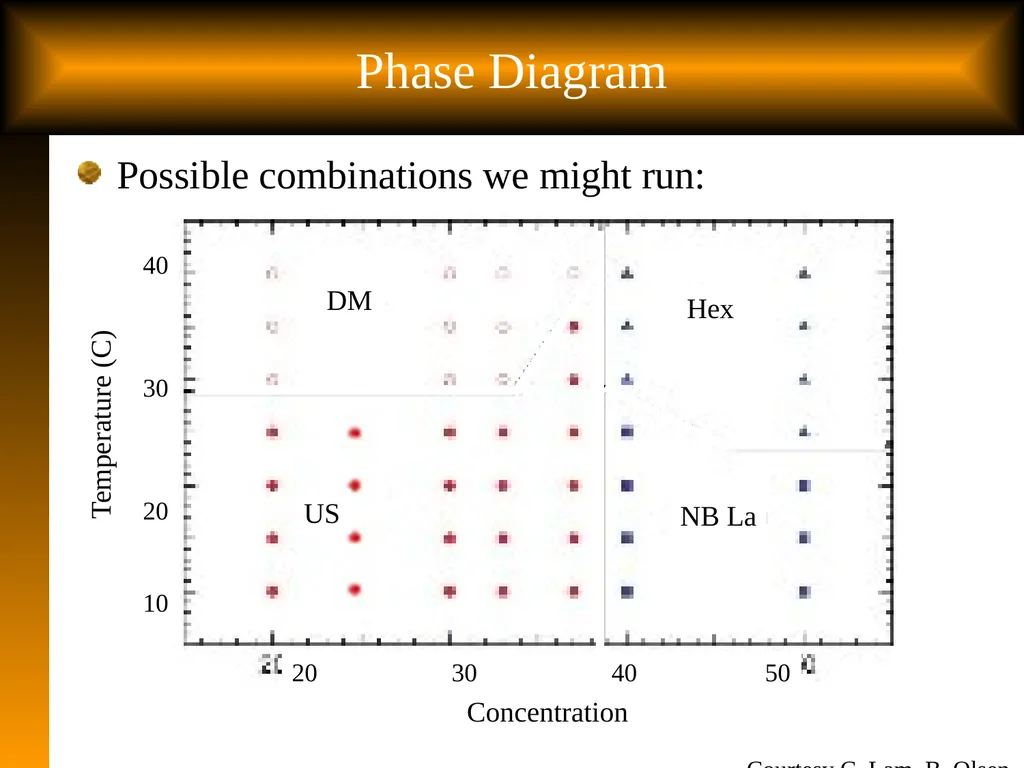
slide14. DM Hex NB La 20 30 40 50 40
30
20
10 Temperature (C) Concentration Phase Diagram Courtesy C. Lam, B. Olsen Possible combinations we might run: US<br>
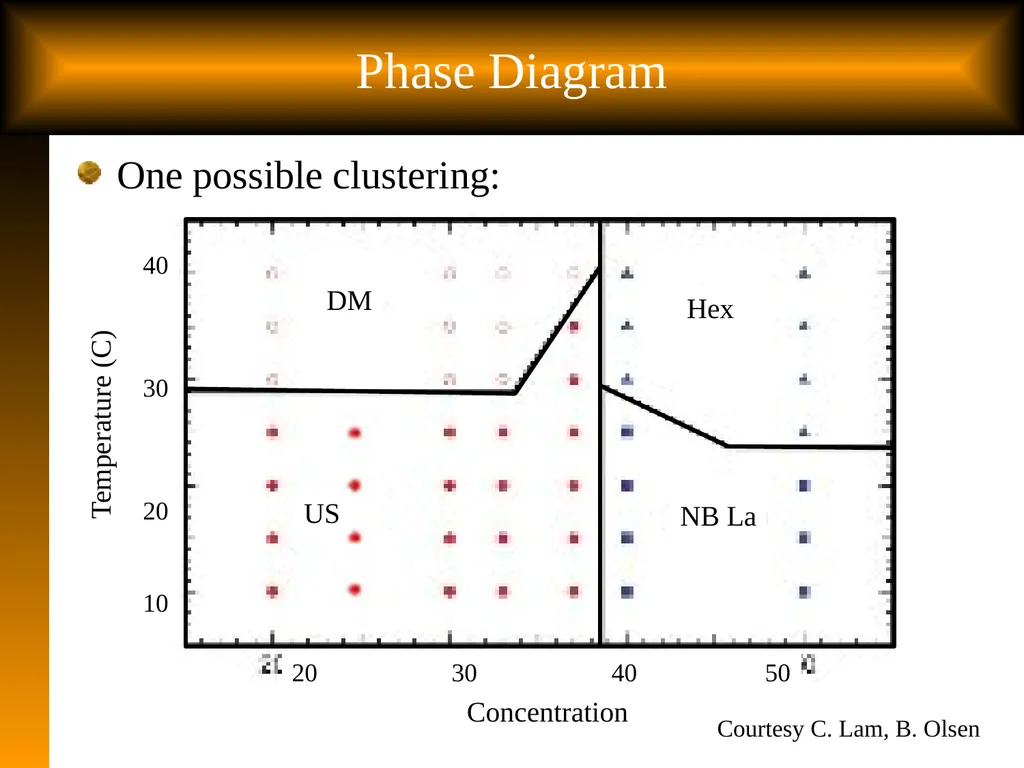
slide15. Phase Diagram Courtesy C. Lam, B. Olsen One possible clustering: US<br>
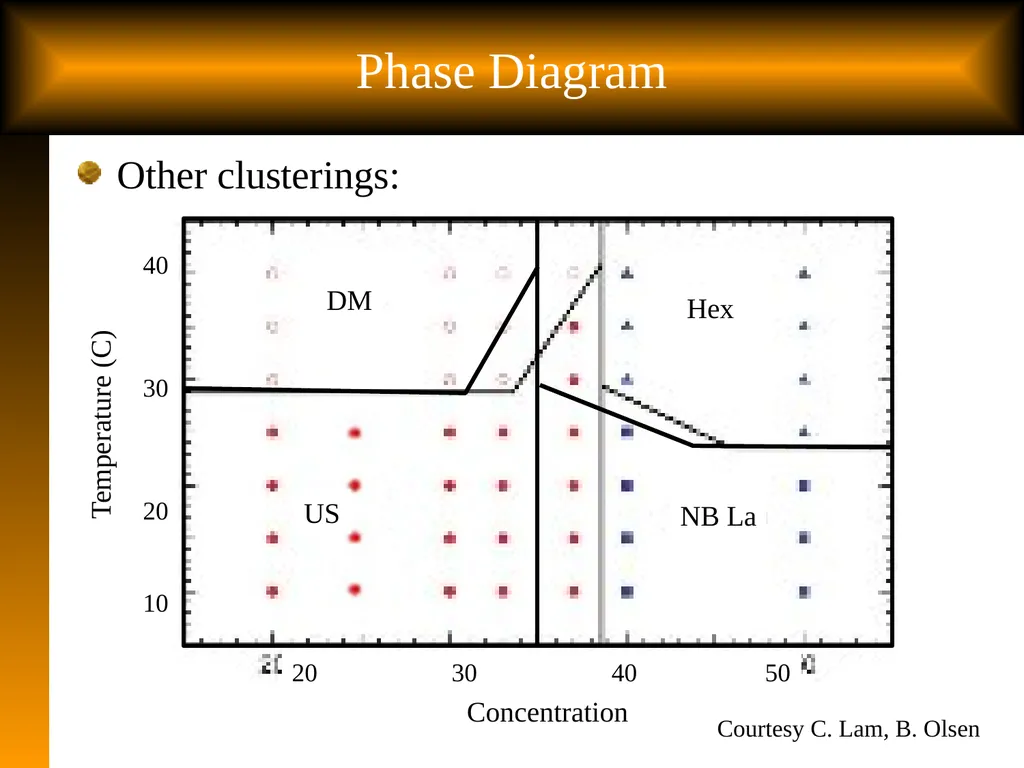
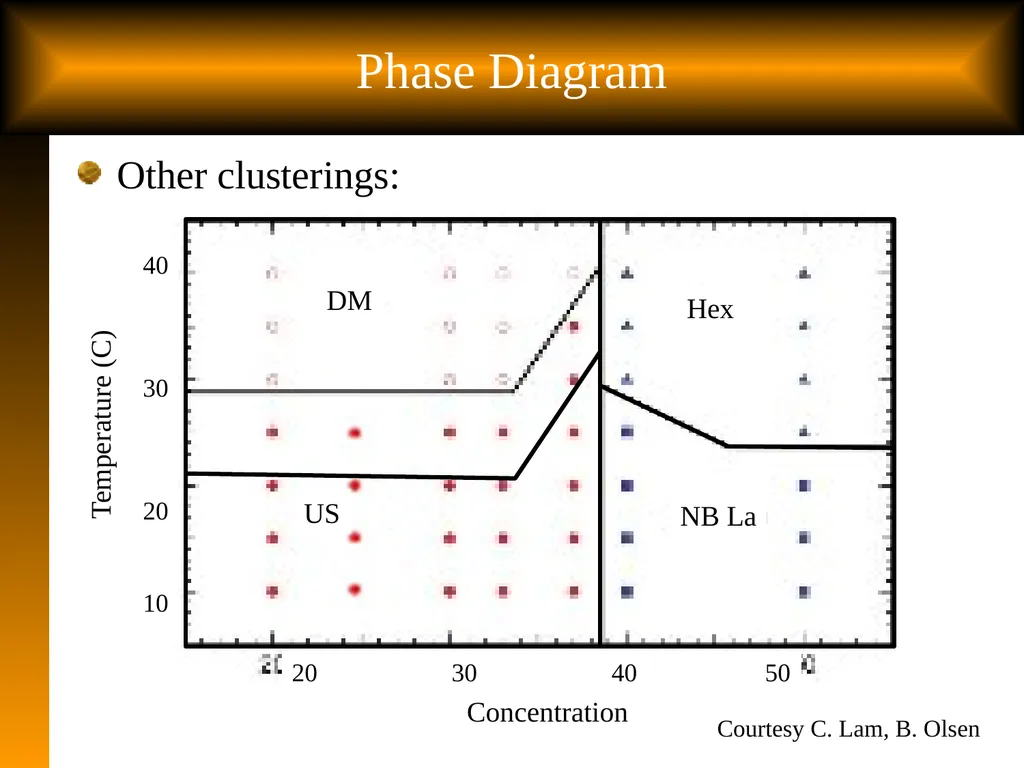
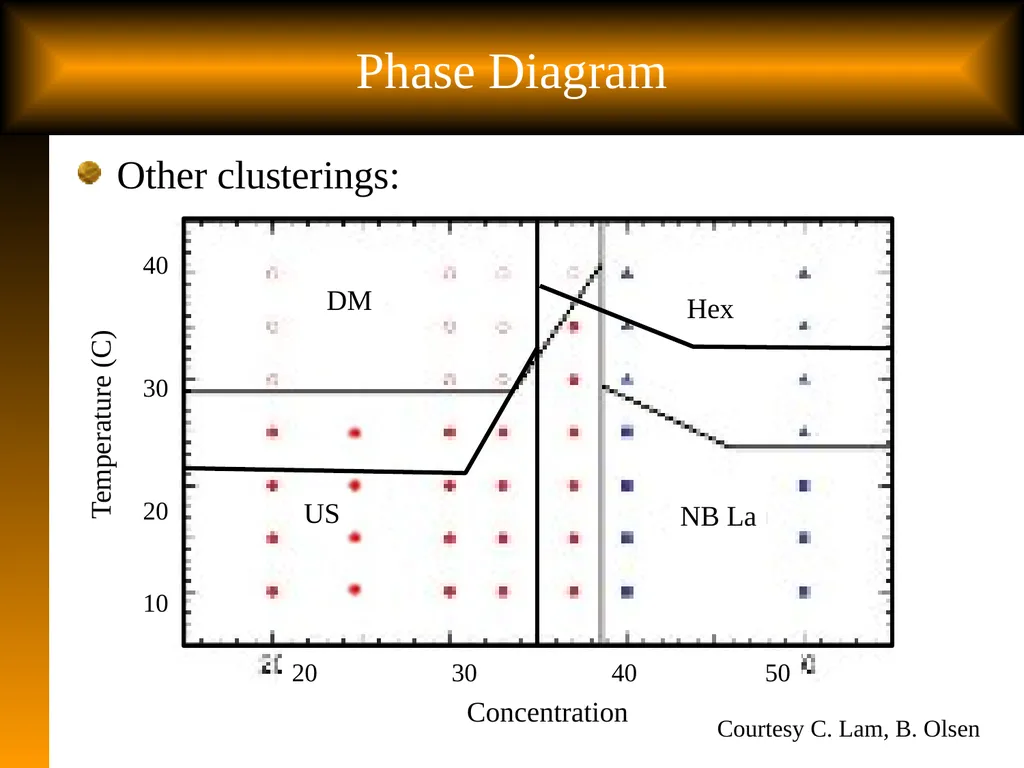
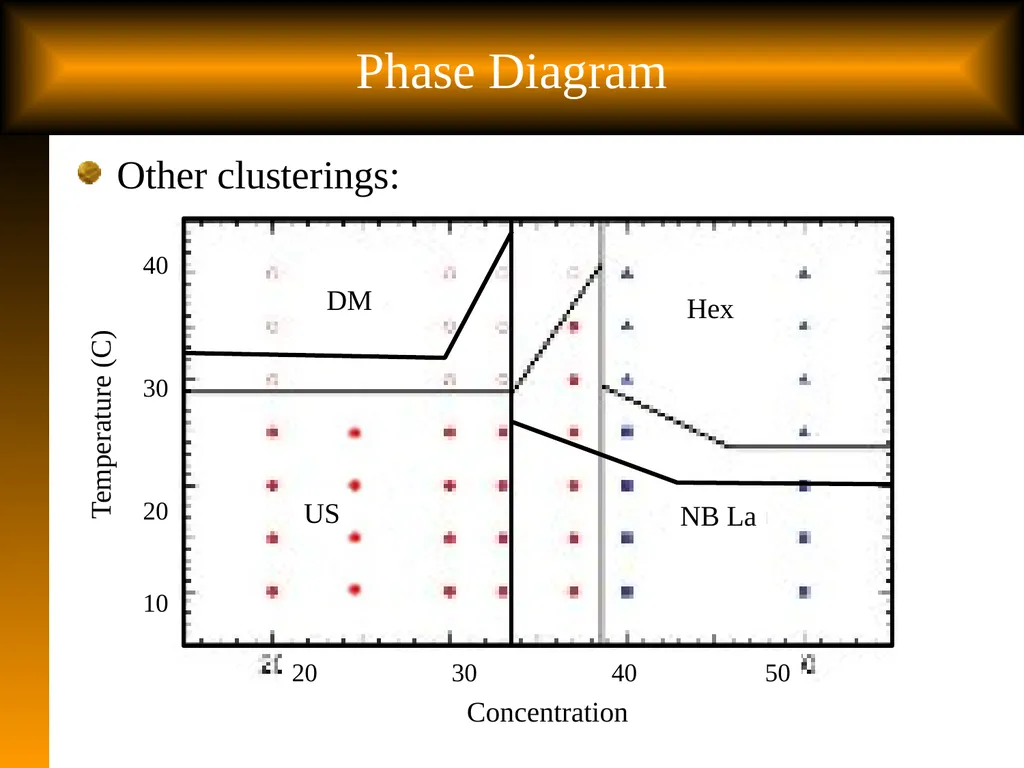
slide16. Phase Diagram Courtesy C. Lam, B. Olsen Other clusterings: US<br>
slide17. Phase Diagram Courtesy C. Lam, B. Olsen Other clusterings: US<br>
slide18. Phase Diagram Courtesy C. Lam, B. Olsen Other clusterings: US<br>
slide19. Phase Diagram Other clusterings: US<br>
slide20. Phase Diagram Other clusterings: US<br>
slide21. Phase Diagram Other clusterings: US<br>
slide22. Building a belief model For each belief model:
We need to be able to compute the best possible design given our current set of beliefs (known as the prior)
We need to understand the possible outcomes of each experiment that we might want to run.
We then need to know how to update our belief model. This will give us a range of possible posteriors.
Finally, we need to compute the best possible design for each possible prior. 22<br>
Optimal Learning in the Laboratory Sciences
Building a belief model
December 10, 2014 Warren B. Powell
Kris Reyes
Si Chen
Princeton University
http://www.castlelab.princeton.edu Slide 1<br>
slide2. © 2010 Warren B. Powell Slide 2 Lecture outline Slide 2 Building a belief model<br>
slide3. Building a belief model Belief models
A belief model captures what you know about how your process responds to the parameters you control (temperature, concentration, shape, size, density).
The belief model formalizes what you know, and what you learn from an experiment.
Types of belief models
Lookup tables (for discrete choices such as shapes of nanoparticles, type of oil, type of catalyst)
Parametric model (analytic function)
Set of differential equations
Human-drawn curves 3<br>
slide4. 4 4 Correlated beliefs We start with a belief about each material (lookup table) 1 2 3 4 4 5 1.4 nm Fe 1 nm Fe 10nm ALD AI203+1.2 nm 1BSFe 2nm Fe Ni 0.6 nm 10nm ALD AI203+1 nm Ni 2nm Ni<br>
slide5. Building a belief model Lookup table
We can organize potential catalysts into groups
Scientists using domain knowledge can estimate correlations in experiments between similar catalysts. 5<br>
slide6. 6 6 Correlated beliefs Testing one material teaches us about other materials 1 2 3 4 4 5 1.4 nm Fe 1 nm Fe 10nm ALD AI203+1.2 nm 1BSFe 2nm Fe Ni 0.6 nm 10nm ALD AI203+1 nm Ni 2nm Ni<br>
slide7. 7 Parametric functions Parametric belief model for molecular design
Approximating the performance of different molecules
X and Y are sites where we can hang substituents to change the behavior of the molecule
This is an example of a linear model (linear in the parameters)<br>
slide8. Linear Model: Arrhenius Model Temperature dependence on chemical reaction rate k We might have beliefs about different slopes…<br>
slide9. Linear Model: Arrhenius Model Temperature dependence on chemical reaction rate k We might have beliefs about different slopes…
… as well as different intercepts.<br>
slide10. Linear Model: Arrhenius Model Temperature dependence on chemical reaction rate k We might have beliefs about different slopes…
… as well as different intercepts.
But they are likely to be correlated.<br>
slide11. Parametric belief model Other models are nonlinear (in the parameters)
For example, the following model describes the length of nanotubes in low temperatures:
We might enumerate a number of potential sets of values for all the parameters (known as “discrete priors”)<br>
slide12. Building a belief model A prior can consist of a series of hand-drawn curves: 12 Density Photo-induced current Possible relationships<br>
slide13. Phase Diagram Classifying temperature/concentration regions
Different regions produce different materials
Each combination of temperature and concentration is a very expensive experiment.
How do we minimize the number of experiments to come up with a good classification? 13<br>
slide14. DM Hex NB La 20 30 40 50 40
30
20
10 Temperature (C) Concentration Phase Diagram Courtesy C. Lam, B. Olsen Possible combinations we might run: US<br>
slide15. Phase Diagram Courtesy C. Lam, B. Olsen One possible clustering: US<br>
slide16. Phase Diagram Courtesy C. Lam, B. Olsen Other clusterings: US<br>
slide17. Phase Diagram Courtesy C. Lam, B. Olsen Other clusterings: US<br>
slide18. Phase Diagram Courtesy C. Lam, B. Olsen Other clusterings: US<br>
slide19. Phase Diagram Other clusterings: US<br>
slide20. Phase Diagram Other clusterings: US<br>
slide21. Phase Diagram Other clusterings: US<br>
slide22. Building a belief model For each belief model:
We need to be able to compute the best possible design given our current set of beliefs (known as the prior)
We need to understand the possible outcomes of each experiment that we might want to run.
We then need to know how to update our belief model. This will give us a range of possible posteriors.
Finally, we need to compute the best possible design for each possible prior. 22<br>