
Social Contagion – An Empirical Comparison of
SN
Published · 25 slides · 0 views

1 / 1

Description
Social Contagion An Empirical Comparison of Seeding Strategies for Viral Marketing Hinz, Oliver Skiera, Bernd Barrot, Christian Becker, Jan U. (2011), An Empirical Comparison of Seeding Strategies for Viral Marketing, Journal of
Related Topics
Share
Embed code
Download this presentation From Below
"Social Contagion – An Empirical Comparison of" is the property of its rightful owner. Permission is granted to download and print the materials on this website for personal, non-commercial use only, and to display it on your personal computer provided you do not modify the materials and that you retain all copyright notices contained in the materials. By downloading content from our website, you accept the terms of this agreement.
Presentation Transcript
01
Social Contagion – An Empirical Comparison
of Seeding Strategies for Viral Marketing
Hinz, Oliver / Skiera, Bernd / Barrot, Christian / Becker, Jan U. (2011), "An Empirical Comparison of Seeding Strategies for Viral Marketing", Journal of Marketing, 75 (November), 55-71
Oliver Hinz Bernd Skiera
TU Darmstadt University of Frankfurt
Christian Barrot & Jan U. Becker
Kühne Logistics University, Hamburg<br>
of Seeding Strategies for Viral Marketing
Hinz, Oliver / Skiera, Bernd / Barrot, Christian / Becker, Jan U. (2011), "An Empirical Comparison of Seeding Strategies for Viral Marketing", Journal of Marketing, 75 (November), 55-71
Oliver Hinz Bernd Skiera
TU Darmstadt University of Frankfurt
Christian Barrot & Jan U. Becker
Kühne Logistics University, Hamburg<br>
02
A changing environment… …requires new marketing instruments Companies discover innovative new methods to proactively stimulate and channel Word-of-mouth Viral Marketing as savior
Viral marketing: consumers mutually share and spread information, initially sent out deliberately by marketers to stimulate and capitalize on word-of-mouth (WOM) traditional Marketing instruments are facing shrinking effectiveness in the face of new social media Information over-flow: Traditional advertising instruments such as print ads or TV commercials struggle to reach an audience growing tired of ever more ads
Rise of social media: Communications is shifting towards digital social media, such as facebook, twitter, email or SMS.
Credibility: Studies have shown the higher effectiveness of customer-initiated communication (e.g., word-of mouth) compared to advertising
Effective customer acquisition: Marketing managers have discovered social interactions between existing and potential customers as new sources for customer acquisition<br>
Viral marketing: consumers mutually share and spread information, initially sent out deliberately by marketers to stimulate and capitalize on word-of-mouth (WOM) traditional Marketing instruments are facing shrinking effectiveness in the face of new social media Information over-flow: Traditional advertising instruments such as print ads or TV commercials struggle to reach an audience growing tired of ever more ads
Rise of social media: Communications is shifting towards digital social media, such as facebook, twitter, email or SMS.
Credibility: Studies have shown the higher effectiveness of customer-initiated communication (e.g., word-of mouth) compared to advertising
Effective customer acquisition: Marketing managers have discovered social interactions between existing and potential customers as new sources for customer acquisition<br>
03
VIRAL MARKETING Rapidly gains Ground Global spending for viral marketing campaigns → Shift from traditional marketing budgets towards viral 2001 2006 2013 e e Forecast
Stephen, Andrew (2010): Viral Marketing: Tell a Woman, Working Paper, INSEAD, Fontainebleau. $ 76 Mio. $ 980 Mio. $ 3.000 Mio.<br>
Stephen, Andrew (2010): Viral Marketing: Tell a Woman, Working Paper, INSEAD, Fontainebleau. $ 76 Mio. $ 980 Mio. $ 3.000 Mio.<br>
04
VIRAL MARKETING utilizes the advantages of personal communications in social networks Viral marketing Advantages
familiar senders have a higher credibility for the recipient
familiar senders are not blocked by spam filters (higher reception and open rates)
low to very low cost (e.g., for distribution via SMS or email)
Key success factors
Content (e.g., funny, entertaining, surprising, motivating)
Willingness-to-share, often stimulated by incentives (e.g., coupons, competitions, financial rewards)
Social Network Structure (e.g., connectedness)
Seeding (selection of starting points to maximize campaign impact)<br>
familiar senders have a higher credibility for the recipient
familiar senders are not blocked by spam filters (higher reception and open rates)
low to very low cost (e.g., for distribution via SMS or email)
Key success factors
Content (e.g., funny, entertaining, surprising, motivating)
Willingness-to-share, often stimulated by incentives (e.g., coupons, competitions, financial rewards)
Social Network Structure (e.g., connectedness)
Seeding (selection of starting points to maximize campaign impact)<br>
05
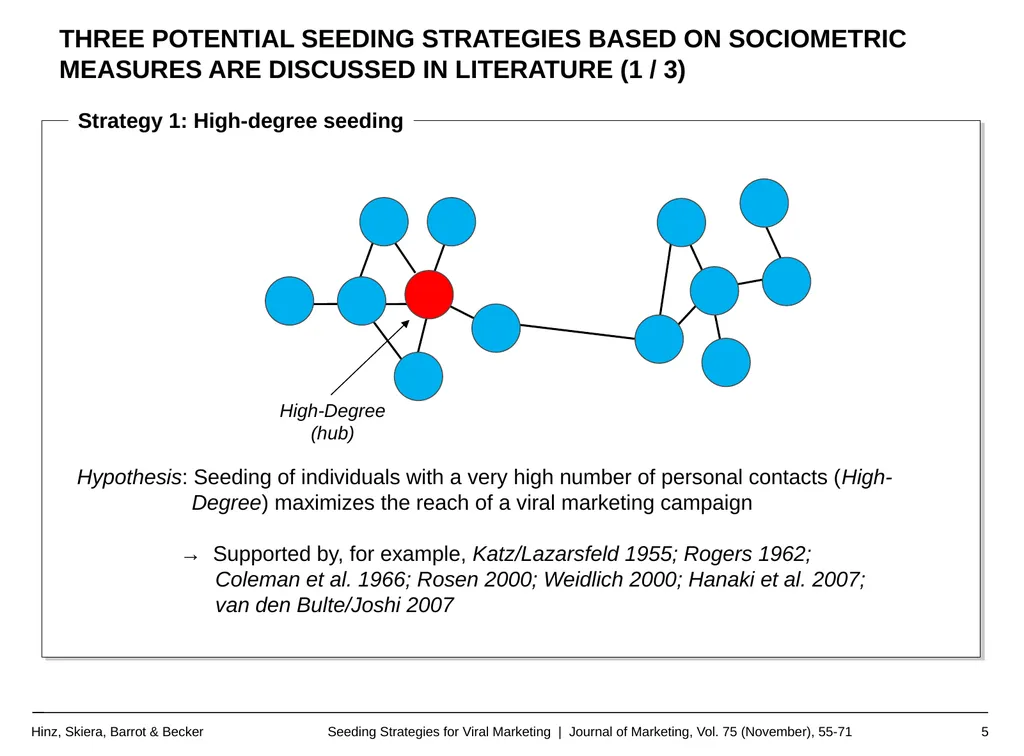
Strategy 1: High-degree seeding Hypothesis: Seeding of individuals with a very high number of personal contacts (High-
Degree) maximizes the reach of a viral marketing campaign
→ Supported by, for example, Katz/Lazarsfeld 1955; Rogers 1962; Coleman et al. 1966; Rosen 2000; Weidlich 2000; Hanaki et al. 2007; van den Bulte/Joshi 2007 three potential seeding strategies based on Sociometric measures are discussed in literature (1 / 3)<br>
→ Supported by, for example, Katz/Lazarsfeld 1955; Rogers 1962; Coleman et al. 1966; Rosen 2000; Weidlich 2000; Hanaki et al. 2007; van den Bulte/Joshi 2007 three potential seeding strategies based on Sociometric measures are discussed in literature (1 / 3)<br>
06
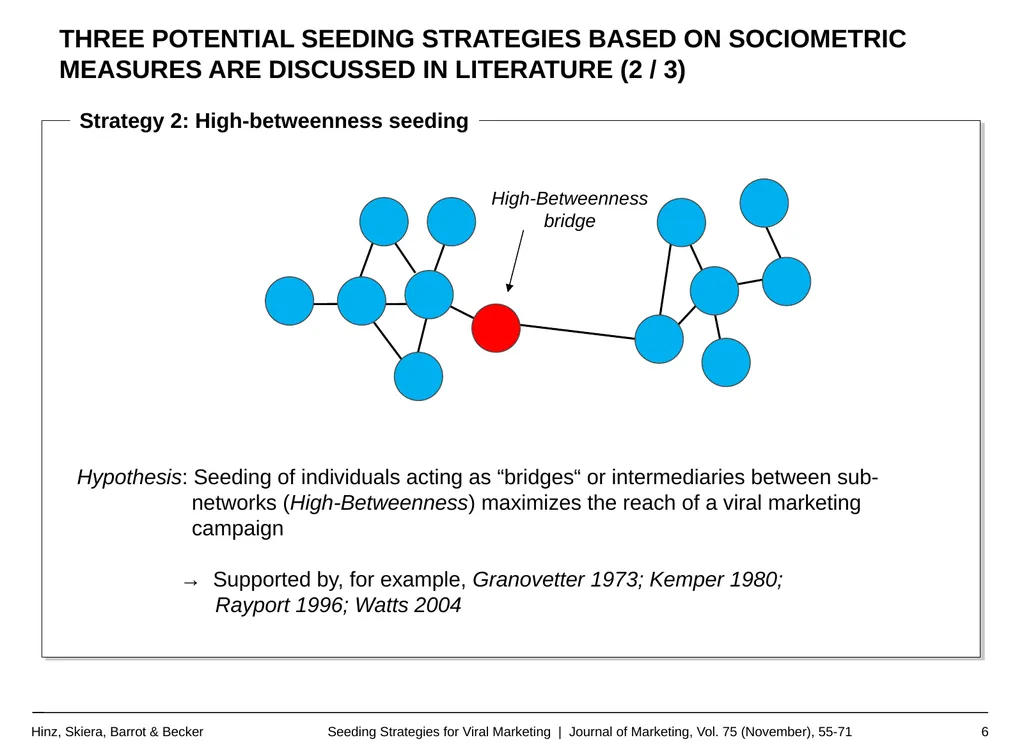
Strategy 2: High-betweenness seeding Hypothesis: Seeding of individuals acting as “bridges“ or intermediaries between sub-
networks (High-Betweenness) maximizes the reach of a viral marketing
campaign
→ Supported by, for example, Granovetter 1973; Kemper 1980; Rayport 1996; Watts 2004 three potential seeding strategies based on Sociometric measures are discussed in literature (2 / 3)<br>
→ Supported by, for example, Granovetter 1973; Kemper 1980; Rayport 1996; Watts 2004 three potential seeding strategies based on Sociometric measures are discussed in literature (2 / 3)<br>
07
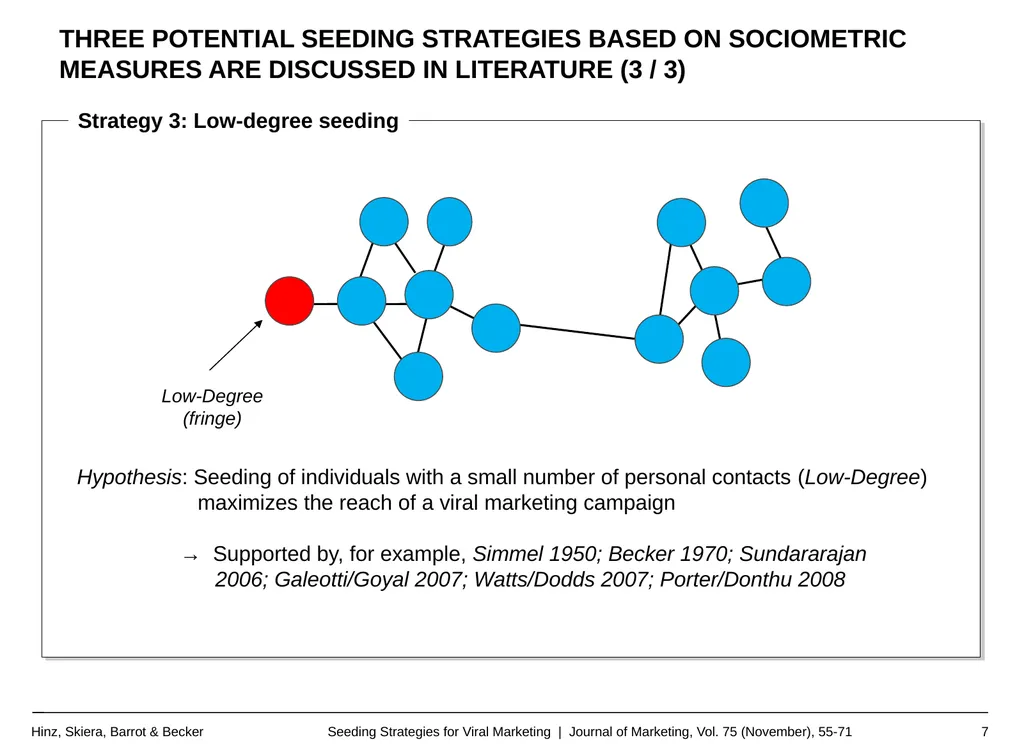
Strategy 3: Low-degree seeding Hypothesis: Seeding of individuals with a small number of personal contacts (Low-Degree)
maximizes the reach of a viral marketing campaign
→ Supported by, for example, Simmel 1950; Becker 1970; Sundararajan 2006; Galeotti/Goyal 2007; Watts/Dodds 2007; Porter/Donthu 2008 three potential seeding strategies based on Sociometric measures are discussed in literature (3 / 3)<br>
→ Supported by, for example, Simmel 1950; Becker 1970; Sundararajan 2006; Galeotti/Goyal 2007; Watts/Dodds 2007; Porter/Donthu 2008 three potential seeding strategies based on Sociometric measures are discussed in literature (3 / 3)<br>
08
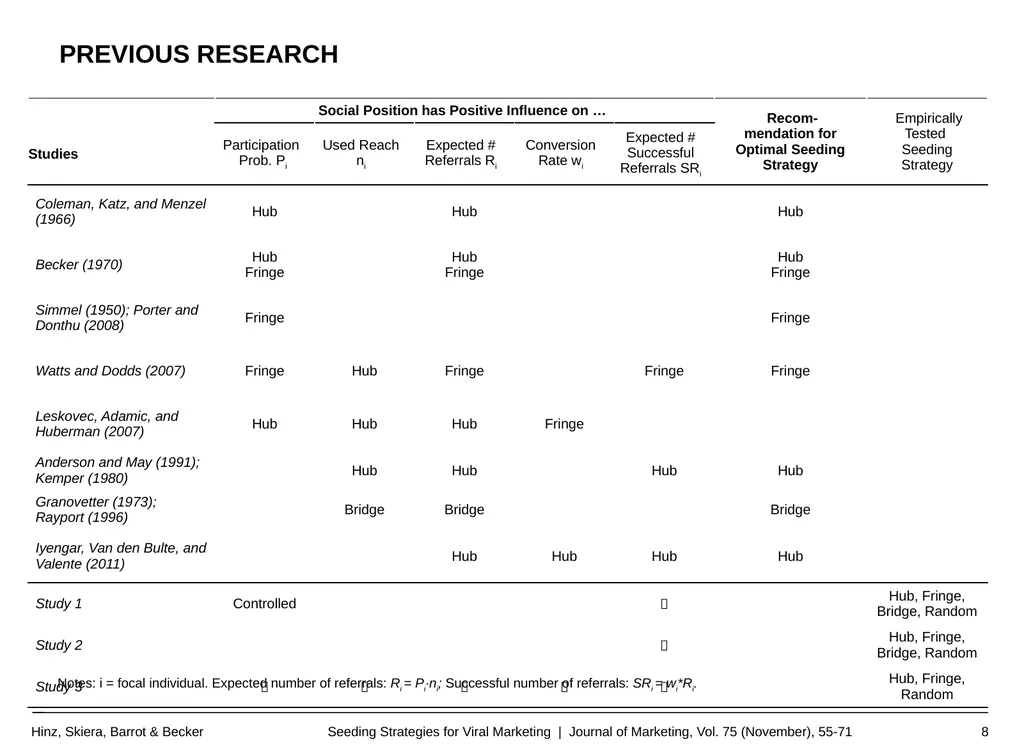
Previous Research Notes: i = focal individual. Expected number of referrals: Ri = Pi∙ni; Successful number of referrals: SRi = wi*Ri.<br>
09
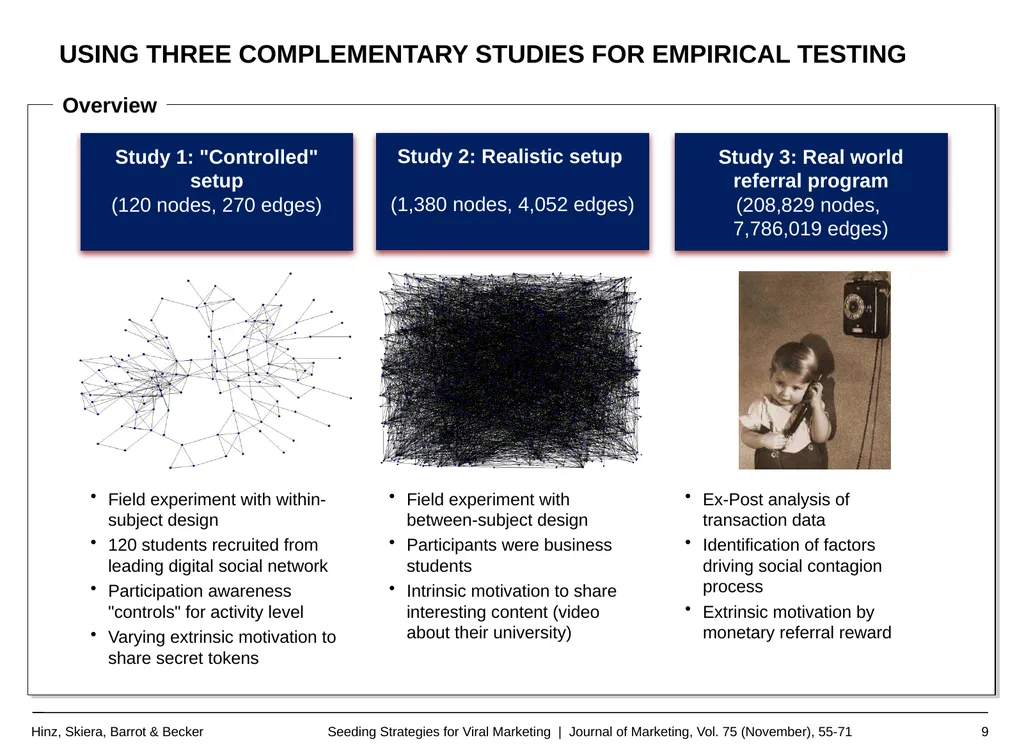
Overview Study 1: "Controlled" setup
(120 nodes, 270 edges) Study 2: Realistic setup
(1,380 nodes, 4,052 edges) Field experiment with within-subject design
120 students recruited from leading digital social network
Participation awareness "controls" for activity level
Varying extrinsic motivation to share secret tokens Field experiment with between-subject design
Participants were business students
Intrinsic motivation to share interesting content (video about their university) Study 3: Real world referral program
(208,829 nodes, 7,786,019 edges) Ex-Post analysis of transaction data
Identification of factors driving social contagion process
Extrinsic motivation by monetary referral reward Using three complementary studies for empirical testing<br>
(1,380 nodes, 4,052 edges) Field experiment with within-subject design
120 students recruited from leading digital social network
Participation awareness "controls" for activity level
Varying extrinsic motivation to share secret tokens Field experiment with between-subject design
Participants were business students
Intrinsic motivation to share interesting content (video about their university) Study 3: Real world referral program
(208,829 nodes, 7,786,019 edges) Ex-Post analysis of transaction data
Identification of factors driving social contagion process
Extrinsic motivation by monetary referral reward Using three complementary studies for empirical testing<br>
10
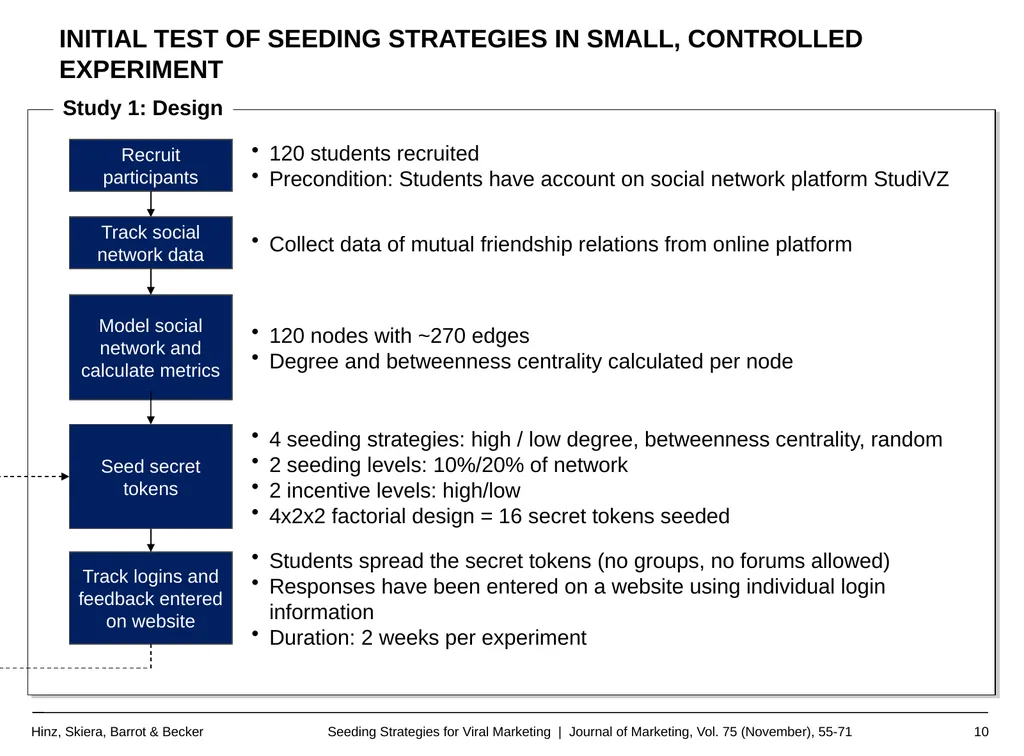
Study 1: Design Initial test of seeding strategies in small, controlled experiment Recruit participants 120 students recruited
Precondition: Students have account on social network platform StudiVZ Track social network data Model social network and calculate metrics Seed secret tokens Track logins and feedback entered on website Collect data of mutual friendship relations from online platform 120 nodes with ~270 edges
Degree and betweenness centrality calculated per node 4 seeding strategies: high / low degree, betweenness centrality, random
2 seeding levels: 10%/20% of network
2 incentive levels: high/low
4x2x2 factorial design = 16 secret tokens seeded Students spread the secret tokens (no groups, no forums allowed)
Responses have been entered on a website using individual login information
Duration: 2 weeks per experiment<br>
Precondition: Students have account on social network platform StudiVZ Track social network data Model social network and calculate metrics Seed secret tokens Track logins and feedback entered on website Collect data of mutual friendship relations from online platform 120 nodes with ~270 edges
Degree and betweenness centrality calculated per node 4 seeding strategies: high / low degree, betweenness centrality, random
2 seeding levels: 10%/20% of network
2 incentive levels: high/low
4x2x2 factorial design = 16 secret tokens seeded Students spread the secret tokens (no groups, no forums allowed)
Responses have been entered on a website using individual login information
Duration: 2 weeks per experiment<br>
11
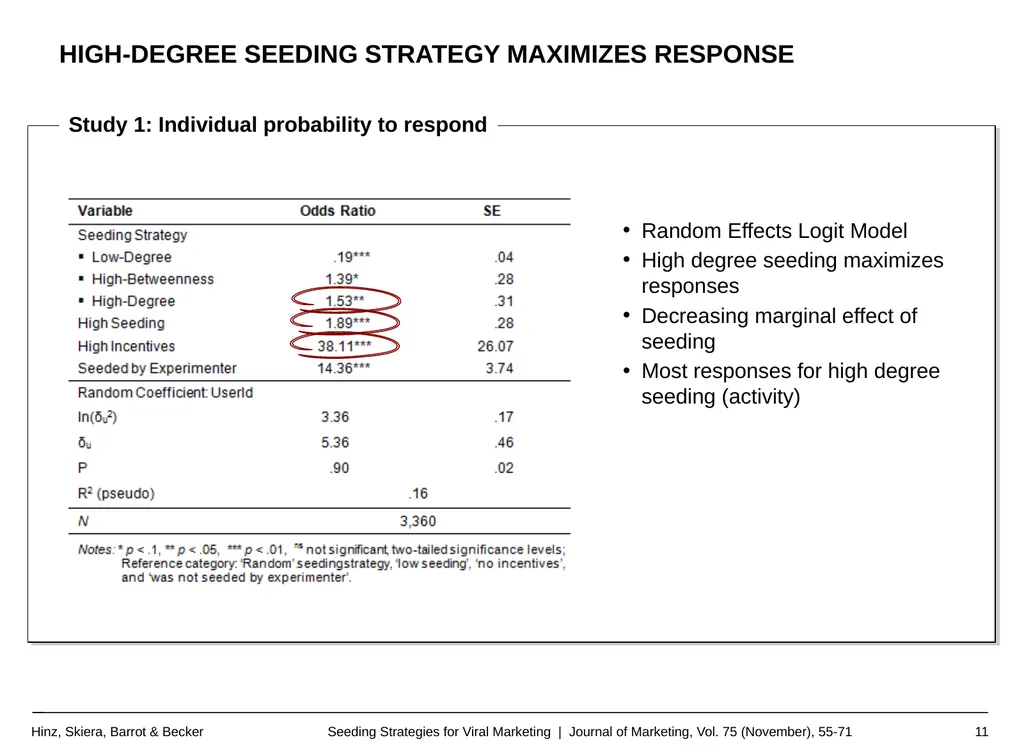
Study 1: Individual probability to respond High-Degree Seeding strategy maximizes response Random Effects Logit Model
High degree seeding maximizes responses
Decreasing marginal effect of seeding
Most responses for high degree seeding (activity)<br>
High degree seeding maximizes responses
Decreasing marginal effect of seeding
Most responses for high degree seeding (activity)<br>
12
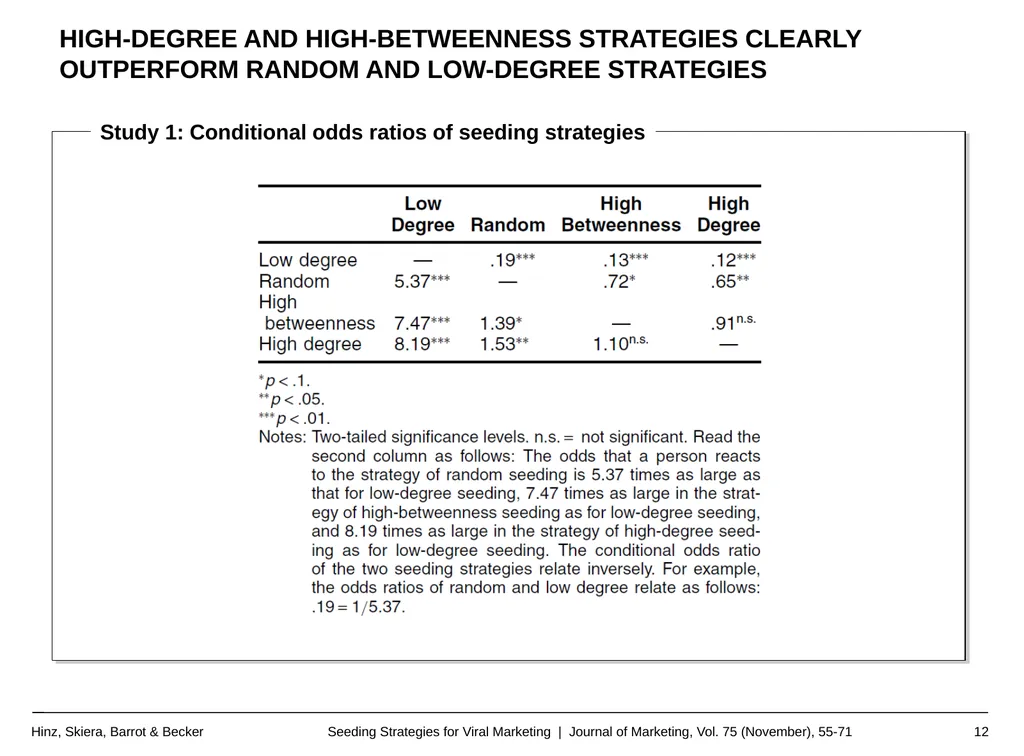
High-Degree and High-Betweenness Strategies clearly outperform random and Low-Degree Strategies Study 1: Conditional odds ratios of seeding strategies<br>
13
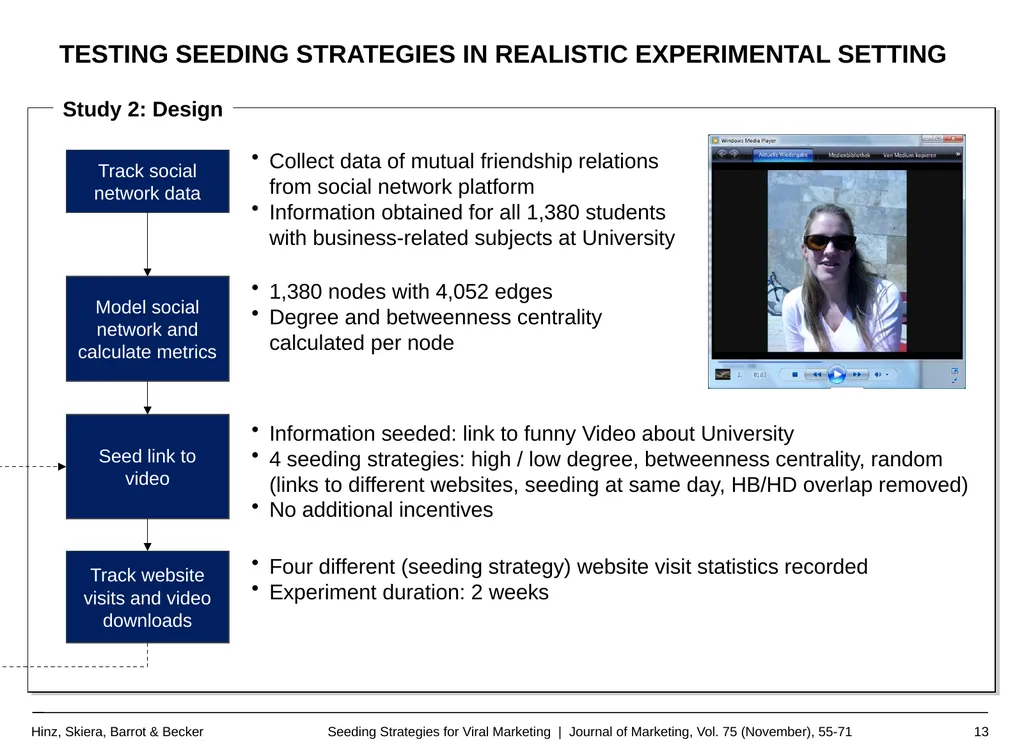
Study 2: Design Track social network data Model social network and calculate metrics Seed link to video Track website visits and video downloads Collect data of mutual friendship relations
from social network platform
Information obtained for all 1,380 students with business-related subjects at University 1,380 nodes with 4,052 edges
Degree and betweenness centrality calculated per node Information seeded: link to funny Video about University
4 seeding strategies: high / low degree, betweenness centrality, random (links to different websites, seeding at same day, HB/HD overlap removed)
No additional incentives Four different (seeding strategy) website visit statistics recorded
Experiment duration: 2 weeks Testing seeding strategies in realistic Experimental setting<br>
Information obtained for all 1,380 students with business-related subjects at University 1,380 nodes with 4,052 edges
Degree and betweenness centrality calculated per node Information seeded: link to funny Video about University
4 seeding strategies: high / low degree, betweenness centrality, random (links to different websites, seeding at same day, HB/HD overlap removed)
No additional incentives Four different (seeding strategy) website visit statistics recorded
Experiment duration: 2 weeks Testing seeding strategies in realistic Experimental setting<br>
14
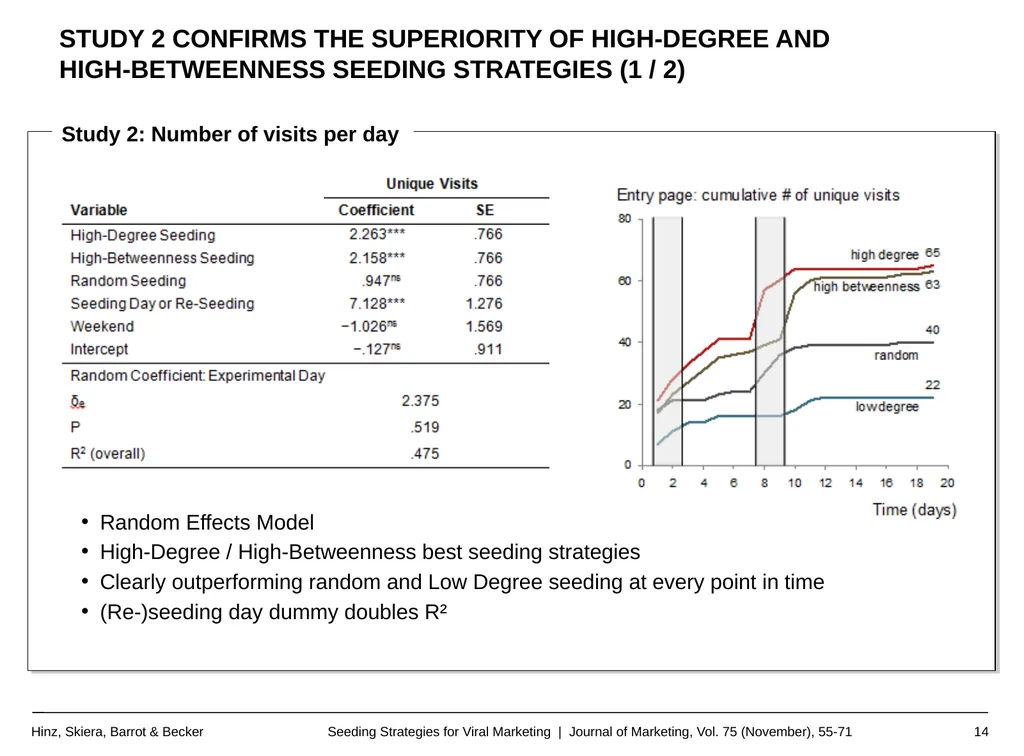
Study 2: Number of visits per day Random Effects Model
High-Degree / High-Betweenness best seeding strategies
Clearly outperforming random and Low Degree seeding at every point in time
(Re-)seeding day dummy doubles R² STUDY 2 CONFIRMS THE SUPERIORITY OF HIGH-DEGREE AND HIGH-BETWEENNESS SEEDING STRATEGIES (1 / 2)<br>
High-Degree / High-Betweenness best seeding strategies
Clearly outperforming random and Low Degree seeding at every point in time
(Re-)seeding day dummy doubles R² STUDY 2 CONFIRMS THE SUPERIORITY OF HIGH-DEGREE AND HIGH-BETWEENNESS SEEDING STRATEGIES (1 / 2)<br>
15
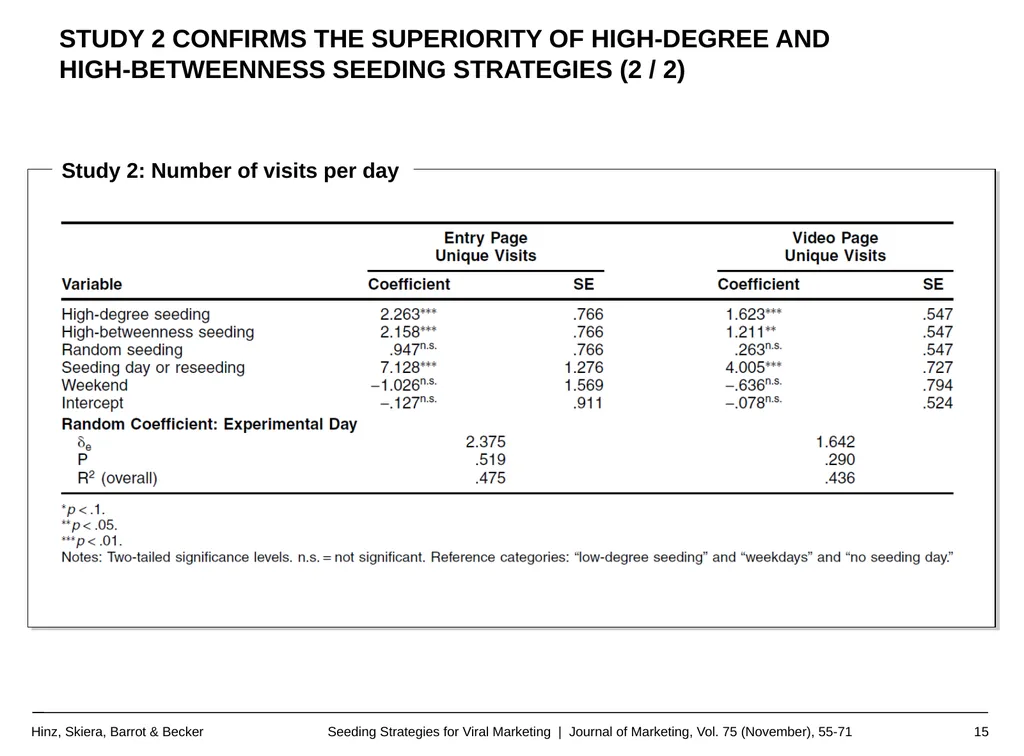
Study 2: Number of visits per day STUDY 2 CONFIRMS THE SUPERIORITY OF HIGH-DEGREE AND
HIGH-BETWEENNESS SEEDING STRATEGIES (2 / 2)<br>
16
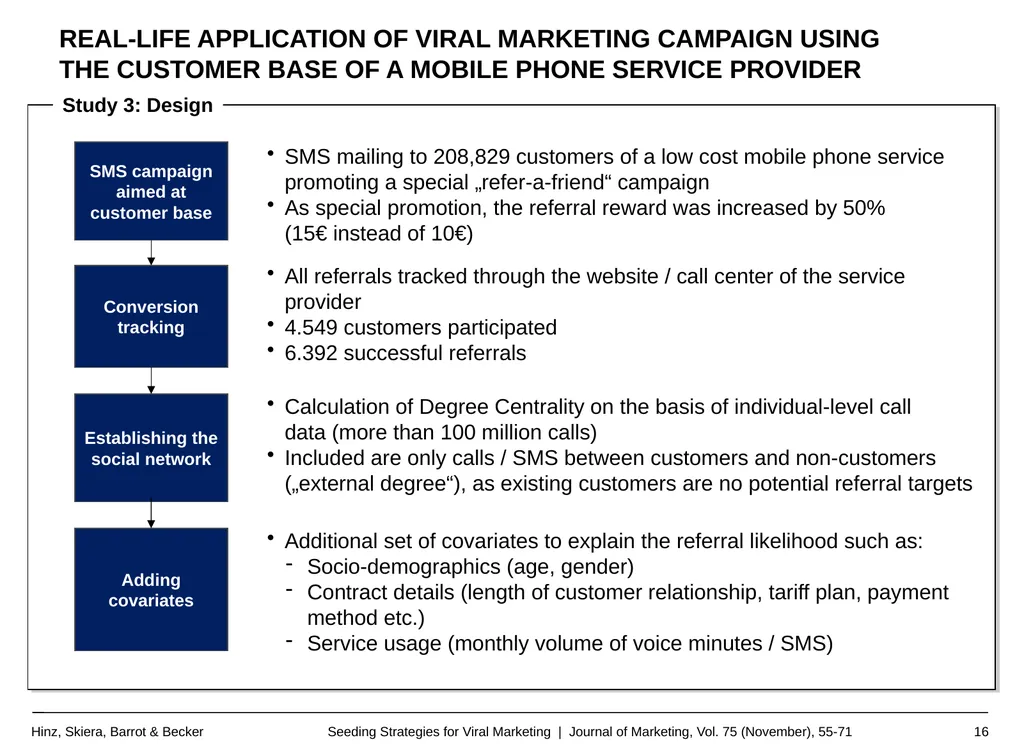
Study 3: Design Real-life application of viral marketing campaign using
the customer base of a mobile phone service provider SMS mailing to 208,829 customers of a low cost mobile phone service promoting a special „refer-a-friend“ campaign
As special promotion, the referral reward was increased by 50% (15€ instead of 10€) SMS campaign aimed at customer base Conversion tracking Establishing the social network Adding covariates All referrals tracked through the website / call center of the service provider
4.549 customers participated
6.392 successful referrals Calculation of Degree Centrality on the basis of individual-level call data (more than 100 million calls)
Included are only calls / SMS between customers and non-customers („external degree“), as existing customers are no potential referral targets Additional set of covariates to explain the referral likelihood such as:
Socio-demographics (age, gender)
Contract details (length of customer relationship, tariff plan, payment method etc.)
Service usage (monthly volume of voice minutes / SMS)<br>
As special promotion, the referral reward was increased by 50% (15€ instead of 10€) SMS campaign aimed at customer base Conversion tracking Establishing the social network Adding covariates All referrals tracked through the website / call center of the service provider
4.549 customers participated
6.392 successful referrals Calculation of Degree Centrality on the basis of individual-level call data (more than 100 million calls)
Included are only calls / SMS between customers and non-customers („external degree“), as existing customers are no potential referral targets Additional set of covariates to explain the referral likelihood such as:
Socio-demographics (age, gender)
Contract details (length of customer relationship, tariff plan, payment method etc.)
Service usage (monthly volume of voice minutes / SMS)<br>
17
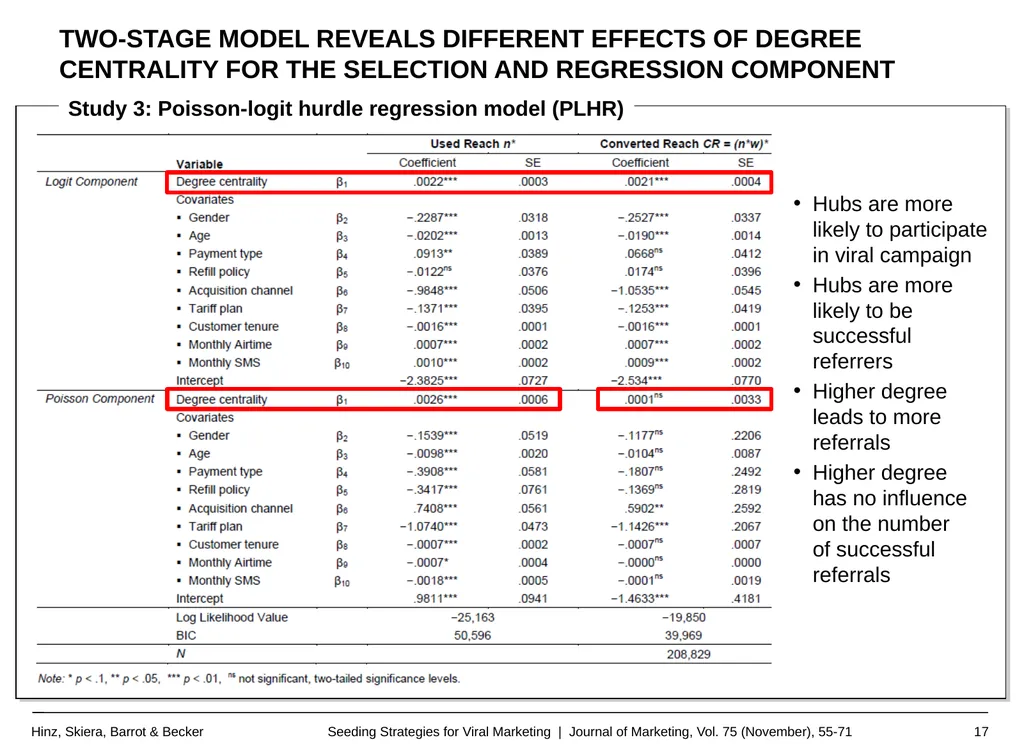
Study 3: Poisson-logit hurdle regression model (PLHR) Two-stage model reveals different effects of degree centrality for the selection and regression component Hubs are more
likely to participate
in viral campaign
Hubs are more likely to be successful referrers
Higher degree leads to more referrals
Higher degree has no influence on the number of successful referrals<br>
Hubs are more likely to be successful referrers
Higher degree leads to more referrals
Higher degree has no influence on the number of successful referrals<br>
18
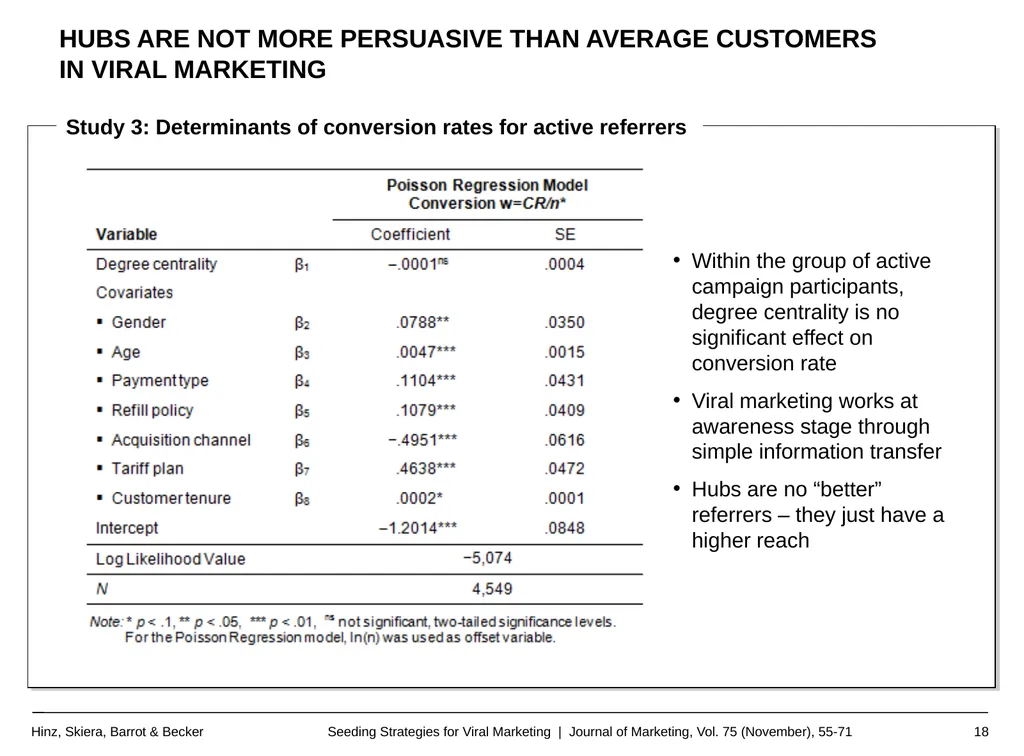
Study 3: Determinants of conversion rates for active referrers Hubs are not more persuasive than average customers
in viral marketing Within the group of active campaign participants,
degree centrality is no significant effect on conversion rate
Viral marketing works at awareness stage through simple information transfer
Hubs are no “better” referrers – they just have a higher reach<br>
Viral marketing works at awareness stage through simple information transfer
Hubs are no “better” referrers – they just have a higher reach<br>
19
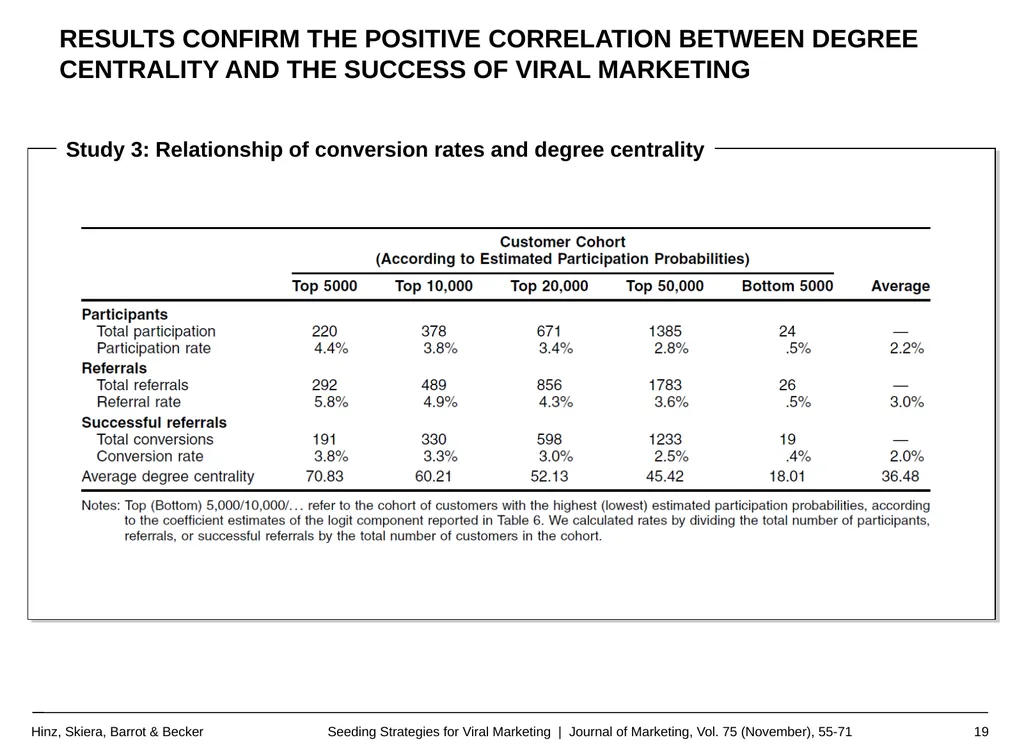
Results confirm the positive correlation between degree centrality and the success of viral marketing Study 3: Relationship of conversion rates and degree centrality<br>
20
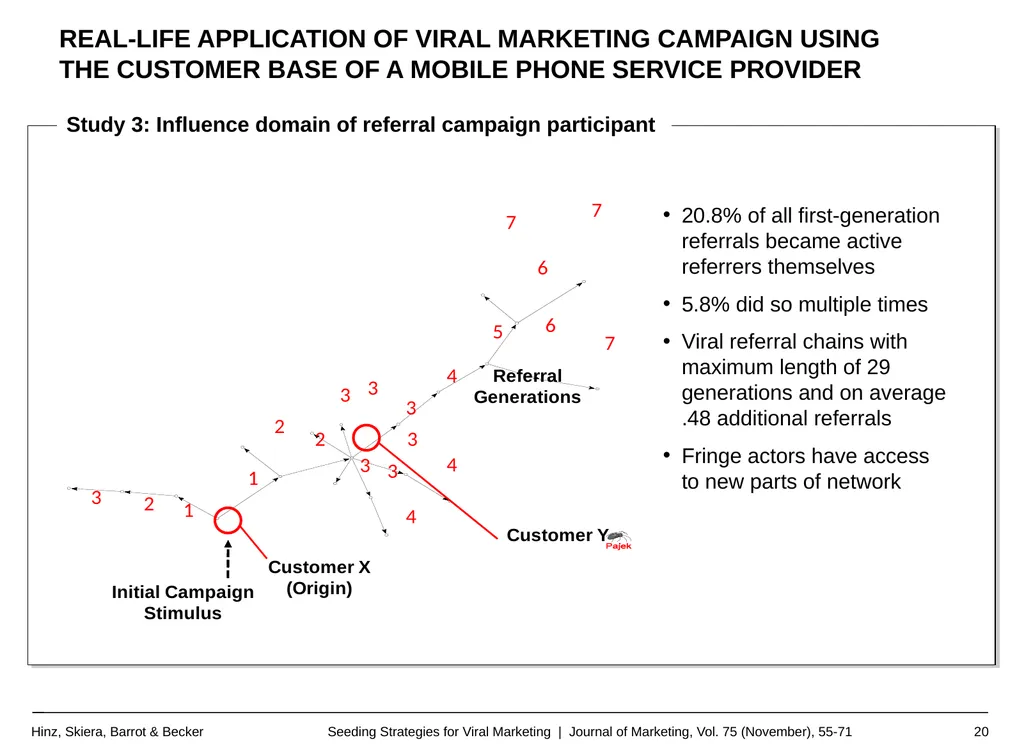
Study 3: Influence domain of referral campaign participant 20.8% of all first-generation
referrals became active
referrers themselves
5.8% did so multiple times
Viral referral chains with maximum length of 29 generations and on average .48 additional referrals
Fringe actors have access to new parts of network Real-life application of viral marketing campaign using the customer base of a mobile phone service provider<br>
5.8% did so multiple times
Viral referral chains with maximum length of 29 generations and on average .48 additional referrals
Fringe actors have access to new parts of network Real-life application of viral marketing campaign using the customer base of a mobile phone service provider<br>
21
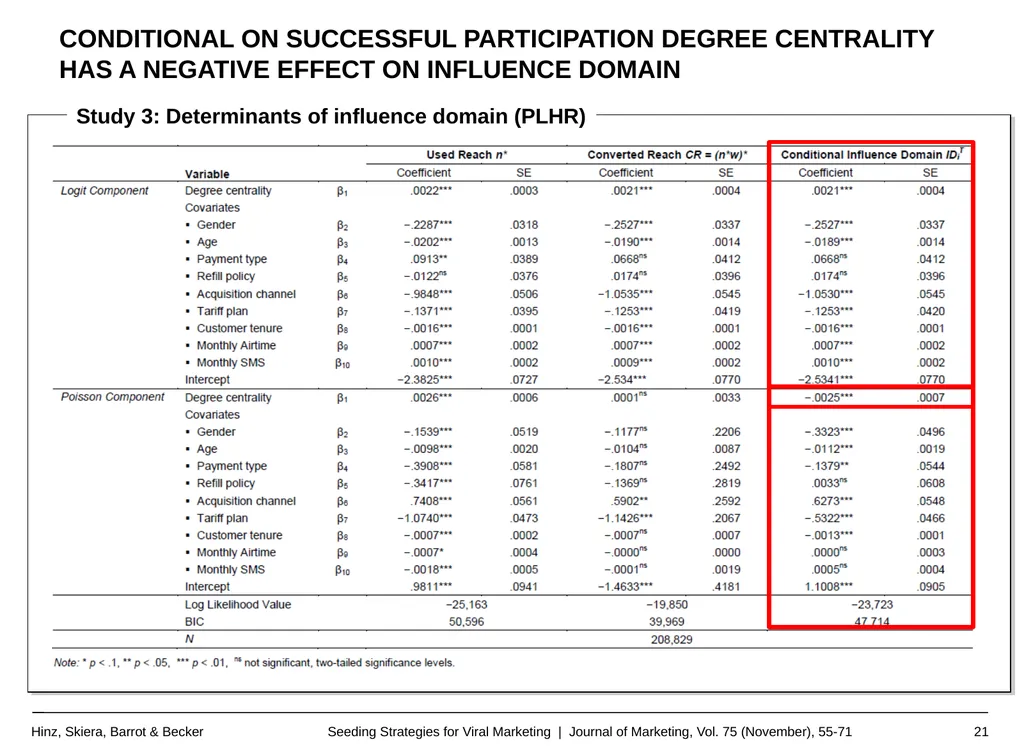
Study 3: Determinants of influence domain (PLHR) Conditional on successful participation degree centrality has a negative effect on influence domain<br>
22
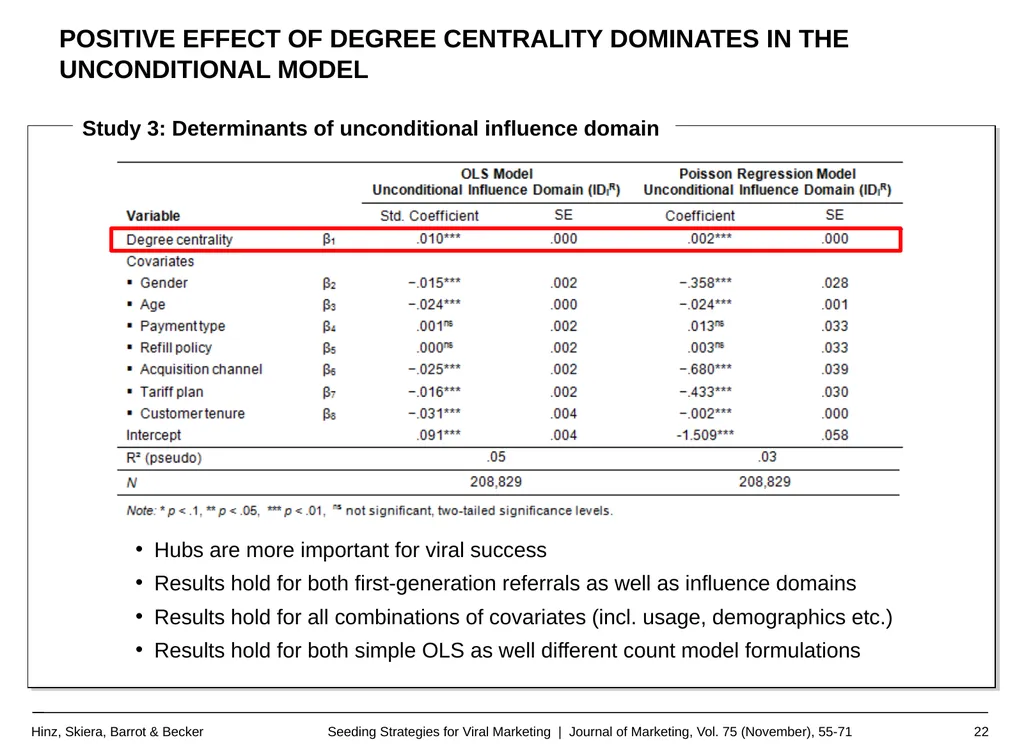
Study 3: Determinants of unconditional influence domain Hubs are more important for viral success
Results hold for both first-generation referrals as well as influence domains
Results hold for all combinations of covariates (incl. usage, demographics etc.)
Results hold for both simple OLS as well different count model formulations Positive effect of degree centrality dominates in the unconditional model<br>
Results hold for both first-generation referrals as well as influence domains
Results hold for all combinations of covariates (incl. usage, demographics etc.)
Results hold for both simple OLS as well different count model formulations Positive effect of degree centrality dominates in the unconditional model<br>
23
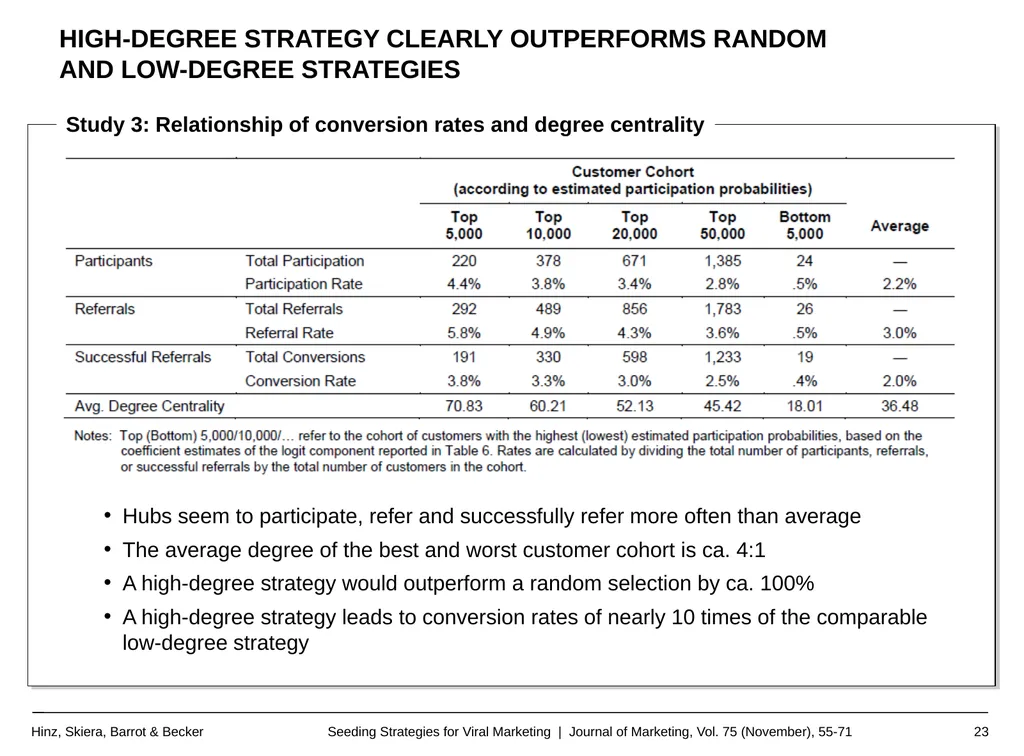
Study 3: Relationship of conversion rates and degree centrality Hubs seem to participate, refer and successfully refer more often than average
The average degree of the best and worst customer cohort is ca. 4:1
A high-degree strategy would outperform a random selection by ca. 100%
A high-degree strategy leads to conversion rates of nearly 10 times of the comparable low-degree strategy High-degree strategy clearly outperforms random and low-degree strategies<br>
The average degree of the best and worst customer cohort is ca. 4:1
A high-degree strategy would outperform a random selection by ca. 100%
A high-degree strategy leads to conversion rates of nearly 10 times of the comparable low-degree strategy High-degree strategy clearly outperforms random and low-degree strategies<br>
24
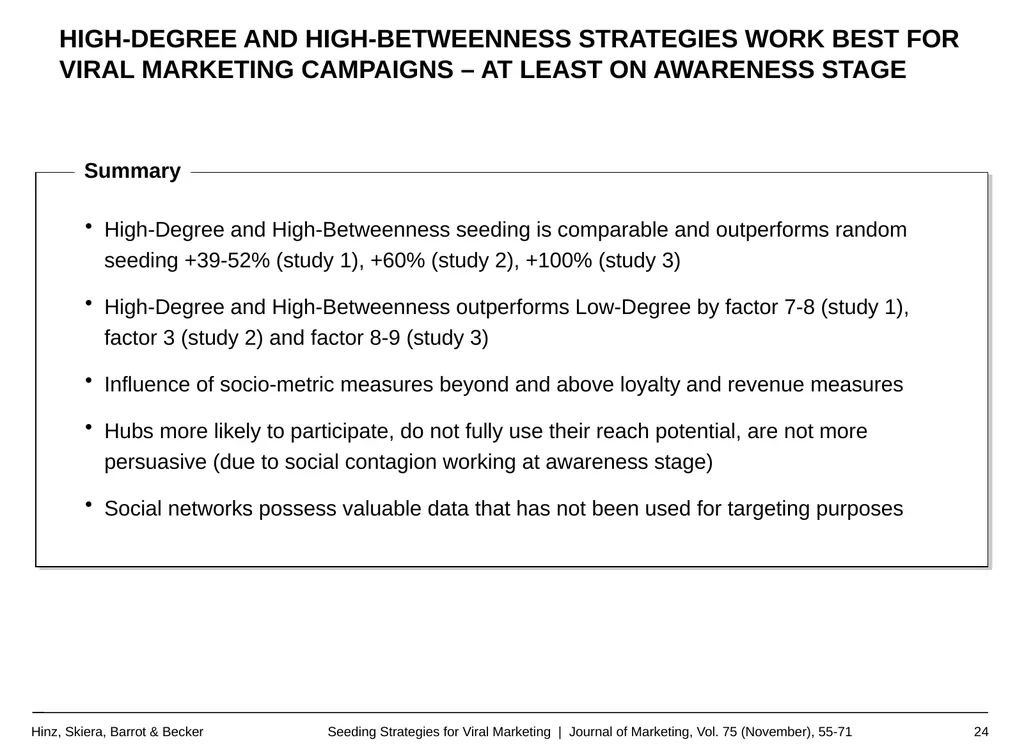
Summary High-degree and high-betweenNess strategies work best for viral marketing campaigns – at least on awareness stage High-Degree and High-Betweenness seeding is comparable and outperforms random seeding +39-52% (study 1), +60% (study 2), +100% (study 3)
High-Degree and High-Betweenness outperforms Low-Degree by factor 7-8 (study 1), factor 3 (study 2) and factor 8-9 (study 3)
Influence of socio-metric measures beyond and above loyalty and revenue measures
Hubs more likely to participate, do not fully use their reach potential, are not more persuasive (due to social contagion working at awareness stage)
Social networks possess valuable data that has not been used for targeting purposes<br>
High-Degree and High-Betweenness outperforms Low-Degree by factor 7-8 (study 1), factor 3 (study 2) and factor 8-9 (study 3)
Influence of socio-metric measures beyond and above loyalty and revenue measures
Hubs more likely to participate, do not fully use their reach potential, are not more persuasive (due to social contagion working at awareness stage)
Social networks possess valuable data that has not been used for targeting purposes<br>
25
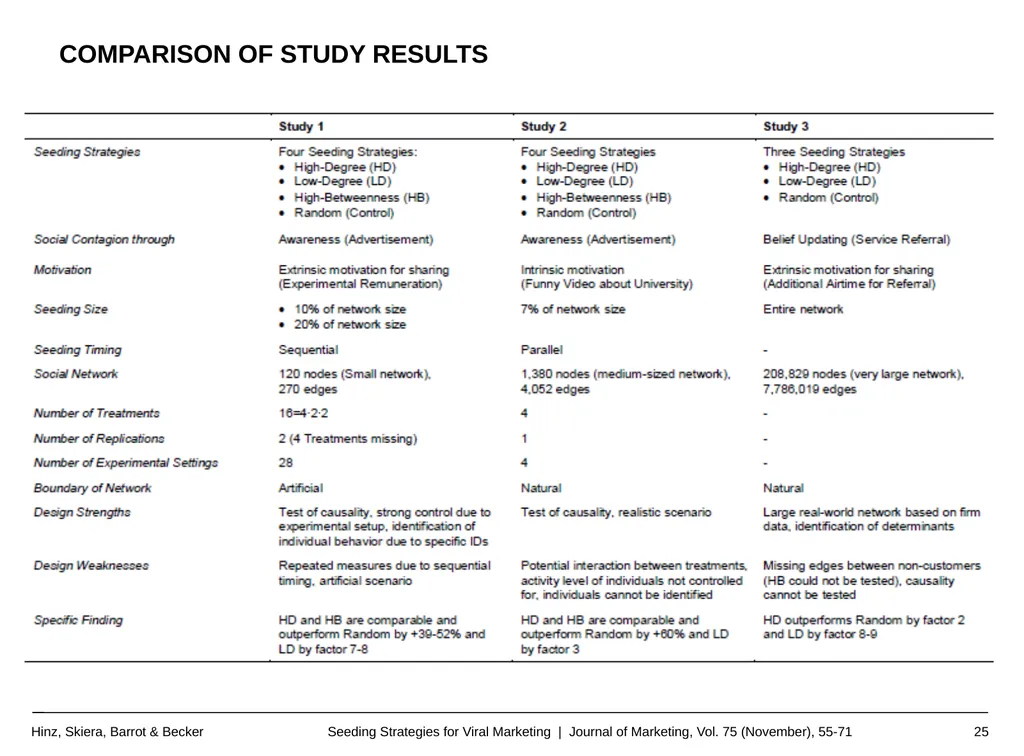
Comparison of Study results<br>