
SOCIOECONOMIC STATUS INTRODUCTION Three variables

Description: SOCIOECONOMIC STATUS INTRODUCTION Three variables determines socioeconomic status of individual family. Education occupation Income CLASSIFICATION OF SOCIOECONOMIC STATUS METHODS OF ASSESSING S.E.STATUS BG Prasad method Kuppuswamys method
Related Topics
Download Presentation
"SOCIOECONOMIC STATUS INTRODUCTION Three variables" is the property of its rightful owner. Permission is granted to download and print the materials on this website for personal, non-commercial use only, and to display it on your personal computer provided you do not modify the materials and that you retain all copyright notices contained in the materials. By downloading content from our website, you accept the terms of this agreement.
Presentation Transcript
slide1. SOCIOECONOMIC STATUS<br>
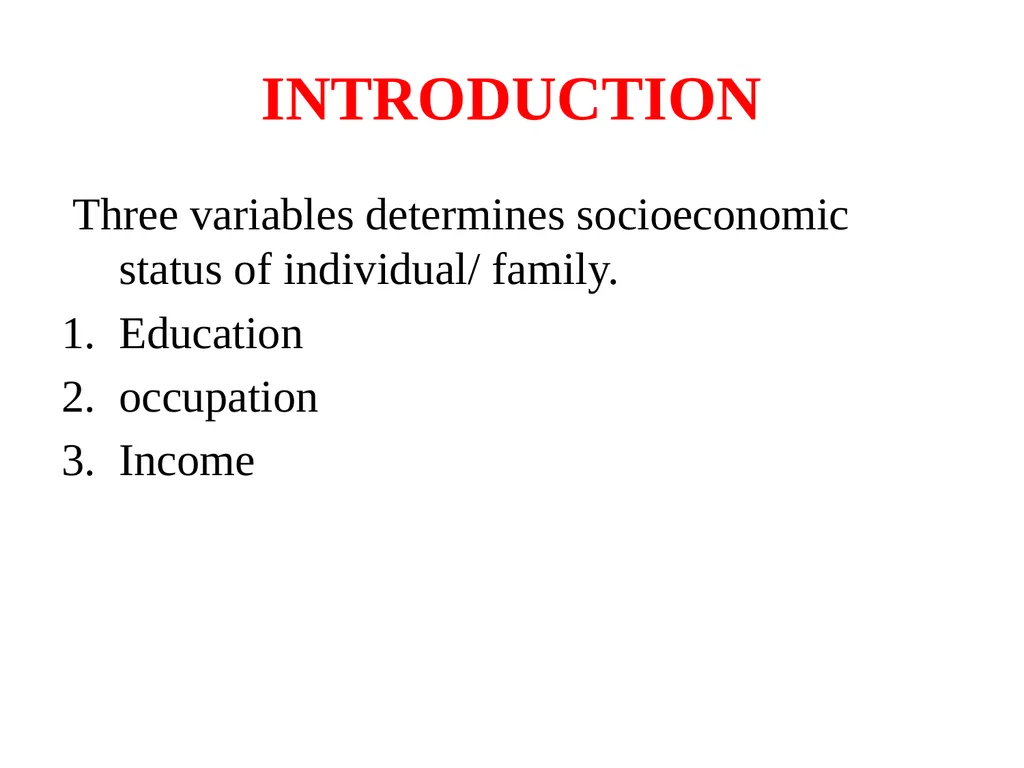
slide2. INTRODUCTION Three variables determines socioeconomic status of individual/ family.
Education
occupation
Income<br>
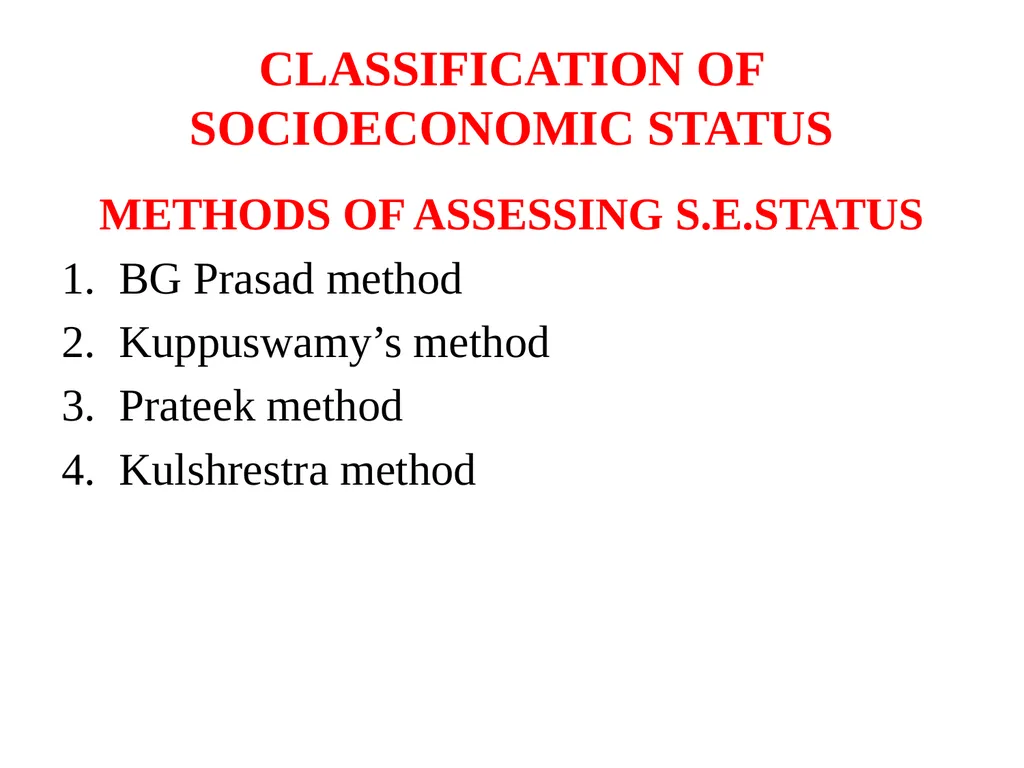
slide3. CLASSIFICATION OF SOCIOECONOMIC STATUS METHODS OF ASSESSING S.E.STATUS
BG Prasad method
Kuppuswamy’s method
Prateek method
Kulshrestra method<br>
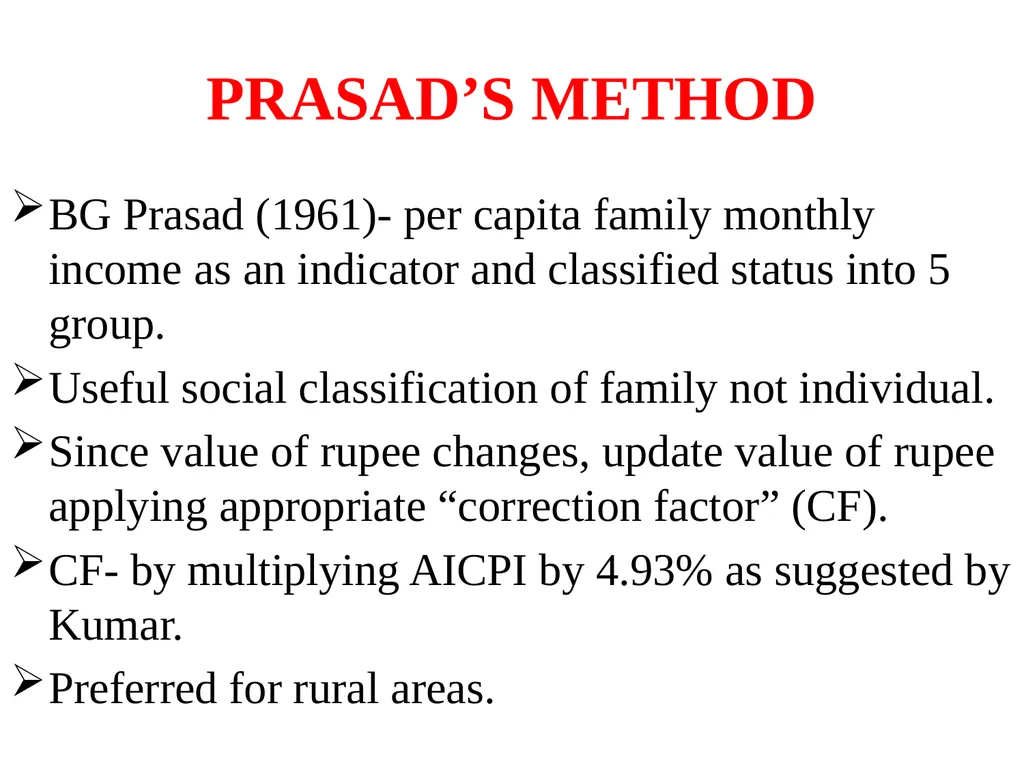
slide4. PRASAD’S METHOD BG Prasad (1961)- per capita family monthly income as an indicator and classified status into 5 group.
Useful social classification of family not individual.
Since value of rupee changes, update value of rupee applying appropriate “correction factor” (CF).
CF- by multiplying AICPI by 4.93% as suggested by Kumar.
Preferred for rural areas.<br>
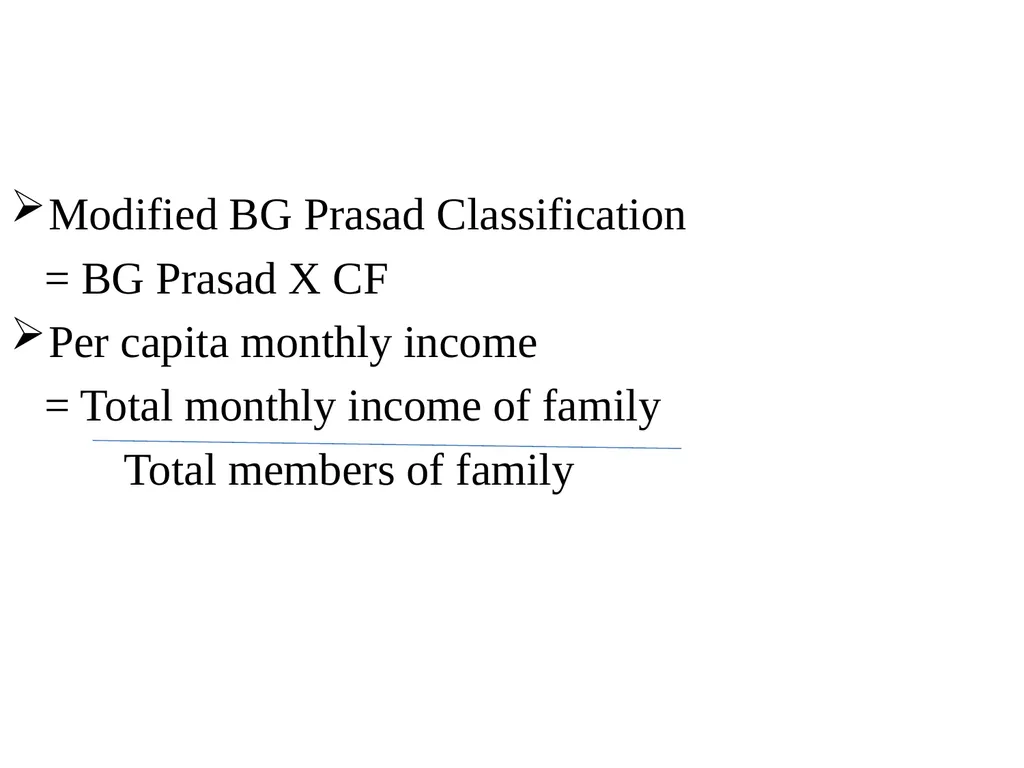
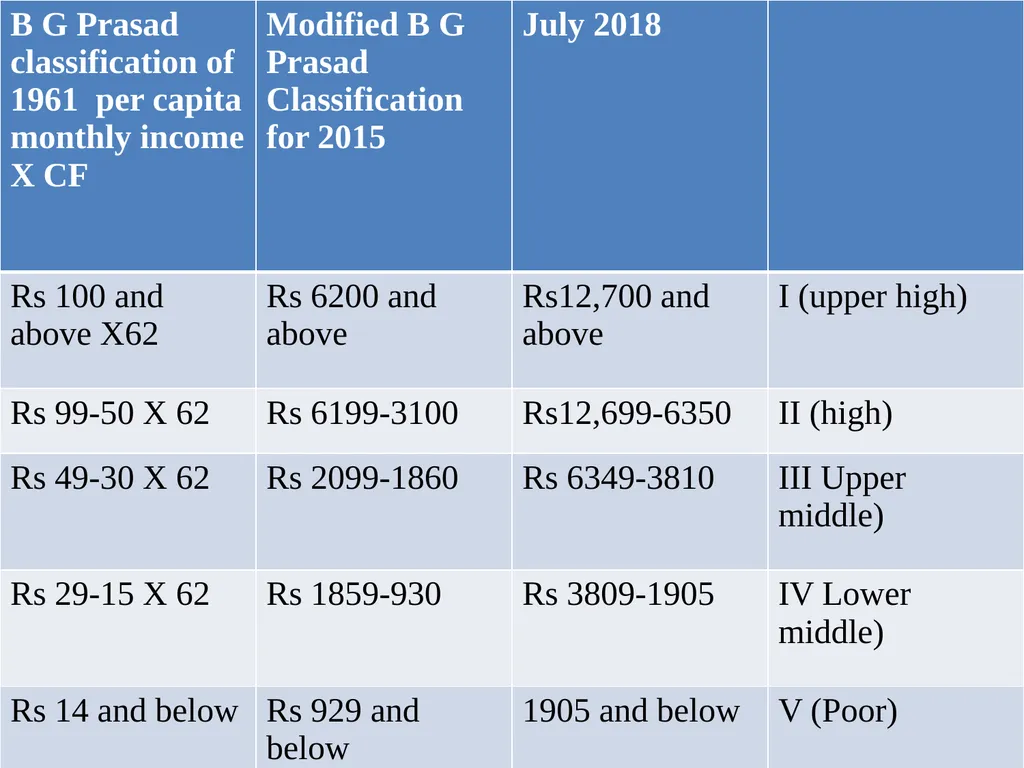
slide5. Modified BG Prasad Classification
= BG Prasad X CF
Per capita monthly income
= Total monthly income of family
Total members of family<br>
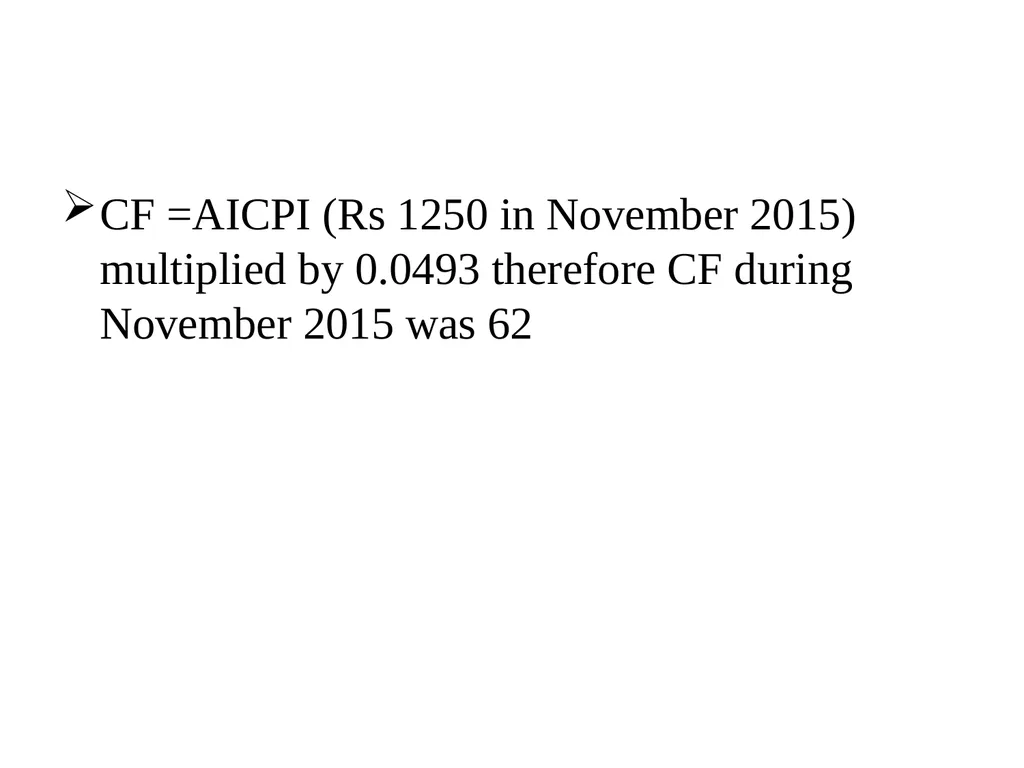
slide7. CF =AICPI (Rs 1250 in November 2015) multiplied by 0.0493 therefore CF during November 2015 was 62<br>
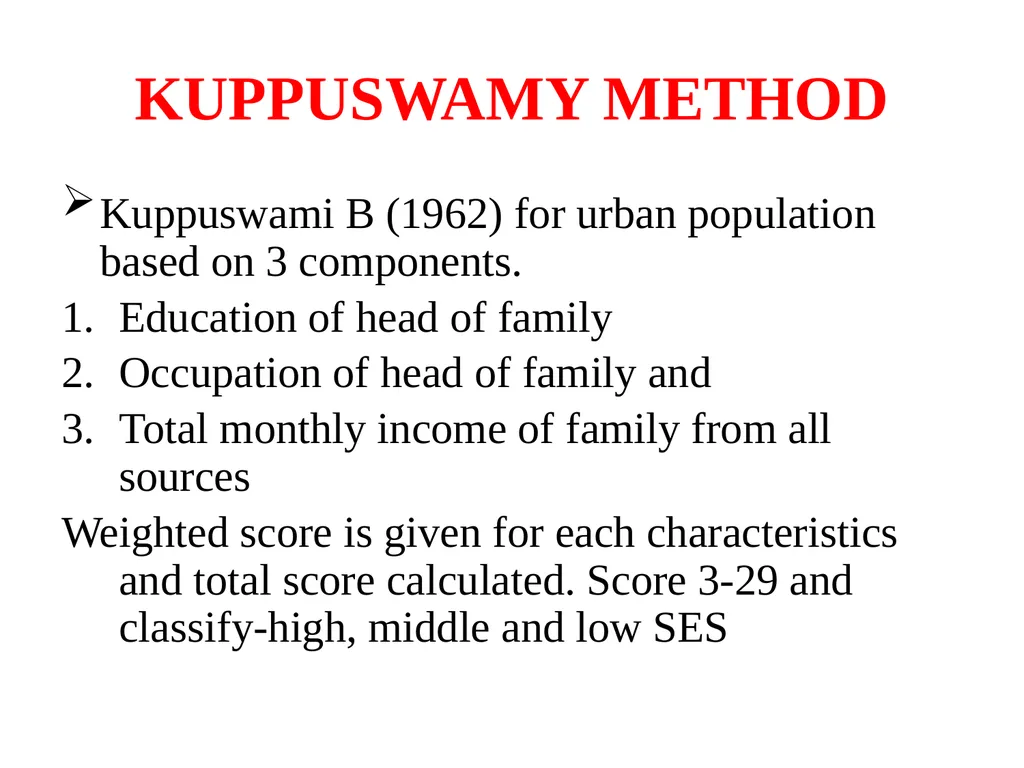
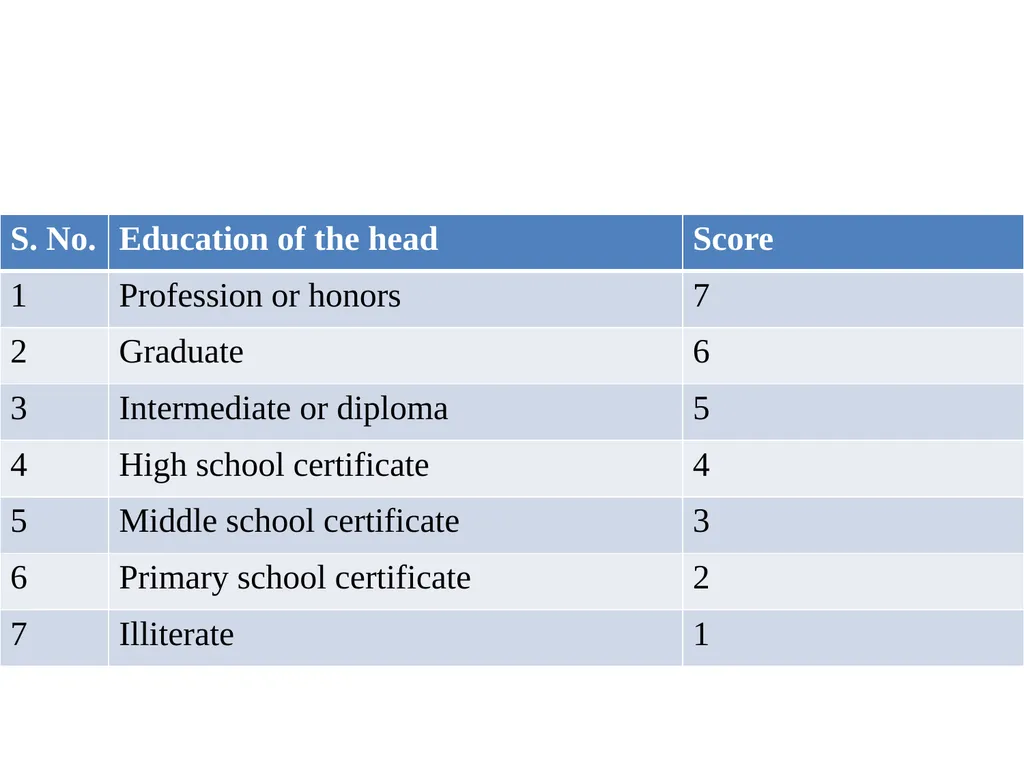
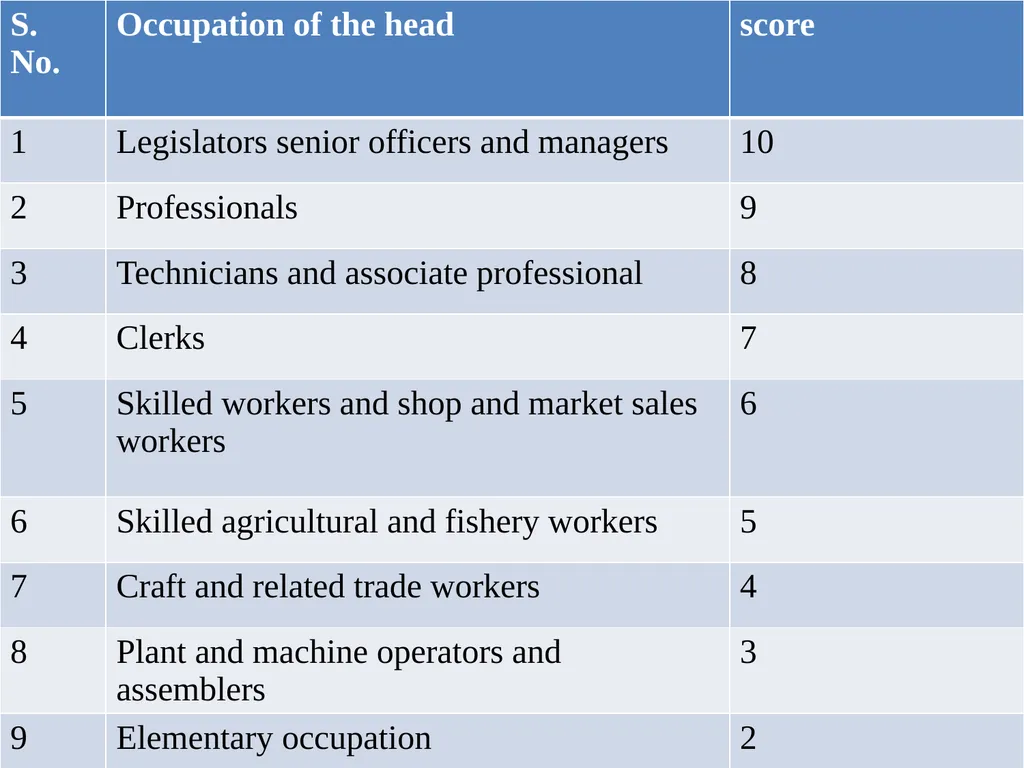
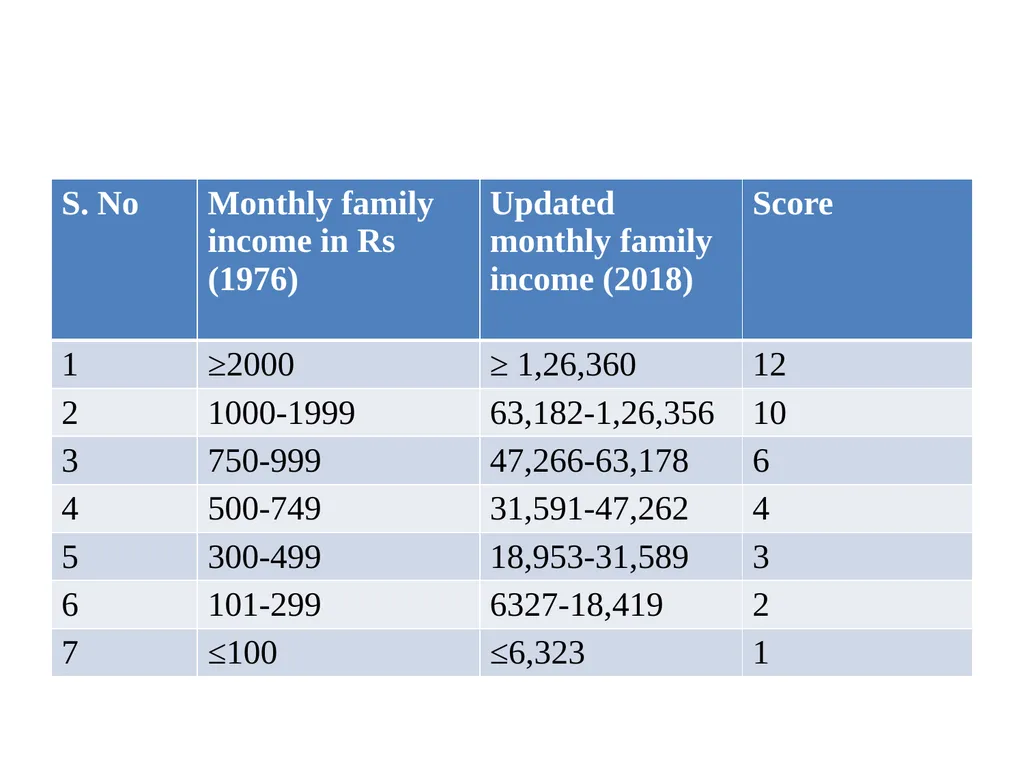
slide8. KUPPUSWAMY METHOD Kuppuswami B (1962) for urban population based on 3 components.
Education of head of family
Occupation of head of family and
Total monthly income of family from all sources
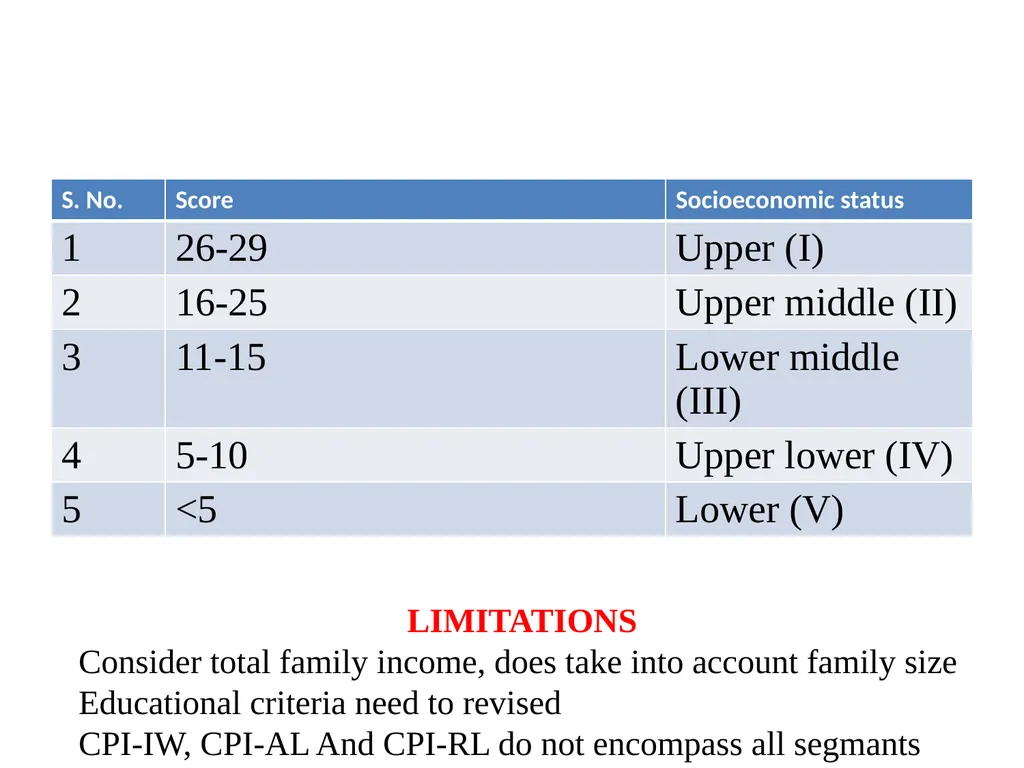
Weighted score is given for each characteristics and total score calculated. Score 3-29 and classify-high, middle and low SES<br>
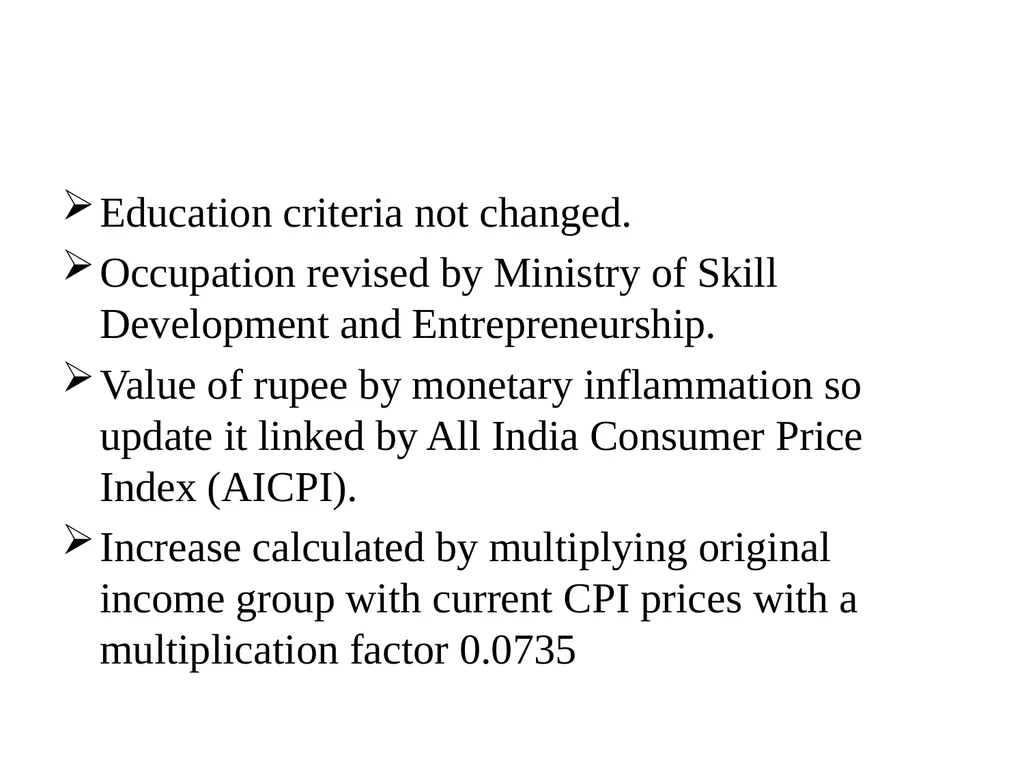
slide9. Education criteria not changed.
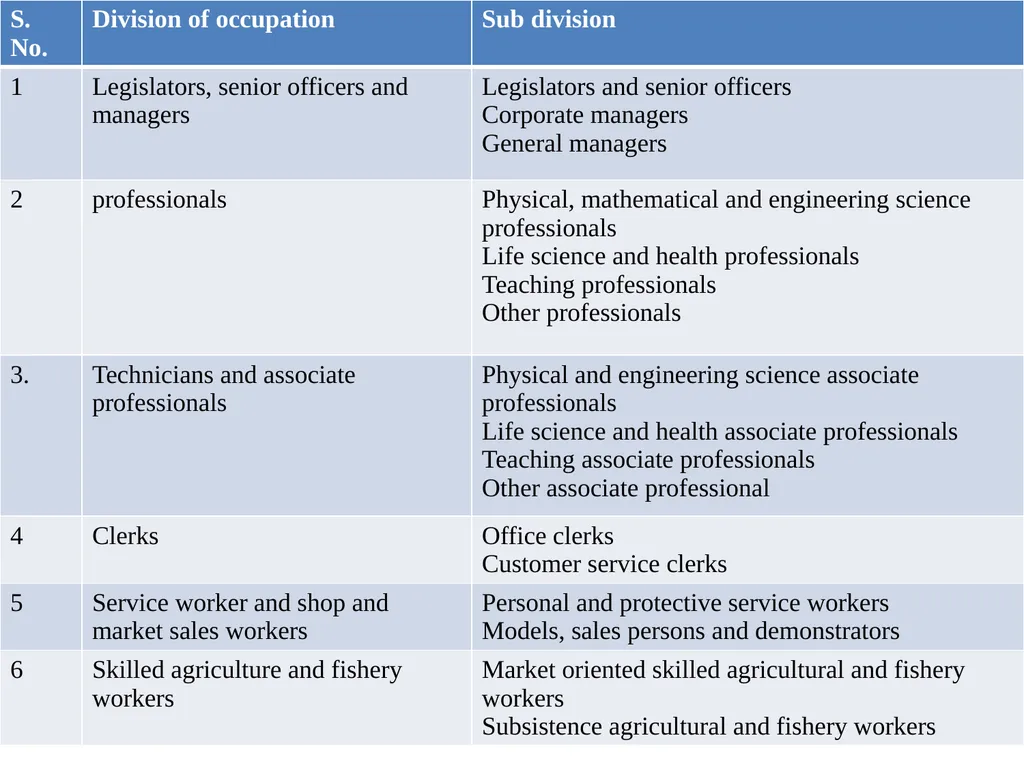
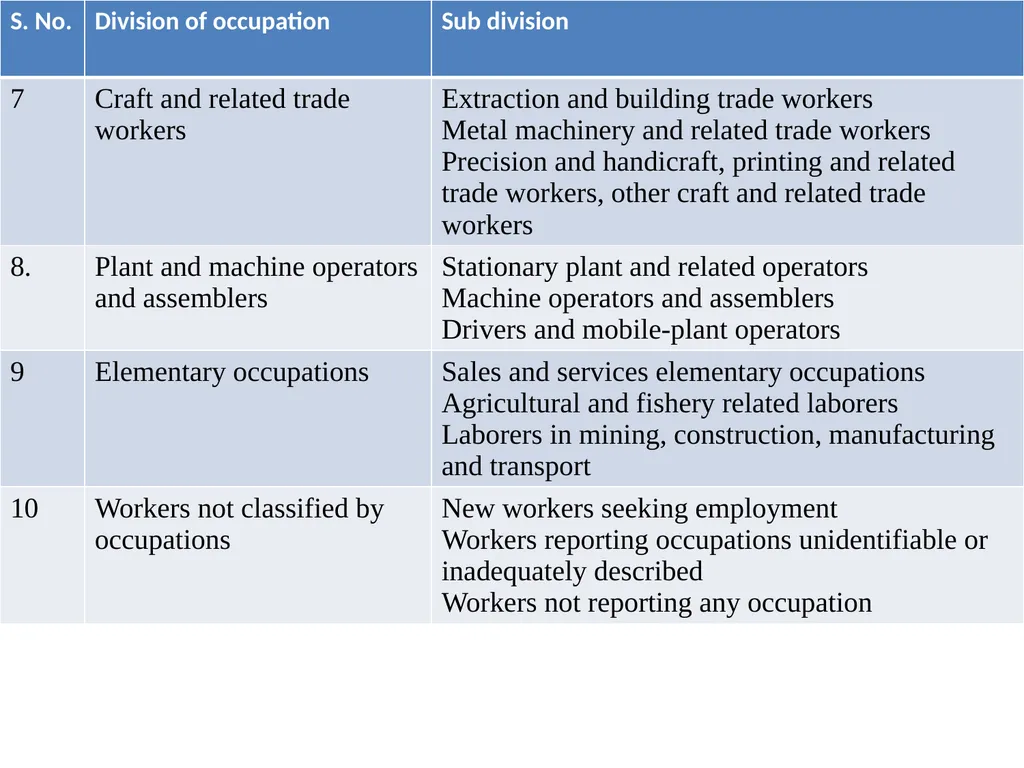
Occupation revised by Ministry of Skill Development and Entrepreneurship.
Value of rupee by monetary inflammation so update it linked by All India Consumer Price Index (AICPI).
Increase calculated by multiplying original income group with current CPI prices with a multiplication factor 0.0735<br>
slide15. LIMITATIONS
Consider total family income, does take into account family size
Educational criteria need to revised
CPI-IW, CPI-AL And CPI-RL do not encompass all segmants<br>
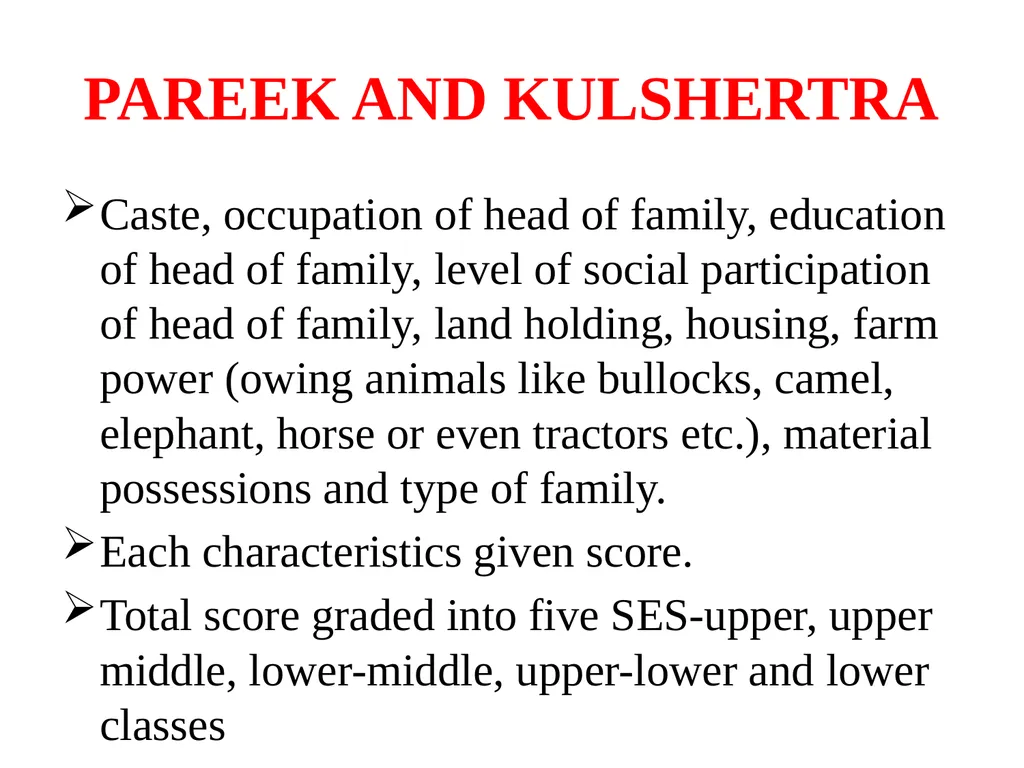
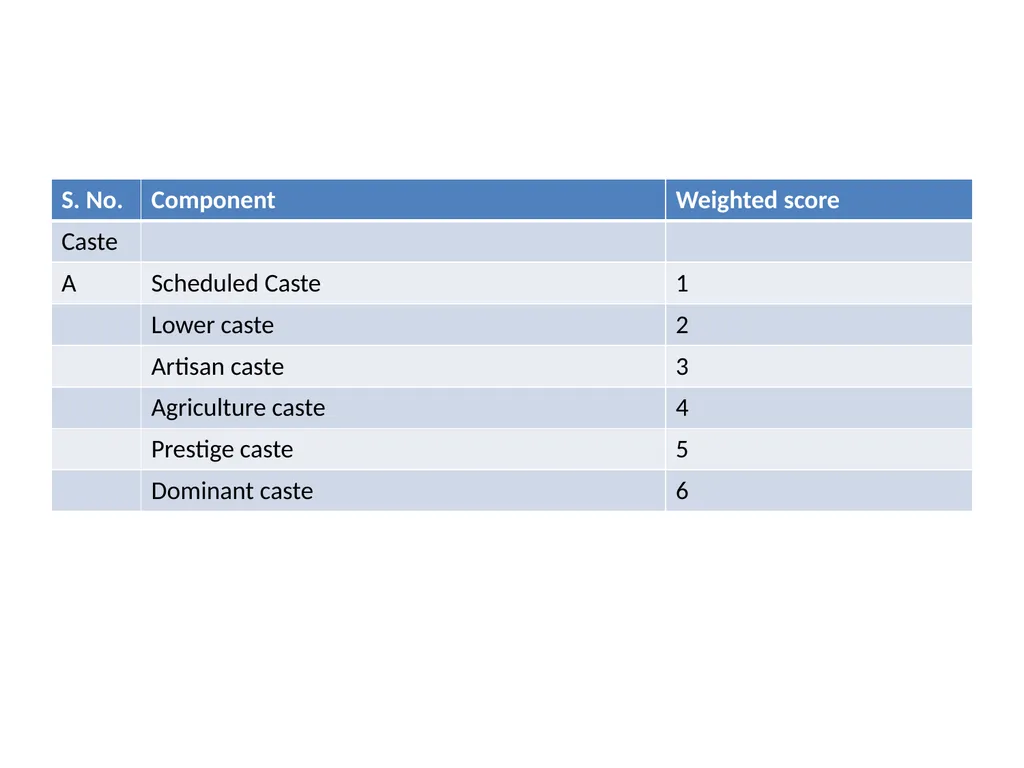
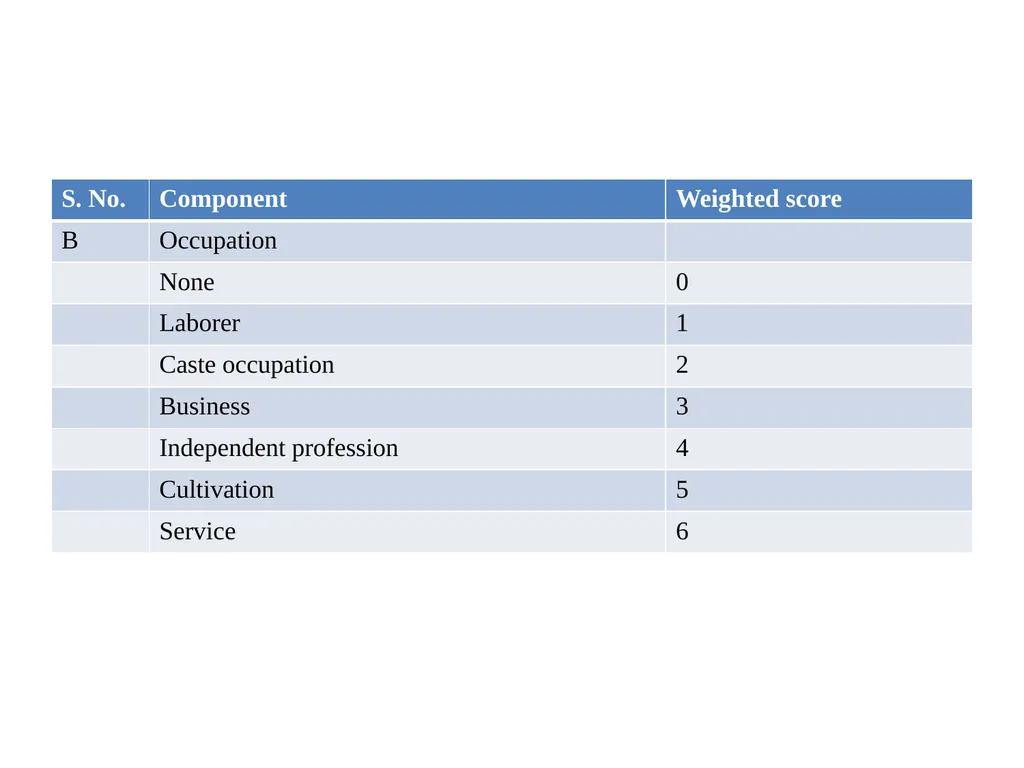
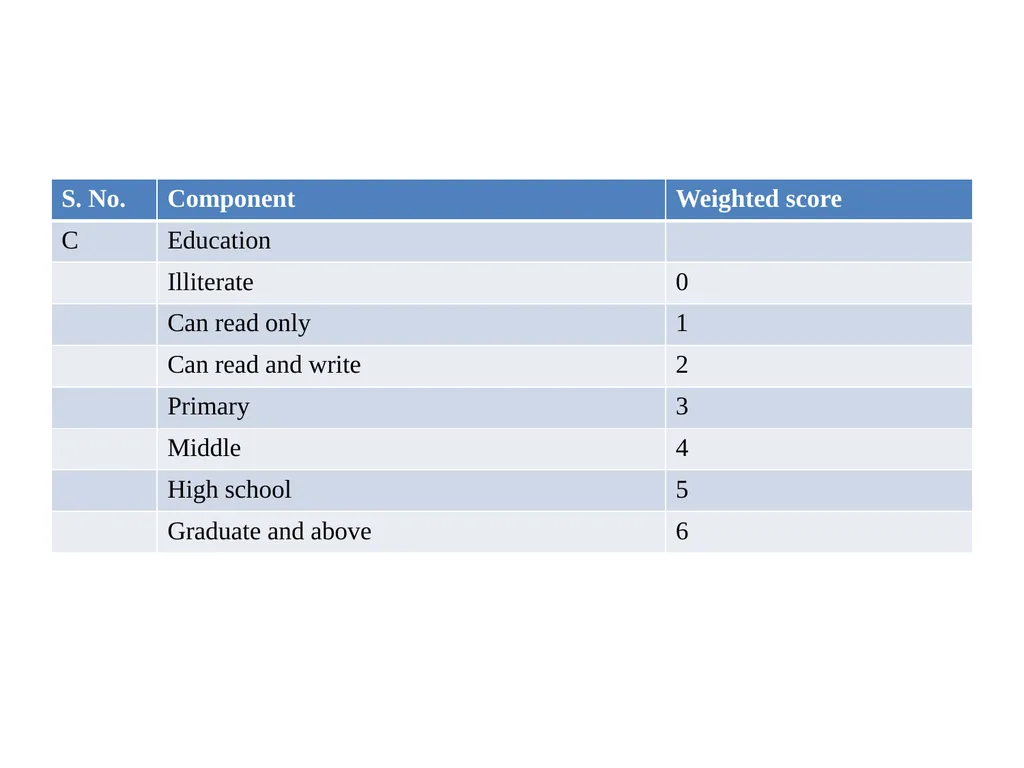
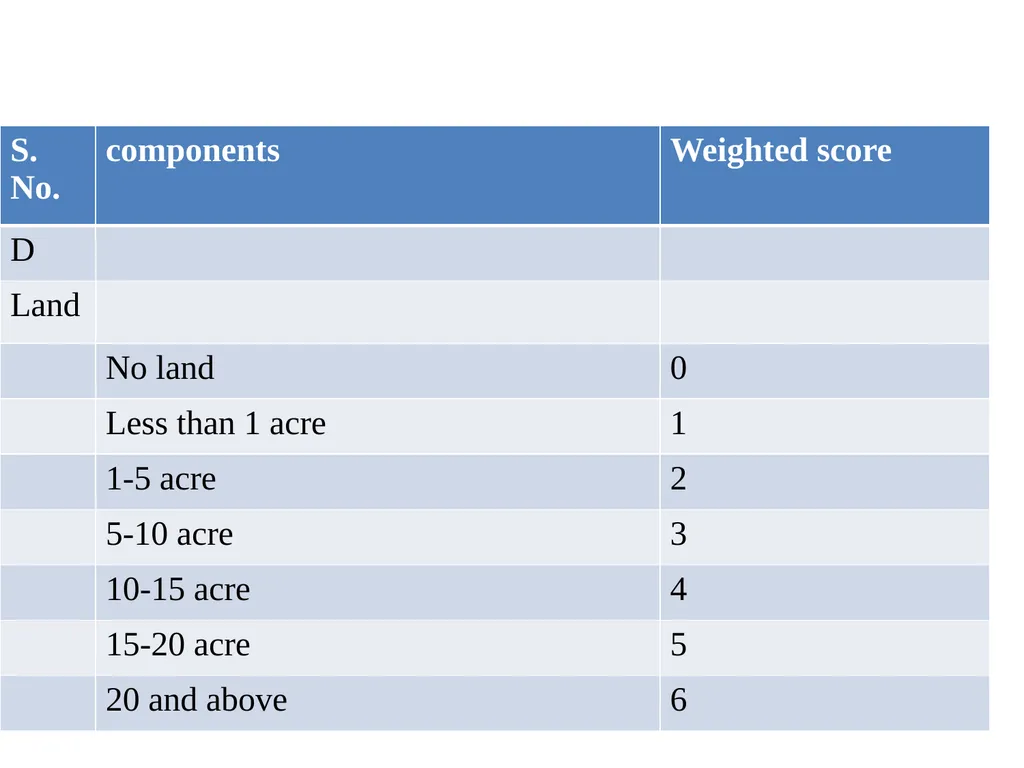
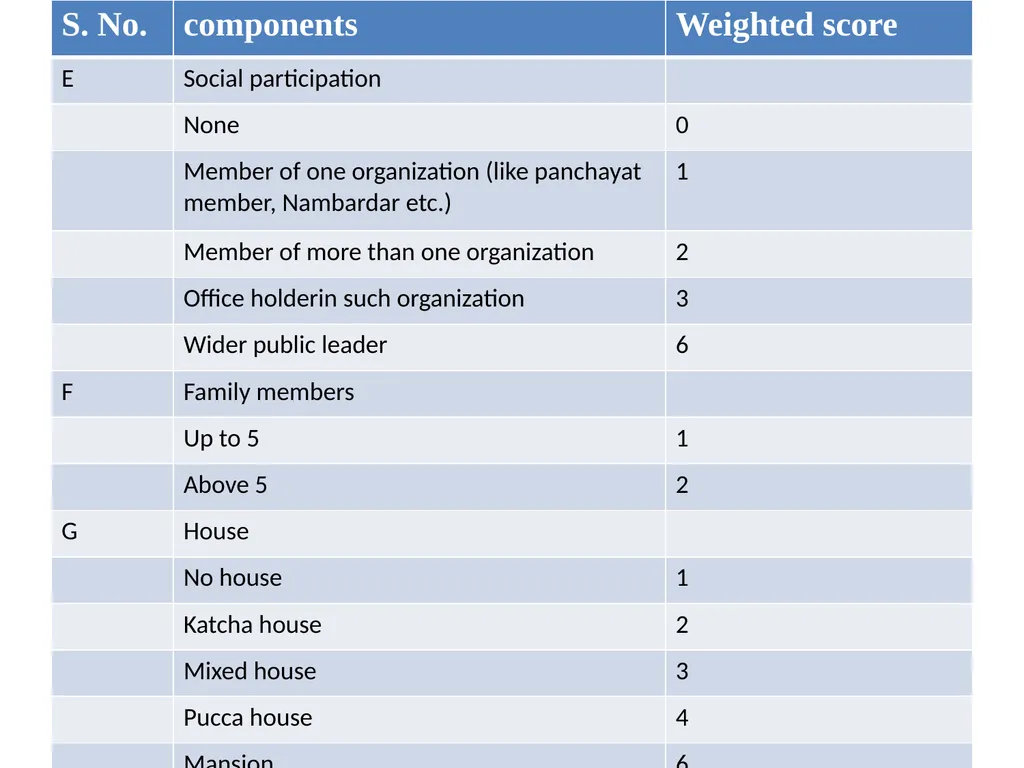
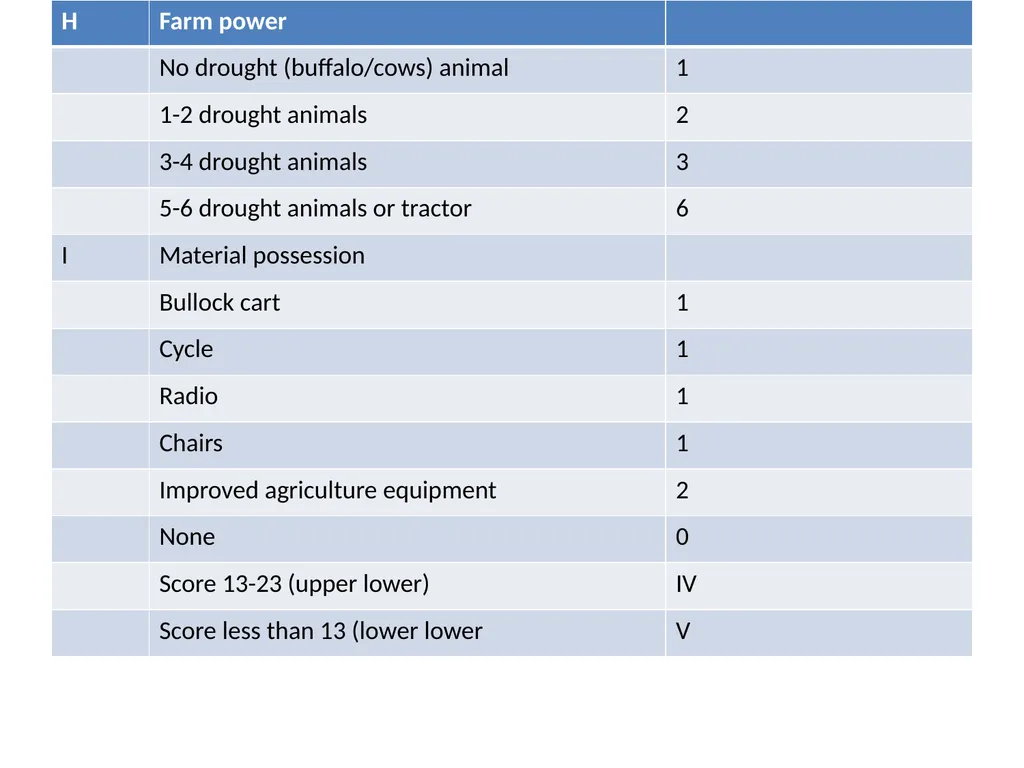
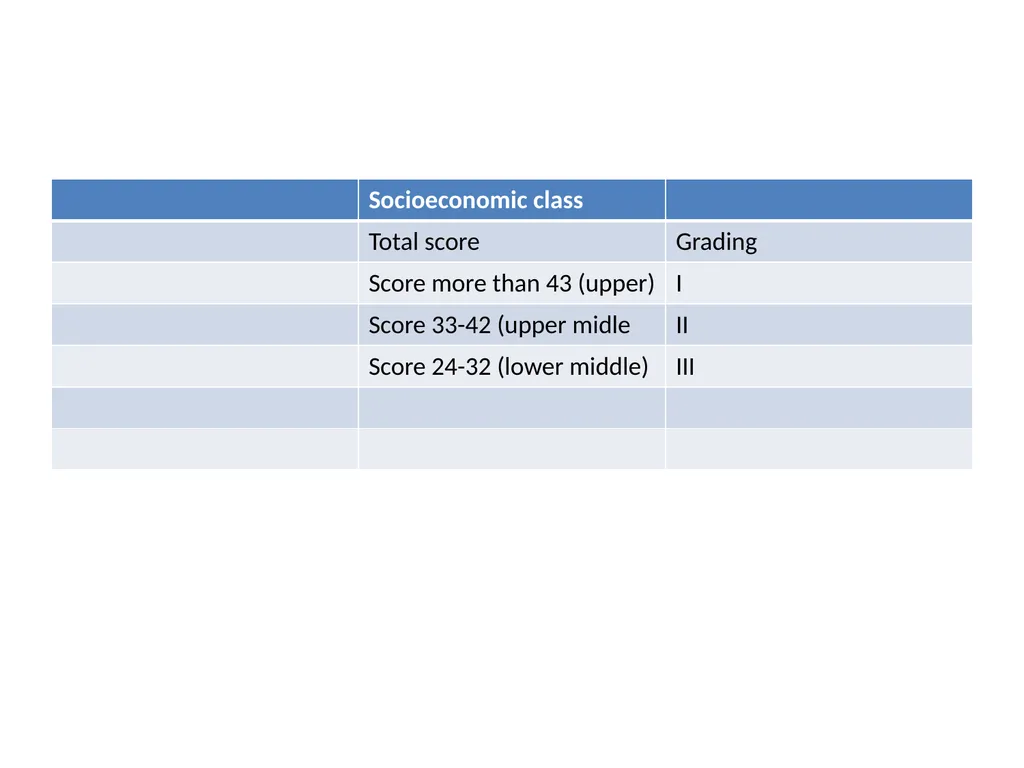
slide16. PAREEK AND KULSHERTRA Caste, occupation of head of family, education of head of family, level of social participation of head of family, land holding, housing, farm power (owing animals like bullocks, camel, elephant, horse or even tractors etc.), material possessions and type of family.
Each characteristics given score.
Total score graded into five SES-upper, upper middle, lower-middle, upper-lower and lower classes<br>
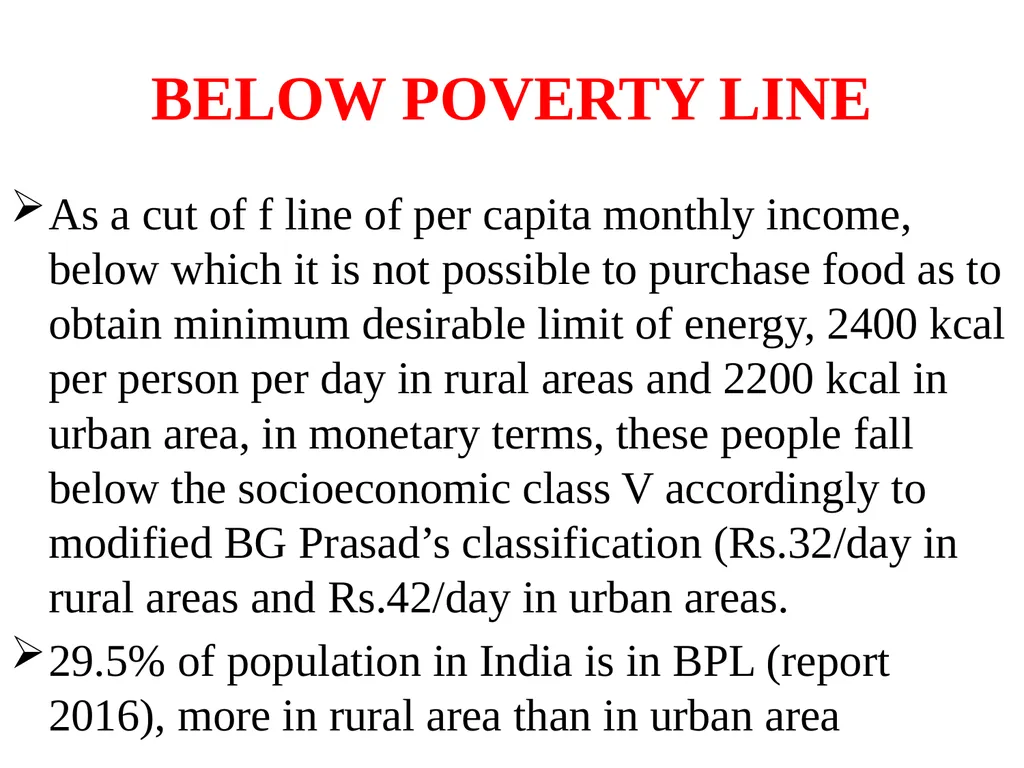
slide24. BELOW POVERTY LINE As a cut of f line of per capita monthly income, below which it is not possible to purchase food as to obtain minimum desirable limit of energy, 2400 kcal per person per day in rural areas and 2200 kcal in urban area, in monetary terms, these people fall below the socioeconomic class V accordingly to modified BG Prasad’s classification (Rs.32/day in rural areas and Rs.42/day in urban areas.
29.5% of population in India is in BPL (report 2016), more in rural area than in urban area<br>
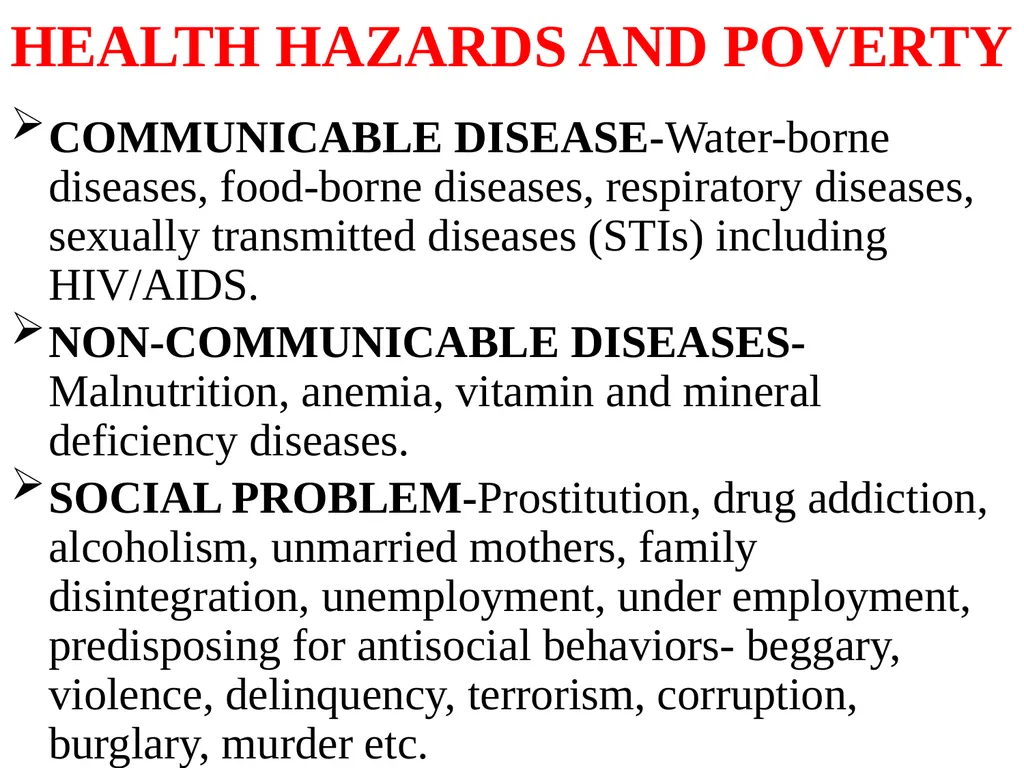
slide25. HEALTH HAZARDS AND POVERTY COMMUNICABLE DISEASE-Water-borne diseases, food-borne diseases, respiratory diseases, sexually transmitted diseases (STIs) including HIV/AIDS.
NON-COMMUNICABLE DISEASES- Malnutrition, anemia, vitamin and mineral deficiency diseases.
SOCIAL PROBLEM-Prostitution, drug addiction, alcoholism, unmarried mothers, family disintegration, unemployment, under employment, predisposing for antisocial behaviors- beggary, violence, delinquency, terrorism, corruption, burglary, murder etc.<br>
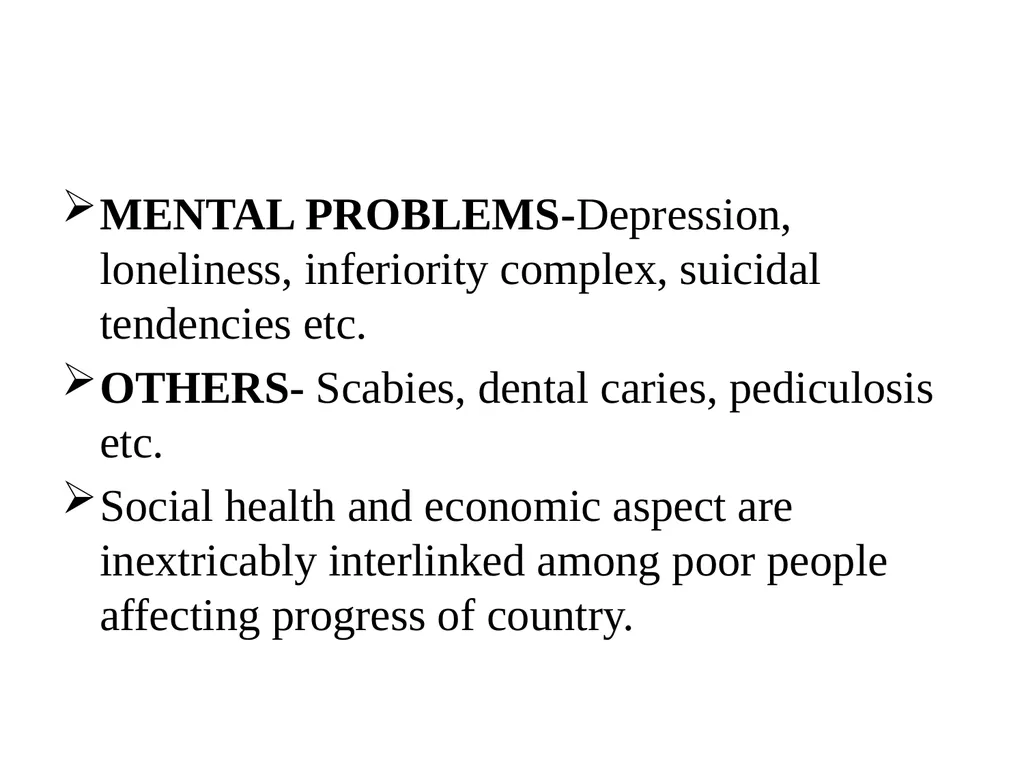
slide26. MENTAL PROBLEMS-Depression, loneliness, inferiority complex, suicidal tendencies etc.
OTHERS- Scabies, dental caries, pediculosis etc.
Social health and economic aspect are inextricably interlinked among poor people affecting progress of country.<br>
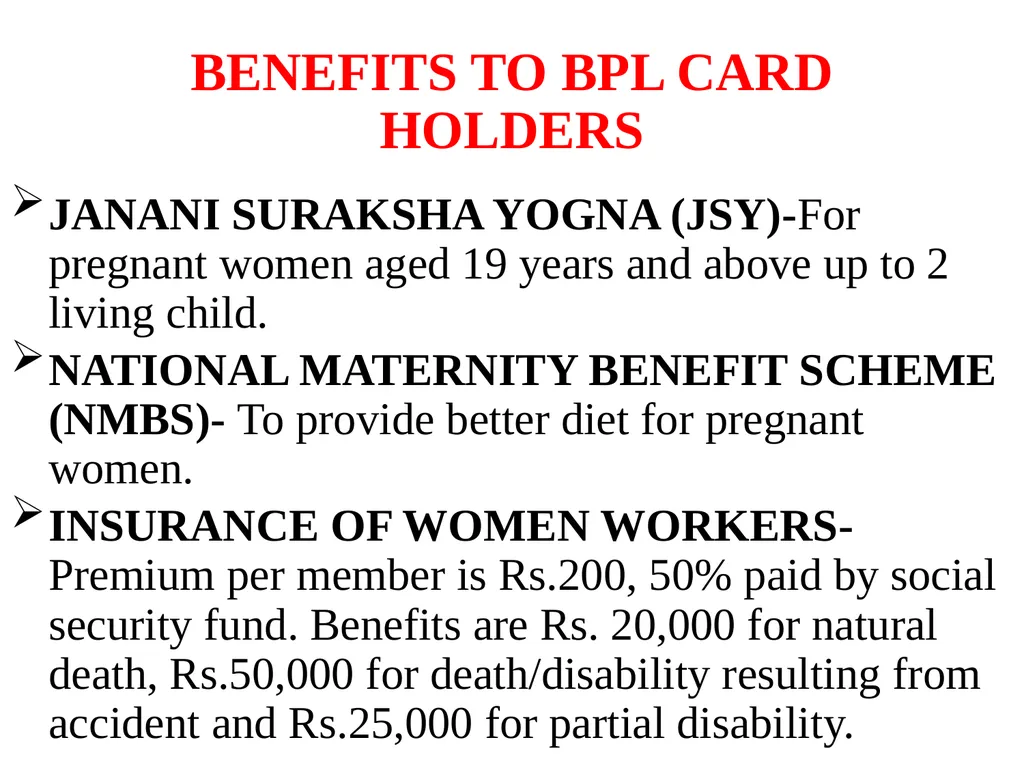
slide27. BENEFITS TO BPL CARD HOLDERS JANANI SURAKSHA YOGNA (JSY)-For pregnant women aged 19 years and above up to 2 living child.
NATIONAL MATERNITY BENEFIT SCHEME (NMBS)- To provide better diet for pregnant women.
INSURANCE OF WOMEN WORKERS- Premium per member is Rs.200, 50% paid by social security fund. Benefits are Rs. 20,000 for natural death, Rs.50,000 for death/disability resulting from accident and Rs.25,000 for partial disability.<br>
slide28. BHAGYALAKSHMI SCHEME- Rs. 10,000 deposit will be made for each of 1st two female children, which will be returned with interest after child attain 18 years of age.
SOCIAL ASSISTANCE-Old pension scheme (Rs. 1,000/month, family benefit scheme, widow pension scheme (widow should be 18 years old).
PRASOOTI ARAIKE- Promote antenatal care by giving Rs. 1,000 at 6th month of pregnancy and other Rs. 1,000 at 9th month.
UJJWALA- Providing LPG cyliders.
AYUSHMAN BHARAT YOGNA-Insurance cover of Rs. 5 lakh/BPL family/year.<br>
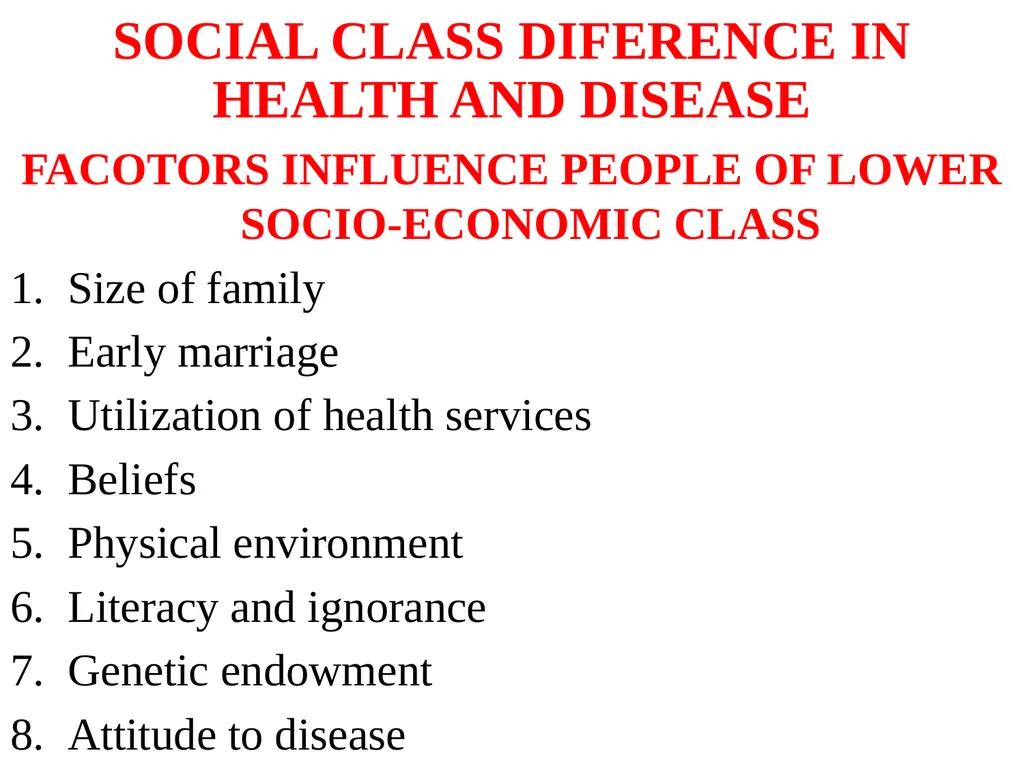
slide29. SOCIAL CLASS DIFERENCE IN HEALTH AND DISEASE FACOTORS INFLUENCE PEOPLE OF LOWER SOCIO-ECONOMIC CLASS
Size of family
Early marriage
Utilization of health services
Beliefs
Physical environment
Literacy and ignorance
Genetic endowment
Attitude to disease<br>
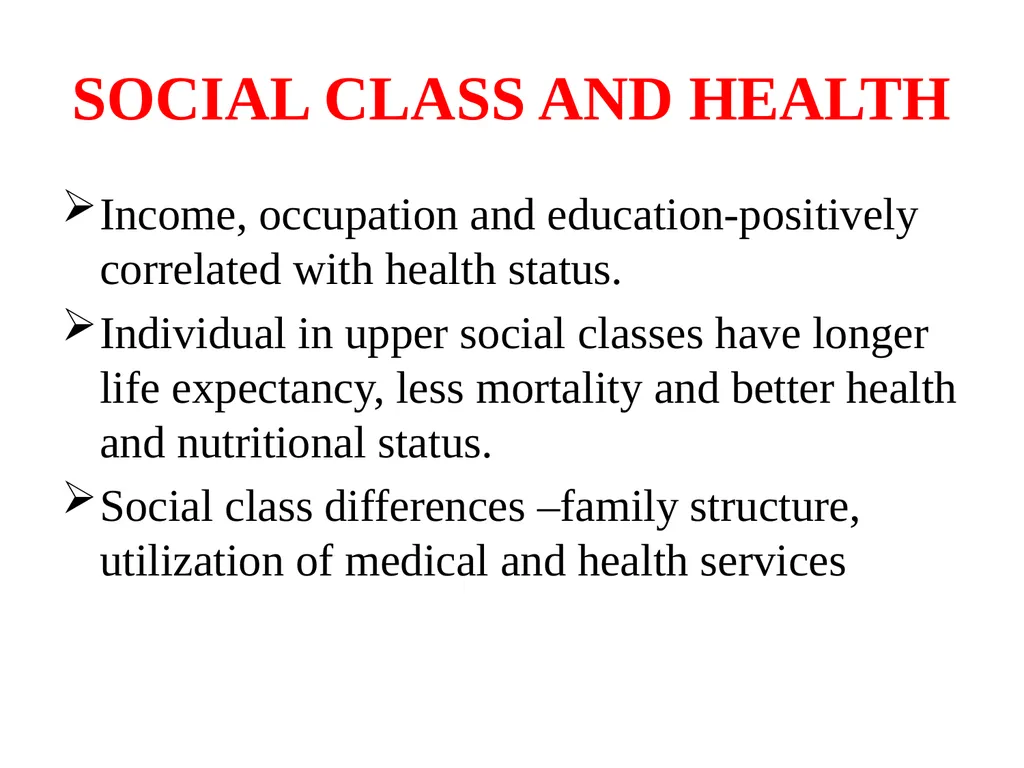
slide30. SOCIAL CLASS AND HEALTH Income, occupation and education-positively correlated with health status.
Individual in upper social classes have longer life expectancy, less mortality and better health and nutritional status.
Social class differences –family structure, utilization of medical and health services<br>
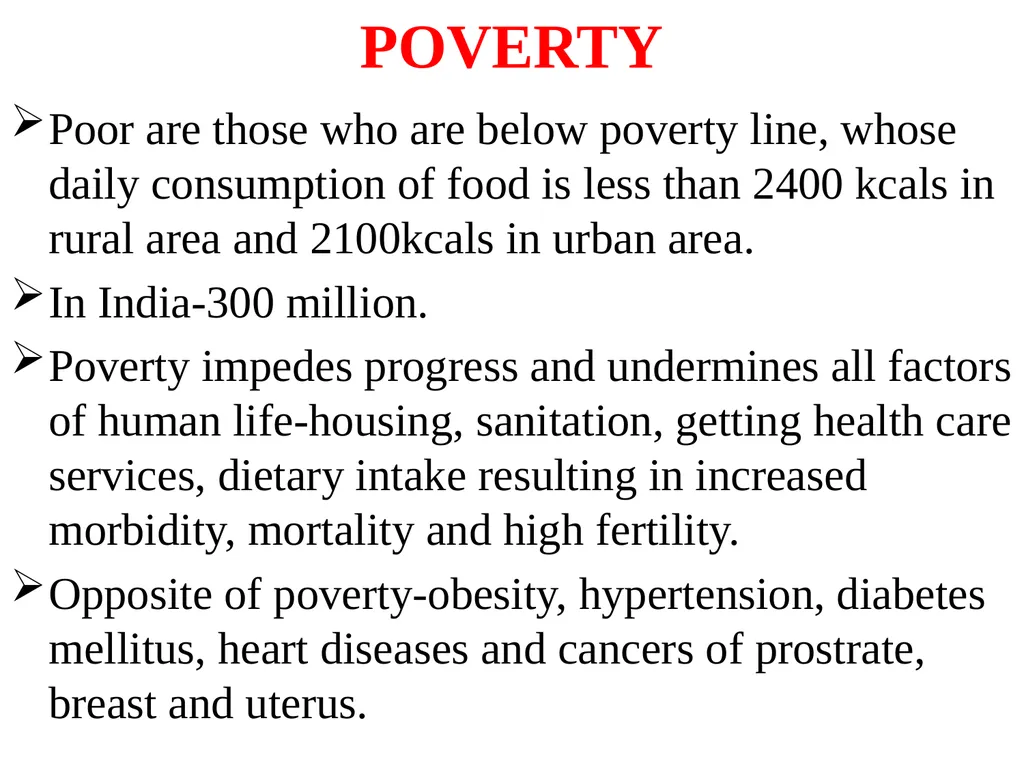
slide31. POVERTY Poor are those who are below poverty line, whose daily consumption of food is less than 2400 kcals in rural area and 2100kcals in urban area.
In India-300 million.
Poverty impedes progress and undermines all factors of human life-housing, sanitation, getting health care services, dietary intake resulting in increased morbidity, mortality and high fertility.
Opposite of poverty-obesity, hypertension, diabetes mellitus, heart diseases and cancers of prostrate, breast and uterus.<br>
slide32. ILLITERACY AND IGNORANCE Illiteracy goes hand in hand with poverty.
Illiteracy and ignorance-root cause of poverty in India-unhealthy lifestyle.<br>
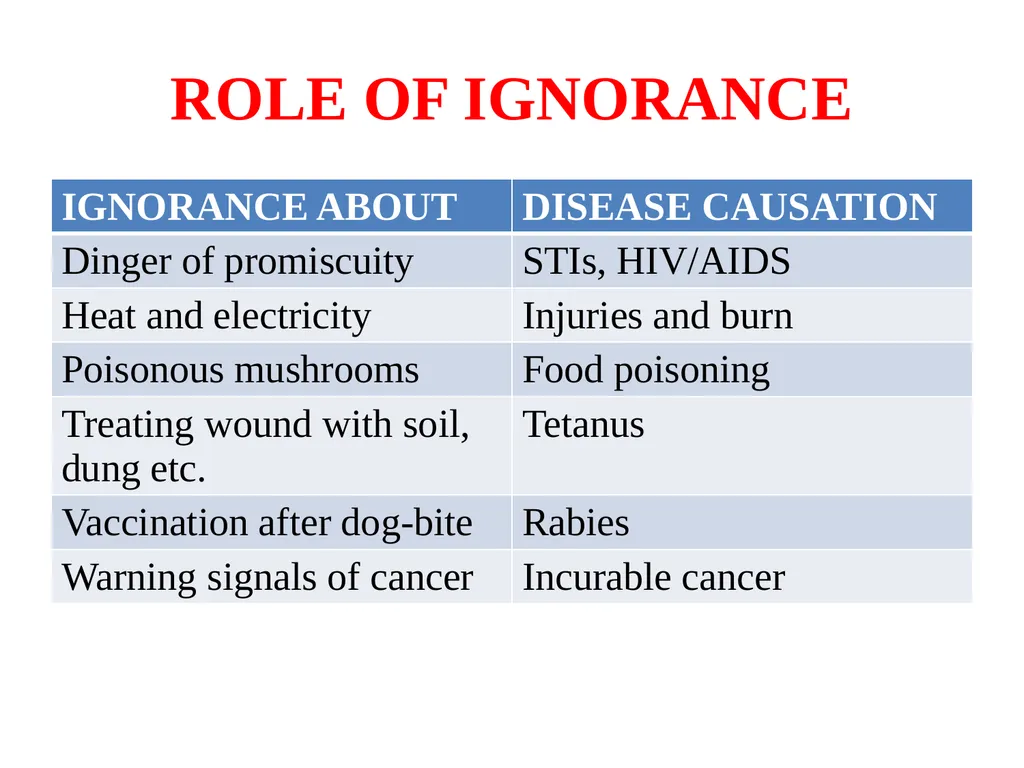
slide33. ROLE OF IGNORANCE<br>
slide2. INTRODUCTION Three variables determines socioeconomic status of individual/ family.
Education
occupation
Income<br>
slide3. CLASSIFICATION OF SOCIOECONOMIC STATUS METHODS OF ASSESSING S.E.STATUS
BG Prasad method
Kuppuswamy’s method
Prateek method
Kulshrestra method<br>
slide4. PRASAD’S METHOD BG Prasad (1961)- per capita family monthly income as an indicator and classified status into 5 group.
Useful social classification of family not individual.
Since value of rupee changes, update value of rupee applying appropriate “correction factor” (CF).
CF- by multiplying AICPI by 4.93% as suggested by Kumar.
Preferred for rural areas.<br>
slide5. Modified BG Prasad Classification
= BG Prasad X CF
Per capita monthly income
= Total monthly income of family
Total members of family<br>
slide7. CF =AICPI (Rs 1250 in November 2015) multiplied by 0.0493 therefore CF during November 2015 was 62<br>
slide8. KUPPUSWAMY METHOD Kuppuswami B (1962) for urban population based on 3 components.
Education of head of family
Occupation of head of family and
Total monthly income of family from all sources
Weighted score is given for each characteristics and total score calculated. Score 3-29 and classify-high, middle and low SES<br>
slide9. Education criteria not changed.
Occupation revised by Ministry of Skill Development and Entrepreneurship.
Value of rupee by monetary inflammation so update it linked by All India Consumer Price Index (AICPI).
Increase calculated by multiplying original income group with current CPI prices with a multiplication factor 0.0735<br>
slide15. LIMITATIONS
Consider total family income, does take into account family size
Educational criteria need to revised
CPI-IW, CPI-AL And CPI-RL do not encompass all segmants<br>
slide16. PAREEK AND KULSHERTRA Caste, occupation of head of family, education of head of family, level of social participation of head of family, land holding, housing, farm power (owing animals like bullocks, camel, elephant, horse or even tractors etc.), material possessions and type of family.
Each characteristics given score.
Total score graded into five SES-upper, upper middle, lower-middle, upper-lower and lower classes<br>
slide24. BELOW POVERTY LINE As a cut of f line of per capita monthly income, below which it is not possible to purchase food as to obtain minimum desirable limit of energy, 2400 kcal per person per day in rural areas and 2200 kcal in urban area, in monetary terms, these people fall below the socioeconomic class V accordingly to modified BG Prasad’s classification (Rs.32/day in rural areas and Rs.42/day in urban areas.
29.5% of population in India is in BPL (report 2016), more in rural area than in urban area<br>
slide25. HEALTH HAZARDS AND POVERTY COMMUNICABLE DISEASE-Water-borne diseases, food-borne diseases, respiratory diseases, sexually transmitted diseases (STIs) including HIV/AIDS.
NON-COMMUNICABLE DISEASES- Malnutrition, anemia, vitamin and mineral deficiency diseases.
SOCIAL PROBLEM-Prostitution, drug addiction, alcoholism, unmarried mothers, family disintegration, unemployment, under employment, predisposing for antisocial behaviors- beggary, violence, delinquency, terrorism, corruption, burglary, murder etc.<br>
slide26. MENTAL PROBLEMS-Depression, loneliness, inferiority complex, suicidal tendencies etc.
OTHERS- Scabies, dental caries, pediculosis etc.
Social health and economic aspect are inextricably interlinked among poor people affecting progress of country.<br>
slide27. BENEFITS TO BPL CARD HOLDERS JANANI SURAKSHA YOGNA (JSY)-For pregnant women aged 19 years and above up to 2 living child.
NATIONAL MATERNITY BENEFIT SCHEME (NMBS)- To provide better diet for pregnant women.
INSURANCE OF WOMEN WORKERS- Premium per member is Rs.200, 50% paid by social security fund. Benefits are Rs. 20,000 for natural death, Rs.50,000 for death/disability resulting from accident and Rs.25,000 for partial disability.<br>
slide28. BHAGYALAKSHMI SCHEME- Rs. 10,000 deposit will be made for each of 1st two female children, which will be returned with interest after child attain 18 years of age.
SOCIAL ASSISTANCE-Old pension scheme (Rs. 1,000/month, family benefit scheme, widow pension scheme (widow should be 18 years old).
PRASOOTI ARAIKE- Promote antenatal care by giving Rs. 1,000 at 6th month of pregnancy and other Rs. 1,000 at 9th month.
UJJWALA- Providing LPG cyliders.
AYUSHMAN BHARAT YOGNA-Insurance cover of Rs. 5 lakh/BPL family/year.<br>
slide29. SOCIAL CLASS DIFERENCE IN HEALTH AND DISEASE FACOTORS INFLUENCE PEOPLE OF LOWER SOCIO-ECONOMIC CLASS
Size of family
Early marriage
Utilization of health services
Beliefs
Physical environment
Literacy and ignorance
Genetic endowment
Attitude to disease<br>
slide30. SOCIAL CLASS AND HEALTH Income, occupation and education-positively correlated with health status.
Individual in upper social classes have longer life expectancy, less mortality and better health and nutritional status.
Social class differences –family structure, utilization of medical and health services<br>
slide31. POVERTY Poor are those who are below poverty line, whose daily consumption of food is less than 2400 kcals in rural area and 2100kcals in urban area.
In India-300 million.
Poverty impedes progress and undermines all factors of human life-housing, sanitation, getting health care services, dietary intake resulting in increased morbidity, mortality and high fertility.
Opposite of poverty-obesity, hypertension, diabetes mellitus, heart diseases and cancers of prostrate, breast and uterus.<br>
slide32. ILLITERACY AND IGNORANCE Illiteracy goes hand in hand with poverty.
Illiteracy and ignorance-root cause of poverty in India-unhealthy lifestyle.<br>
slide33. ROLE OF IGNORANCE<br>