Solving Business Problems Using Mekko Graphics Improve Customer Loyalty and Reduce Churn Research has repeatedly shown that existing customers spend more, purchase higher margin products and services, and are more likely to refer additional
"Solving Business Problems Using Mekko Graphics" is the property of its rightful owner. Permission is granted to
download and print the materials on this website for personal, non-commercial use only, and to display it
on your personal computer provided you do not modify the materials and that you retain all copyright
notices contained in the materials. By downloading content from our website, you accept the terms of this
agreement.
Presentation Transcript
01
Solving Business Problems Using Mekko Graphics Improve Customer Loyalty and Reduce Churn<br>
02
Research has repeatedly shown that existing customers spend more, purchase higher margin products and services, and are more likely to refer additional customers.1
So, how do you avoid the high price of constantly replacing existing customers with new ones? Knowing the reasons why your customers are leaving you or spending less with you can help you to respond to issues and retain more customers.
Using Mekko Graphics you can examine revenue churn and determine the cause for controllable churn. Here is how… Improve Customer Loyalty and Reduce Churn 1. Gartner, 2004: “Replace Customer Churn Predictions With Retention Analysis”<br>
03
Begin with Analysis
Draw Conclusions
Identify Areas for Improvement Improve Customer Loyalty and Reduce Churn<br>
04
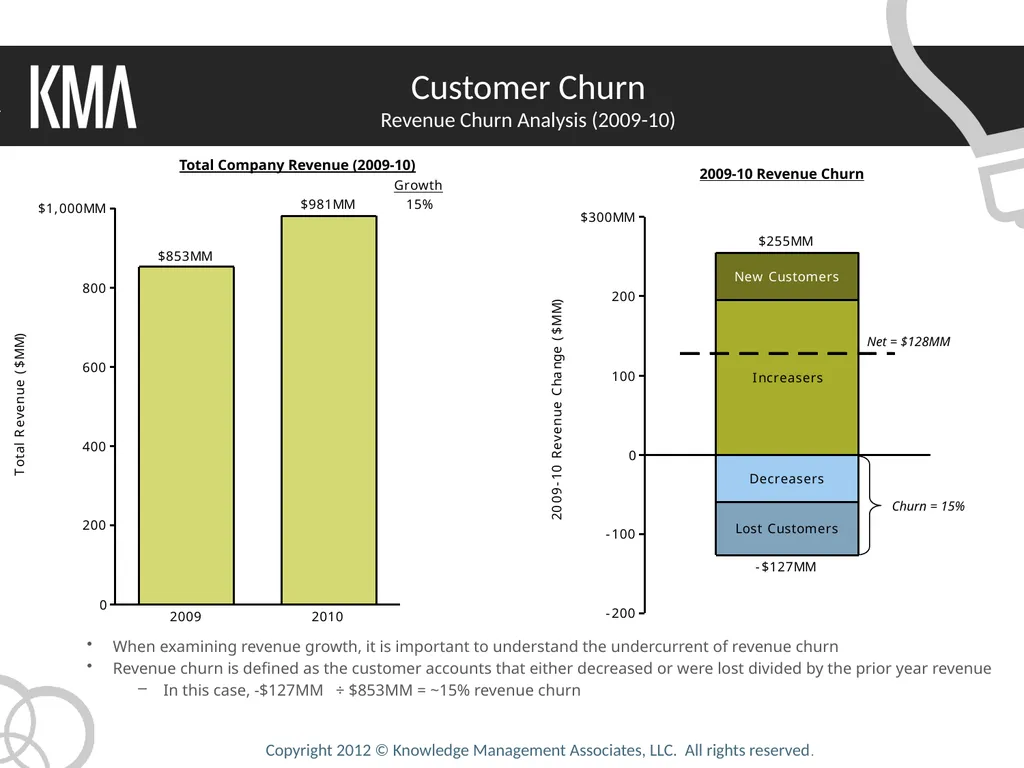
Customer Churn Revenue Churn Analysis (2009-10) Total Company Revenue (2009-10) 2009-10 Revenue Churn Churn = 15% Net = $128MM When examining revenue growth, it is important to understand the undercurrent of revenue churn
Revenue churn is defined as the customer accounts that either decreased or were lost divided by the prior year revenue
In this case, -$127MM ÷ $853MM = ~15% revenue churn<br>
05
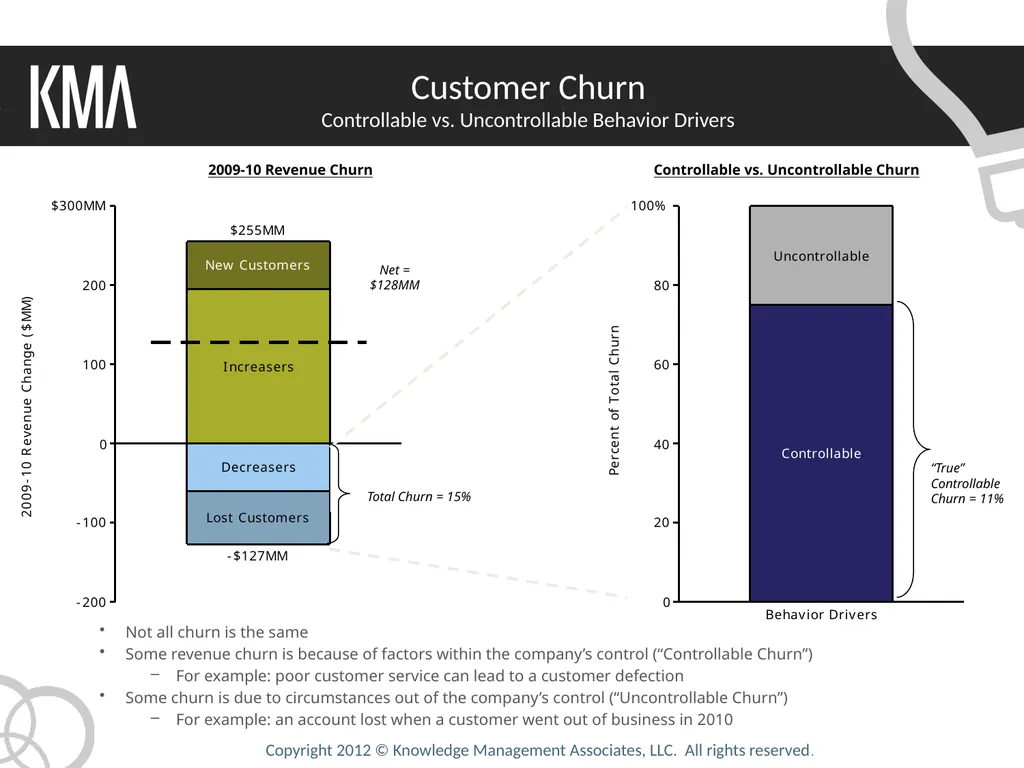
Customer Churn Controllable vs. Uncontrollable Behavior Drivers Controllable vs. Uncontrollable Churn 2009-10 Revenue Churn Net =
$128MM Total Churn = 15% “True” Controllable
Churn = 11% Not all churn is the same
Some revenue churn is because of factors within the company’s control (“Controllable Churn”)
For example: poor customer service can lead to a customer defection
Some churn is due to circumstances out of the company’s control (“Uncontrollable Churn”)
For example: an account lost when a customer went out of business in 2010<br>
06
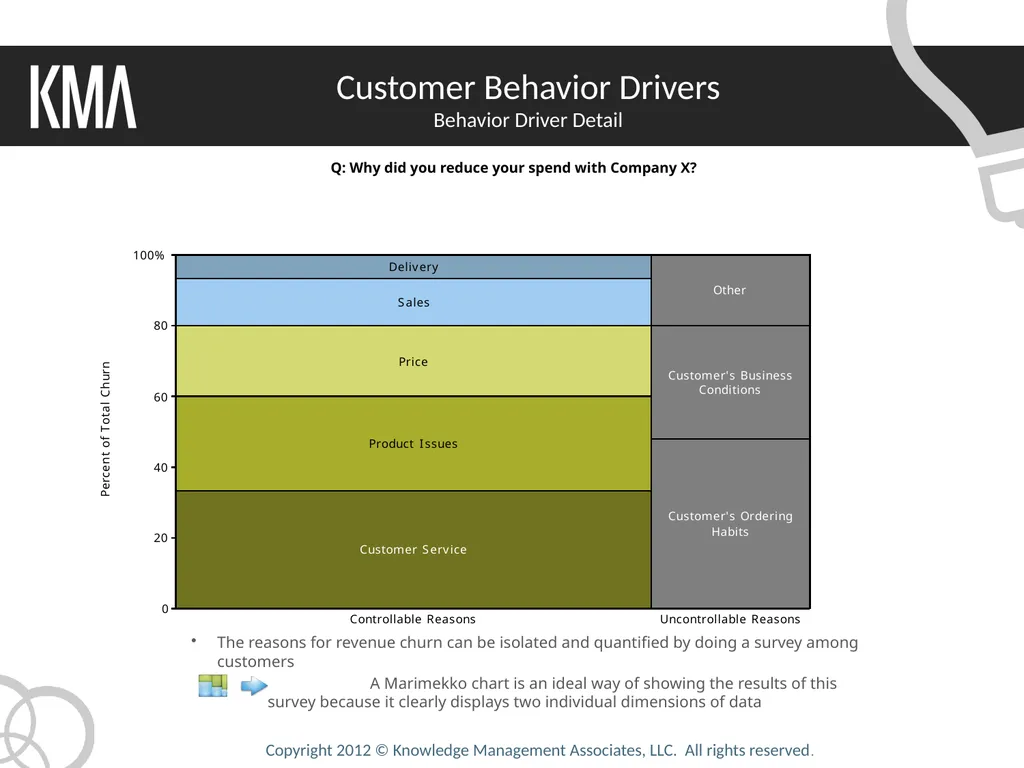
Customer Behavior Drivers Behavior Driver Detail Q: Why did you reduce your spend with Company X? The reasons for revenue churn can be isolated and quantified by doing a survey among customers
A Marimekko chart is an ideal way of showing the results of this survey because it clearly displays two individual dimensions of data<br>
07
Begin with Analysis
Draw Conclusions
Identify Areas for Improvement Improve Customer Loyalty and Reduce Churn<br>
08
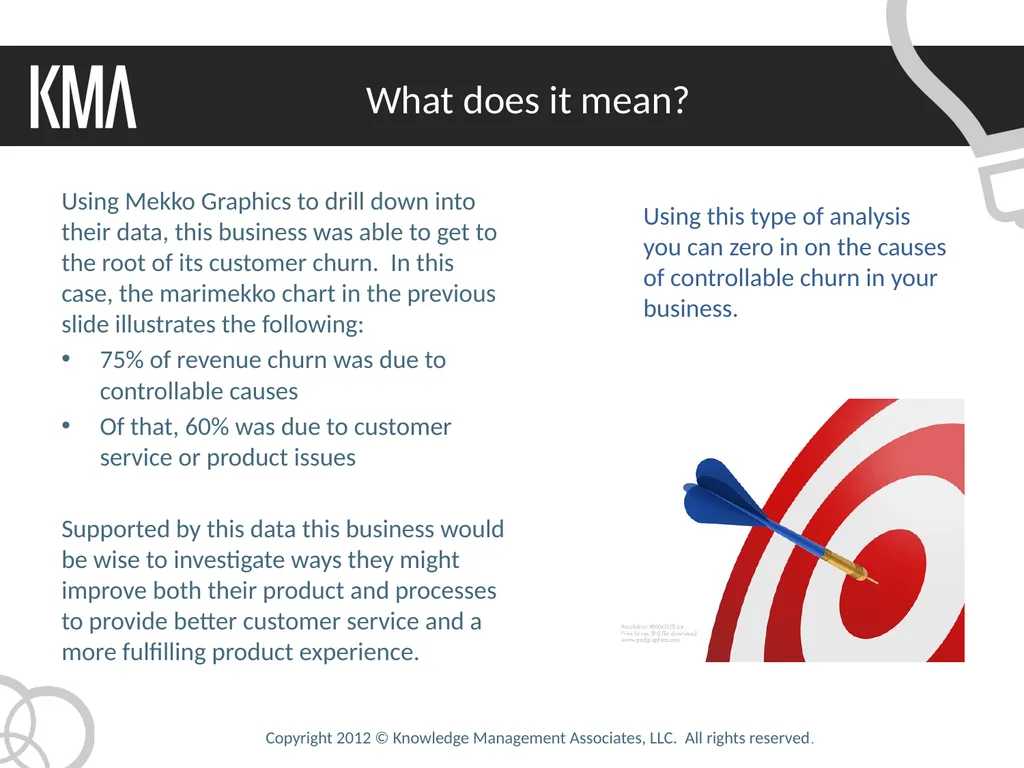
Using Mekko Graphics to drill down into their data, this business was able to get to the root of its customer churn. In this case, the marimekko chart in the previous slide illustrates the following:
75% of revenue churn was due to controllable causes
Of that, 60% was due to customer service or product issues
Supported by this data this business would be wise to investigate ways they might improve both their product and processes to provide better customer service and a more fulfilling product experience. What does it mean? Using this type of analysis you can zero in on the causes of controllable churn in your business.<br>
09
Begin with Analysis
Draw Conclusions
Identify Areas for Improvement Improve Customer Loyalty and Reduce Churn<br>
10
Ask the right questions:
In this example a reasonable search for improvement areas could begin with questions such as:
Are employees properly trained to address customer issues?
How could feedback from customers be collected earlier in the cycle so that issues could be resolved and defection prevented?
Do employees have the necessary skills to produce the best possible products and services?
Is emphasis placed on ensuring a positive off the shelf experience with the product? So Now What? Asking the right questions based on your analysis can help you identify key areas for improvement to increase customer loyalty and reduce controllable churn.<br>