Some Implications of Using Global Warming Levels for Characterizing Coastal Hazards under Climate Change Joe Barsugli CIRES, University of Colorado Boulder, affiliated with NOAA Physical Sciences Laboratory (PSL) Based on work with the
"Some Implications of Using Global Warming Levels" is the property of its rightful owner. Permission is granted to
download and print the materials on this website for personal, non-commercial use only, and to display it
on your personal computer provided you do not modify the materials and that you retain all copyright
notices contained in the materials. By downloading content from our website, you accept the terms of this
agreement.
Share
Embed code
Presentation Transcript
01
Some Implications of Using Global Warming Levels for Characterizing Coastal Hazards under Climate Change Joe Barsugli
CIRES, University of Colorado Boulder, affiliated with NOAA Physical Sciences Laboratory (PSL)
Based on work with the ASCE-NOAA Task Force on Climate Resilience in Engineering Practice, Dan Walker, Bilal Ayyub, John Dai, Michele Barbato, Abbie Liel and many others<br>
02
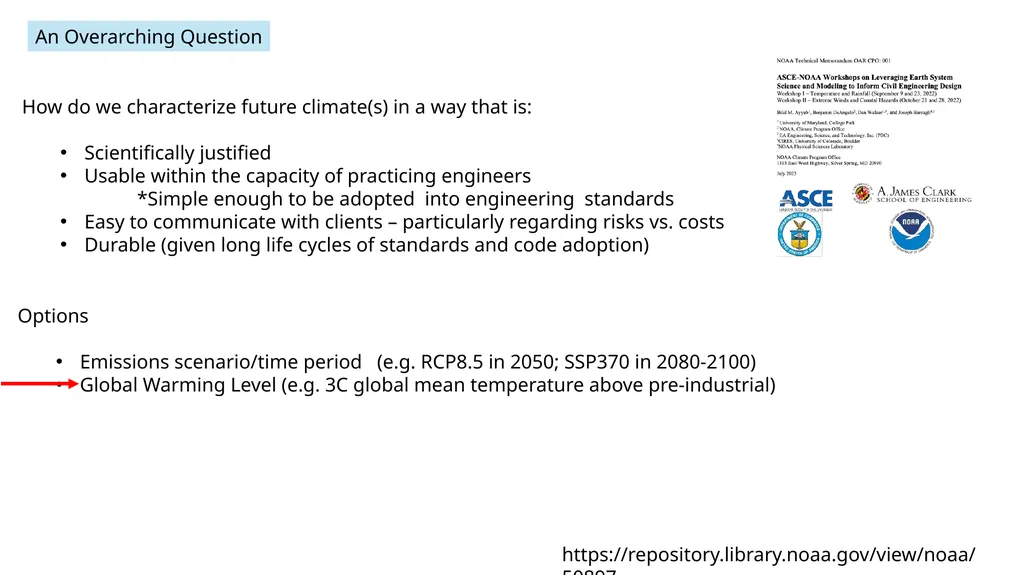
An Overarching Question How do we characterize future climate(s) in a way that is:
Scientifically justified
Usable within the capacity of practicing engineers
*Simple enough to be adopted into engineering standards
Easy to communicate with clients – particularly regarding risks vs. costs
Durable (given long life cycles of standards and code adoption) Options
Emissions scenario/time period (e.g. RCP8.5 in 2050; SSP370 in 2080-2100)
Global Warming Level (e.g. 3C global mean temperature above pre-industrial) https://repository.library.noaa.gov/view/noaa/50897<br>
03
GWL is the change in globally averaged temperature temperature relative to a baseline period
Global Mean Surface Temperature (GMST) – near-surface (2m) air temperature over land and ice, and sea-surface temperature over oceans (typically)
Global Mean Surface Air Temperature (GMSAT or GSAT) What is Global Warming Level (GWL)? Source: NOAA Climate at at Glance 1850-1900 climate baseline period typical, but others used (“pre-industrial”, 1901-2000)
Baseline shifts are easy--just add or subtract
Moving average – typically 20 years -- to lessen fluctuations due El Niño, random weather effects, etc.
IPCC AR6: GWL is an “integrating dimension” – underlying model simulations and scenarios are the foundation, but GWL is used to filter/align according to the GWL We are currently at ~ 1.1 – 1.2° C above
the 1850-1900 baseline<br>
04
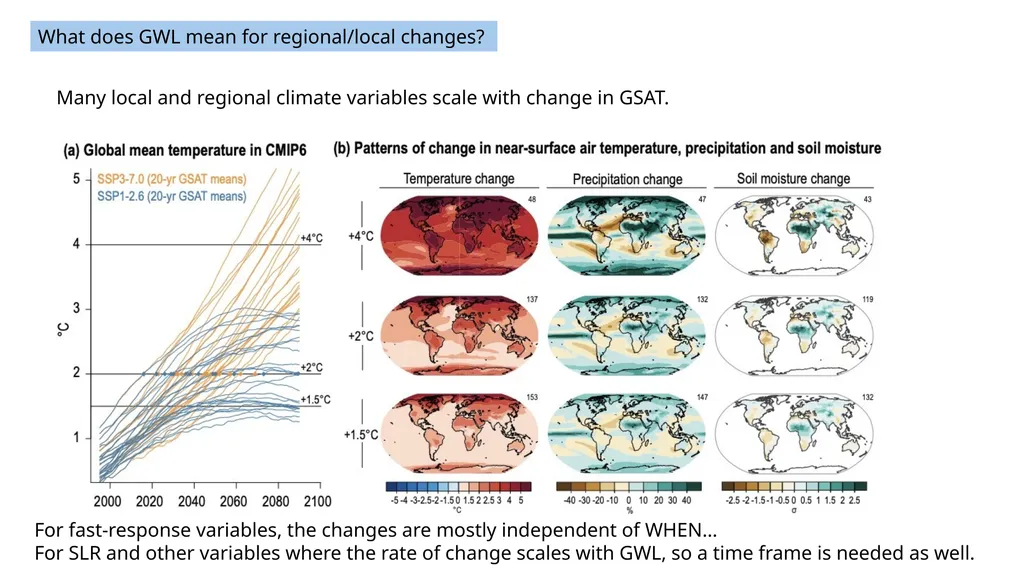
Many local and regional climate variables scale with change in GSAT. What does GWL mean for regional/local changes? For fast-response variables, the changes are mostly independent of WHEN…
For SLR and other variables where the rate of change scales with GWL, so a time frame is needed as well.<br>
05
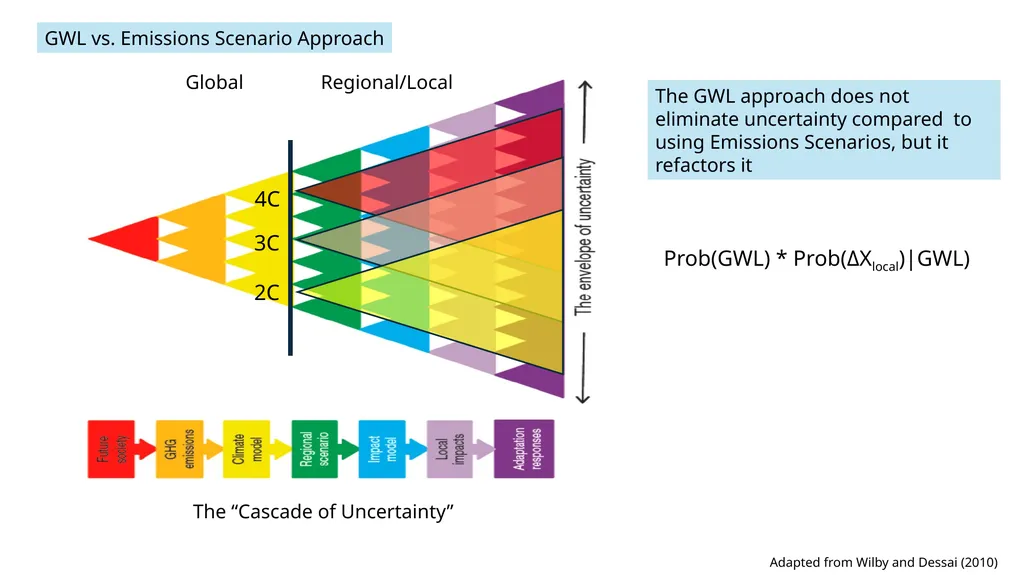
The “Cascade of Uncertainty” Prob(GWL) * Prob(ΔXlocal)|GWL) Adapted from Wilby and Dessai (2010) The GWL approach does not eliminate uncertainty compared to using Emissions Scenarios, but it refactors it GWL vs. Emissions Scenario Approach<br>
06
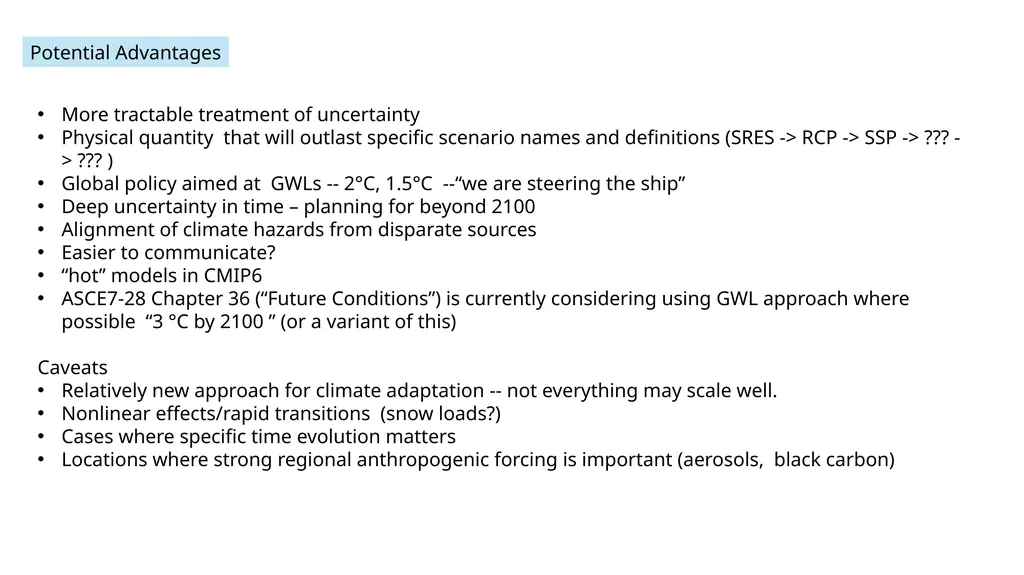
More tractable treatment of uncertainty
Physical quantity that will outlast specific scenario names and definitions (SRES -> RCP -> SSP -> ??? -> ??? )
Global policy aimed at GWLs -- 2°C, 1.5°C --“we are steering the ship”
Deep uncertainty in time – planning for beyond 2100
Alignment of climate hazards from disparate sources
Easier to communicate?
“hot” models in CMIP6
ASCE7-28 Chapter 36 (“Future Conditions”) is currently considering using GWL approach where possible “3 °C by 2100 ” (or a variant of this)
Caveats
Relatively new approach for climate adaptation -- not everything may scale well.
Nonlinear effects/rapid transitions (snow loads?)
Cases where specific time evolution matters
Locations where strong regional anthropogenic forcing is important (aerosols, black carbon) Potential Advantages<br>
07
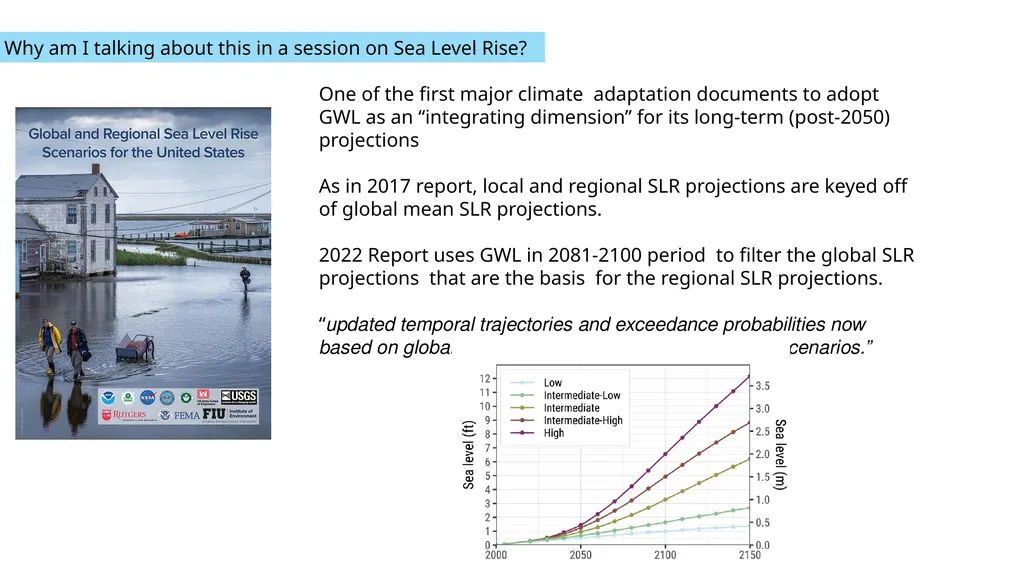
One of the first major climate adaptation documents to adopt GWL as an “integrating dimension” for its long-term (post-2050) projections
As in 2017 report, local and regional SLR projections are keyed off of global mean SLR projections.
2022 Report uses GWL in 2081-2100 period to filter the global SLR projections that are the basis for the regional SLR projections.
“updated temporal trajectories and exceedance probabilities now based on global warming levels rather than emissions scenarios.” Why am I talking about this in a session on Sea Level Rise?<br>
08
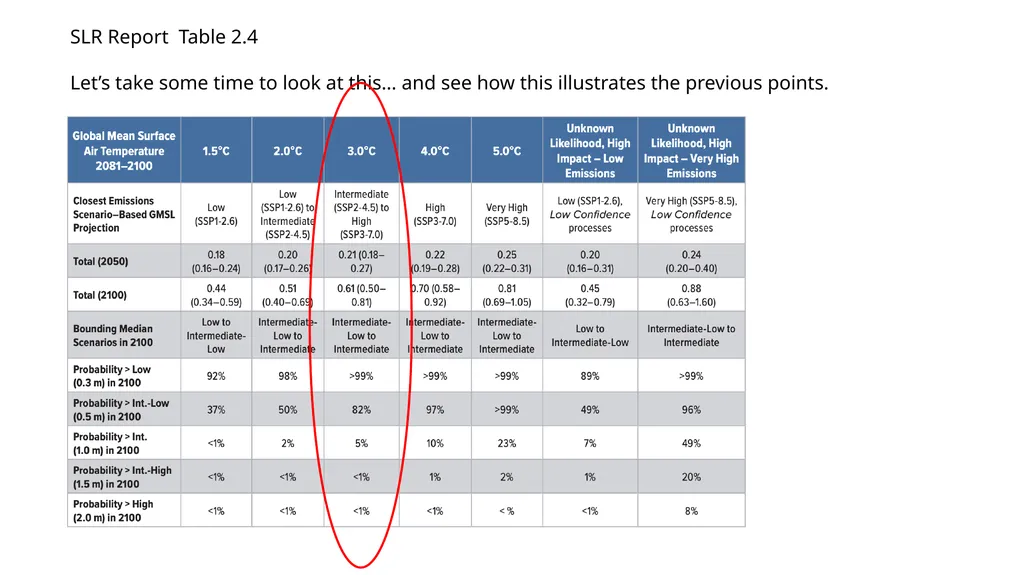
SLR Report Table 2.4
Let’s take some time to look at this… and see how this illustrates the previous points.<br>
09
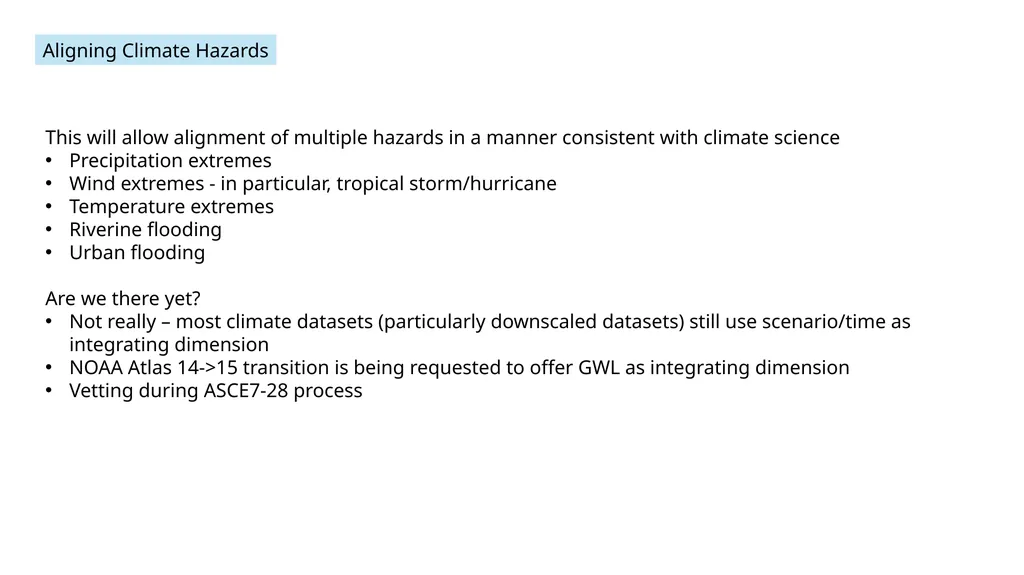
Aligning Climate Hazards This will allow alignment of multiple hazards in a manner consistent with climate science
Precipitation extremes
Wind extremes - in particular, tropical storm/hurricane
Temperature extremes
Riverine flooding
Urban flooding
Are we there yet?
Not really – most climate datasets (particularly downscaled datasets) still use scenario/time as integrating dimension
NOAA Atlas 14->15 transition is being requested to offer GWL as integrating dimension
Vetting during ASCE7-28 process<br>
10
Questions What benefits do YOU see in using GWL approach to describe future “design climates” compared to the traditional Emissions Scenario (RCP/SSP) approach?
What drawbacks?
What impediments to using this approach?
If this approach were adopted in ASCE standards– what considerations would you like to see?<br>
11
Further Reading 2022 Interagency Sea Level Rise Technical Report
Sweet, W.V., B.D. Hamlington, R.E. Kopp, C.P. Weaver, P.L. Barnard, and co-Authors, 2022: Global and Regional Sea Level Rise Scenarios for the United States: Updated Mean Projections and Extreme Water Level Probabilities Along U.S. Coastlines. NOAA Technical Report NOS 01. National Oceanic and Atmospheric Administration, National Ocean Service, Silver Spring, MD, 111 pp.
IPCC AR6 Technical Summary – section
Arias, P.A., N. Bellouin, E. Coppola, R.G. Jones, G. Krinner, and co-Authors, 2021: Technical Summary. In Climate Change 2021: The Physical Science Basis. Contribution of Working Group I to the Sixth Assessment Report of the Intergovernmental Panel on Climate Change [Masson-Delmotte, V., P. Zhai, A. Pirani, S.L. Connors, and co-Editors (eds.)]. Cambridge University Press, Cambridge, United Kingdom and New York, NY, USA, pp. 33−144. doi: 10.1017/9781009157896.002.
ASCE-NOAA Workshop Report:
More on Carbon Budget Approach:
Matthews, H. D. et al. Opportunities and challenges in using carbon budgets as a guide for climate policy. Nat. Geosci. 13, 769–779 (2020).<br>
12
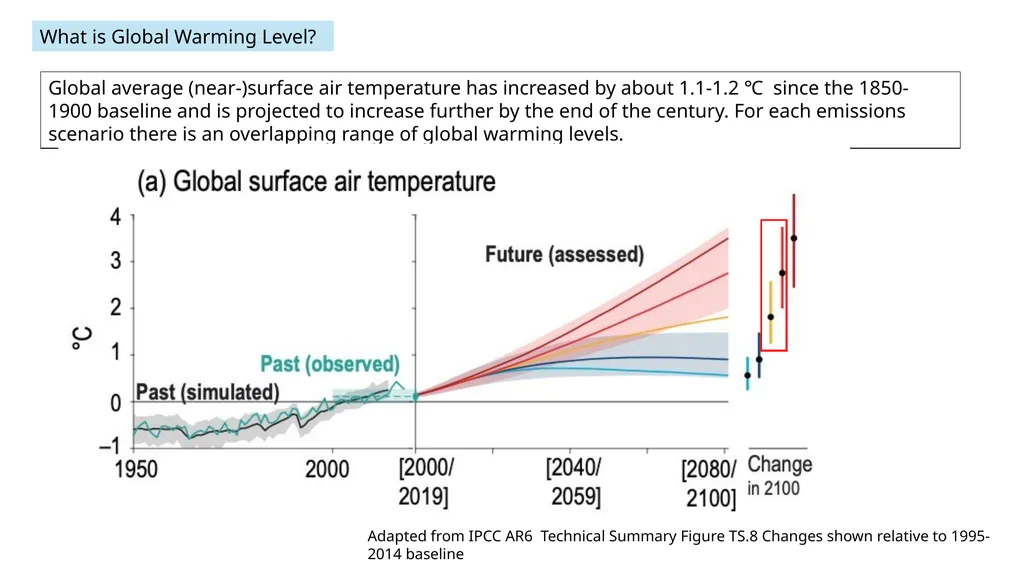
Adapted from IPCC AR6 Technical Summary Figure TS.8 Changes shown relative to 1995-2014 baseline Global average (near-)surface air temperature has increased by about 1.1-1.2 ℃ since the 1850-1900 baseline and is projected to increase further by the end of the century. For each emissions scenario there is an overlapping range of global warming levels. What is GWL? What is Global Warming Level?<br>