
Some Observations from the War in Ukraine The




Description: Some Observations from the War in Ukraine The Dupuy Institute 8215 Wolftrap Road Tysons Corner, VA 22003 (703) 289-0007 www.dupuyinstitute.org Christopher A. Lawrence 2 December 2022 Outline: Some Observations from the War in Ukraine 1.
Related Topics
Download Presentation
"Some Observations from the War in Ukraine The" is the property of its rightful owner. Permission is granted to download and print the materials on this website for personal, non-commercial use only, and to display it on your personal computer provided you do not modify the materials and that you retain all copyright notices contained in the materials. By downloading content from our website, you accept the terms of this agreement.
Presentation Transcript
slide1. Some Observations from the
War in Ukraine The Dupuy Institute
8215 Wolftrap Road
Tysons Corner, VA 22003
(703) 289-0007
www.dupuyinstitute.org
Christopher A. Lawrence
2 December 2022<br>
slide2. Outline: Some Observations from the War in Ukraine 1. Losses
2. Wounded-to-killed ratios
3. Combat Effectiveness
4. Urban Warfare
5. U.S. Intelligence Advantage
6. Duration of War<br>
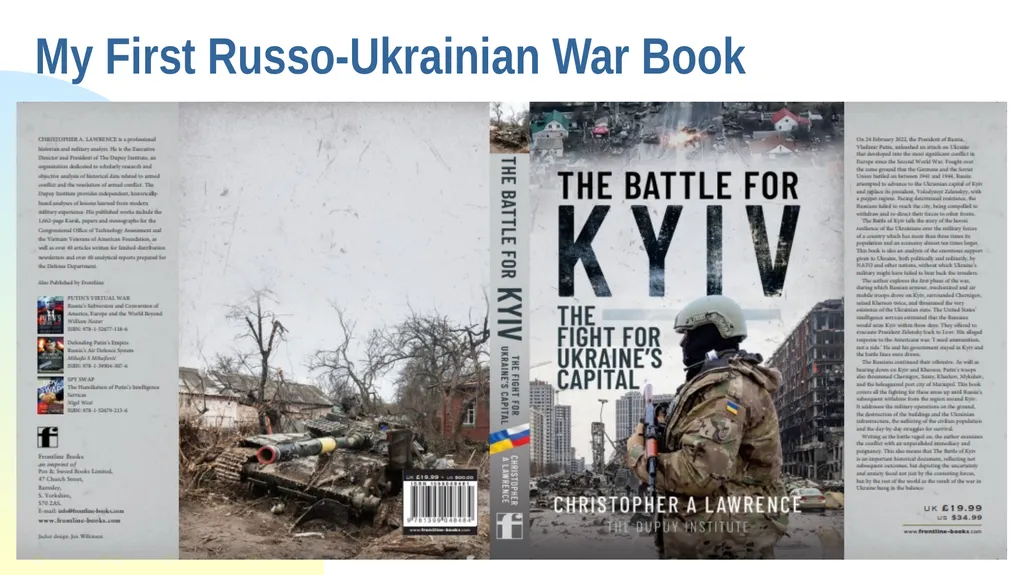
slide3. My First Russo-Ukrainian War Book<br>
slide4. My Russo-Ukrainian War Books I am currently working on a book called “The Battle of Kyiv: The Fight for Ukraine’s Capital”
Primarily based on open sources, no special inside knowledge.
But we do have 100+ blog posts on the subject on our blog Mystics & Statistics
Completion December maybe
Better to do now, or wait?
Part of a series of four books
The Battle for Kyiv (February - March)
The Battle for Mariupol (February – May)
The Battle for the Donbas (April – July)
The Ukrainian Counteroffensives (August – November)
Whatever comes next
Each book is around 70,000 words
These are small books
But they do hopefully add up to one real book<br>
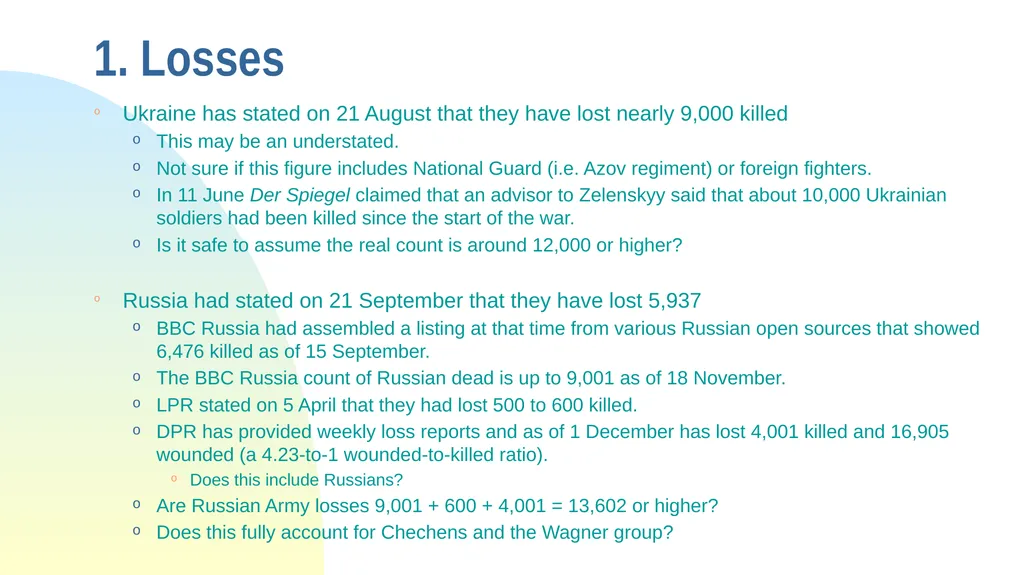
slide5. 1. Losses Ukraine has stated on 21 August that they have lost nearly 9,000 killed
This may be an understated.
Not sure if this figure includes National Guard (i.e. Azov regiment) or foreign fighters.
In 11 June Der Spiegel claimed that an advisor to Zelenskyy said that about 10,000 Ukrainian soldiers had been killed since the start of the war.
Is it safe to assume the real count is around 12,000 or higher?
Russia had stated on 21 September that they have lost 5,937
BBC Russia had assembled a listing at that time from various Russian open sources that showed 6,476 killed as of 15 September.
The BBC Russia count of Russian dead is up to 9,001 as of 18 November.
LPR stated on 5 April that they had lost 500 to 600 killed.
DPR has provided weekly loss reports and as of 1 December has lost 4,001 killed and 16,905 wounded (a 4.23-to-1 wounded-to-killed ratio).
Does this include Russians?
Are Russian Army losses 9,001 + 600 + 4,001 = 13,602 or higher?
Does this fully account for Chechens and the Wagner group?<br>
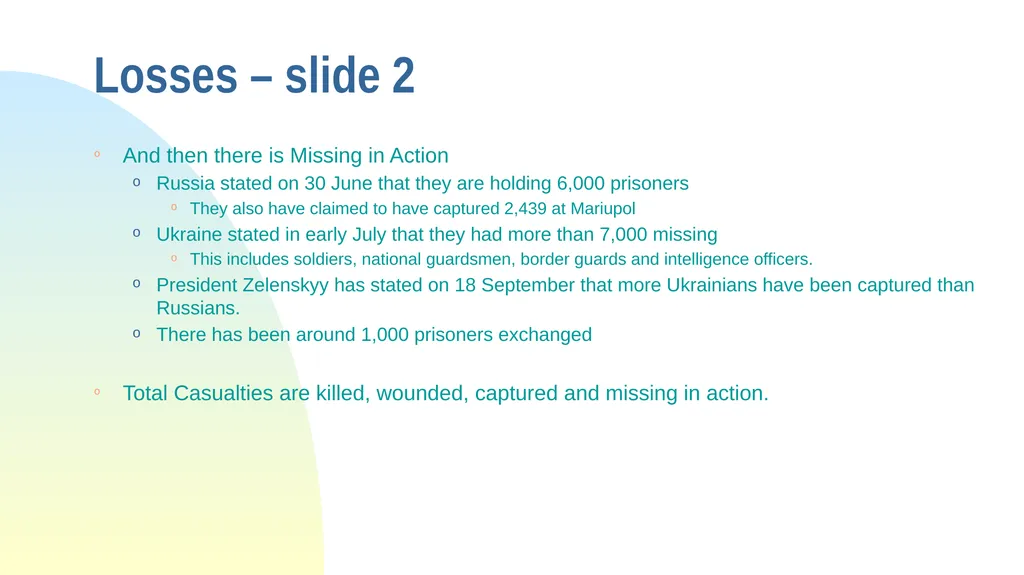
slide6. Losses – slide 2 And then there is Missing in Action
Russia stated on 30 June that they are holding 6,000 prisoners
They also have claimed to have captured 2,439 at Mariupol
Ukraine stated in early July that they had more than 7,000 missing
This includes soldiers, national guardsmen, border guards and intelligence officers.
President Zelenskyy has stated on 18 September that more Ukrainians have been captured than Russians.
There has been around 1,000 prisoners exchanged
Total Casualties are killed, wounded, captured and missing in action.<br>
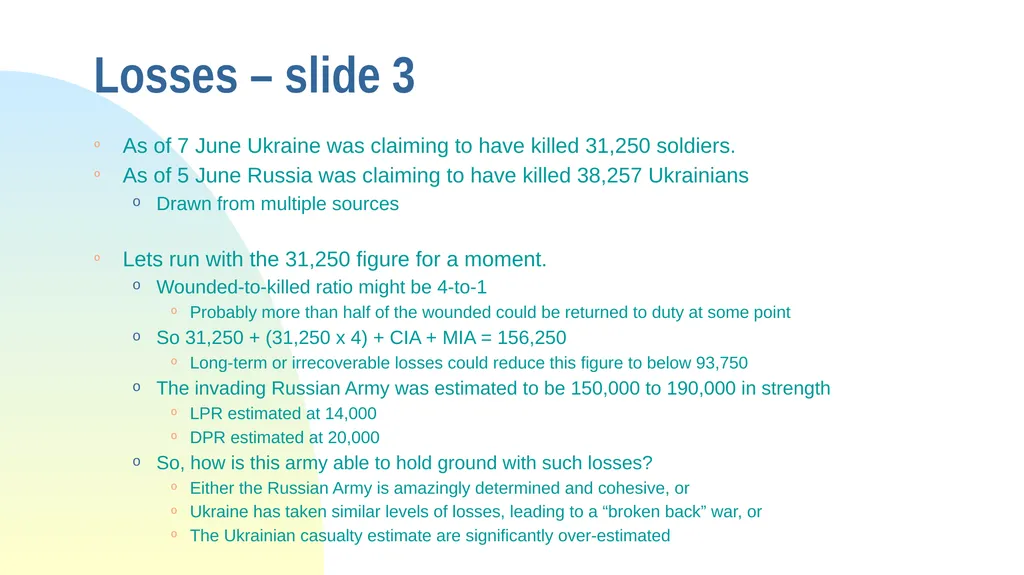
slide7. Losses – slide 3 As of 7 June Ukraine was claiming to have killed 31,250 soldiers.
As of 5 June Russia was claiming to have killed 38,257 Ukrainians
Drawn from multiple sources
Lets run with the 31,250 figure for a moment.
Wounded-to-killed ratio might be 4-to-1
Probably more than half of the wounded could be returned to duty at some point
So 31,250 + (31,250 x 4) + CIA + MIA = 156,250
Long-term or irrecoverable losses could reduce this figure to below 93,750
The invading Russian Army was estimated to be 150,000 to 190,000 in strength
LPR estimated at 14,000
DPR estimated at 20,000
So, how is this army able to hold ground with such losses?
Either the Russian Army is amazingly determined and cohesive, or
Ukraine has taken similar levels of losses, leading to a “broken back” war, or
The Ukrainian casualty estimate are significantly over-estimated<br>
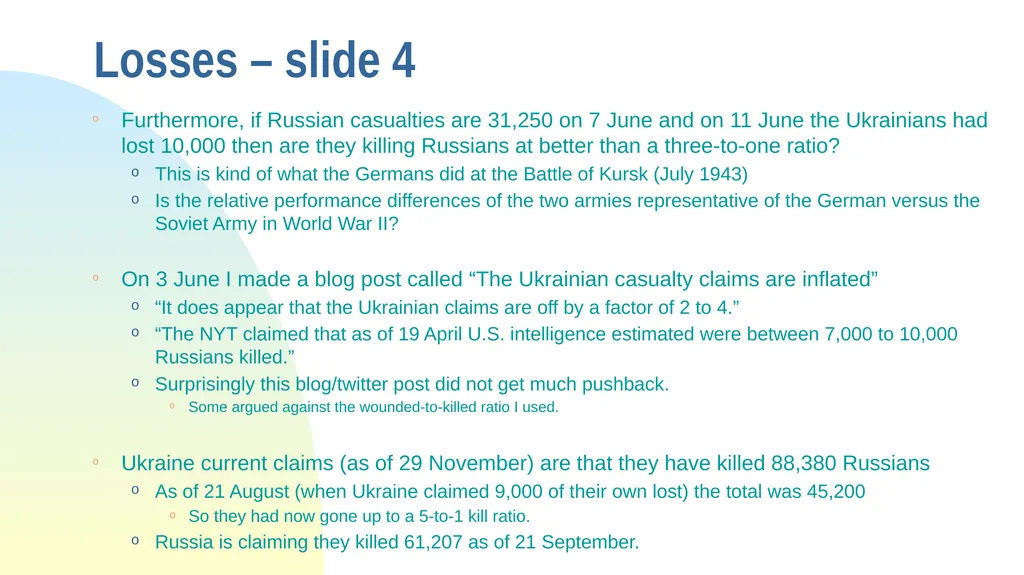
slide8. Losses – slide 4 Furthermore, if Russian casualties are 31,250 on 7 June and on 11 June the Ukrainians had lost 10,000 then are they killing Russians at better than a three-to-one ratio?
This is kind of what the Germans did at the Battle of Kursk (July 1943)
Is the relative performance differences of the two armies representative of the German versus the Soviet Army in World War II?
On 3 June I made a blog post called “The Ukrainian casualty claims are inflated”
“It does appear that the Ukrainian claims are off by a factor of 2 to 4.”
“The NYT claimed that as of 19 April U.S. intelligence estimated were between 7,000 to 10,000 Russians killed.”
Surprisingly this blog/twitter post did not get much pushback.
Some argued against the wounded-to-killed ratio I used.
Ukraine current claims (as of 29 November) are that they have killed 88,380 Russians
As of 21 August (when Ukraine claimed 9,000 of their own lost) the total was 45,200
So they had now gone up to a 5-to-1 kill ratio.
Russia is claiming they killed 61,207 as of 21 September.<br>
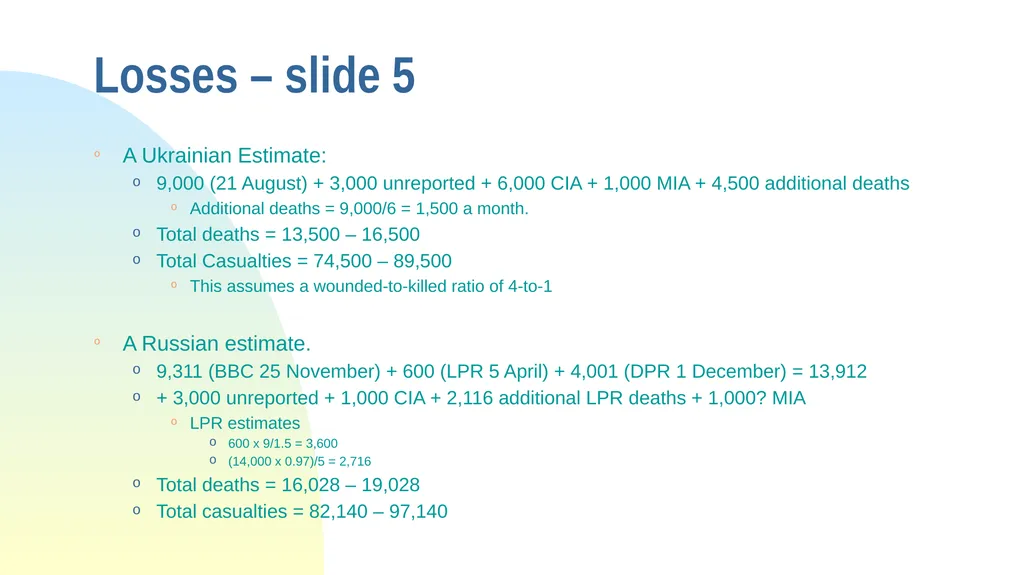
slide9. Losses – slide 5 A Ukrainian Estimate:
9,000 (21 August) + 3,000 unreported + 6,000 CIA + 1,000 MIA + 4,500 additional deaths
Additional deaths = 9,000/6 = 1,500 a month.
Total deaths = 13,500 – 16,500
Total Casualties = 74,500 – 89,500
This assumes a wounded-to-killed ratio of 4-to-1
A Russian estimate.
9,311 (BBC 25 November) + 600 (LPR 5 April) + 4,001 (DPR 1 December) = 13,912
+ 3,000 unreported + 1,000 CIA + 2,116 additional LPR deaths + 1,000? MIA
LPR estimates
600 x 9/1.5 = 3,600
(14,000 x 0.97)/5 = 2,716
Total deaths = 16,028 – 19,028
Total casualties = 82,140 – 97,140<br>
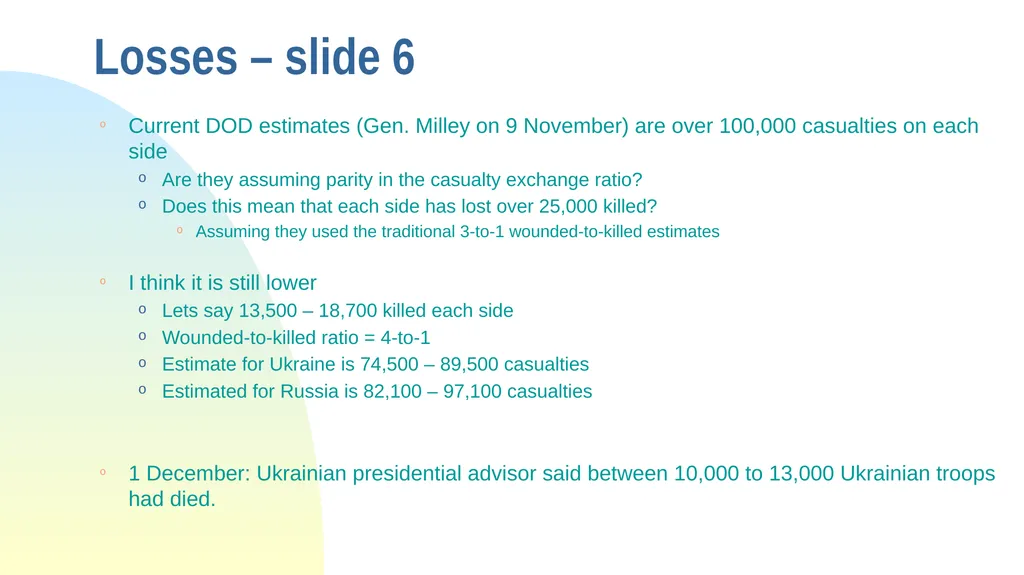
slide10. Losses – slide 6 Current DOD estimates (Gen. Milley on 9 November) are over 100,000 casualties on each side
Are they assuming parity in the casualty exchange ratio?
Does this mean that each side has lost over 25,000 killed?
Assuming they used the traditional 3-to-1 wounded-to-killed estimates
I think it is still lower
Lets say 13,500 – 18,700 killed each side
Wounded-to-killed ratio = 4-to-1
Estimate for Ukraine is 74,500 – 89,500 casualties
Estimated for Russia is 82,100 – 97,100 casualties
1 December: Ukrainian presidential advisor said between 10,000 to 13,000 Ukrainian troops had died.<br>
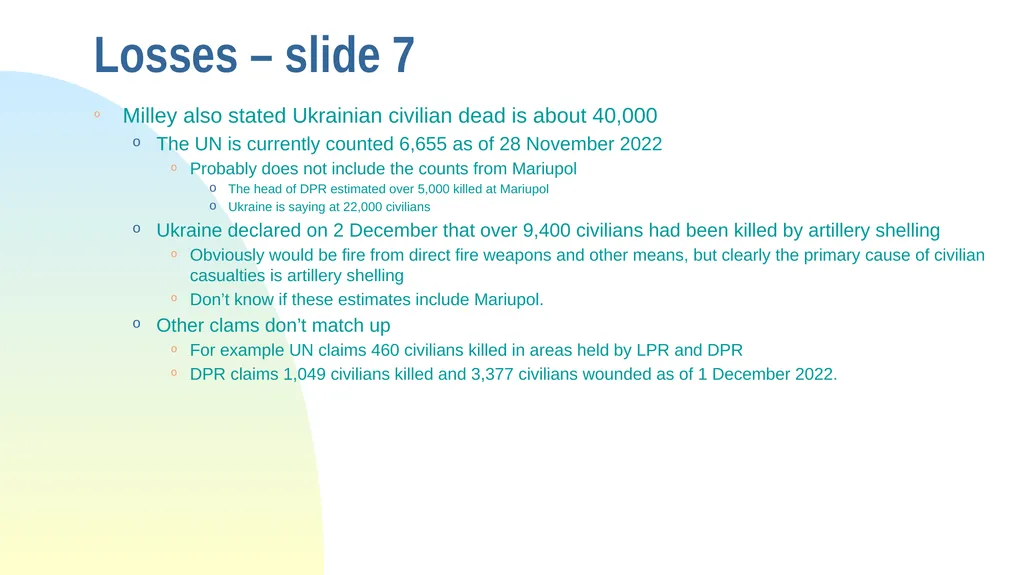
slide11. Losses – slide 7 Milley also stated Ukrainian civilian dead is about 40,000
The UN is currently counted 6,655 as of 28 November 2022
Probably does not include the counts from Mariupol
The head of DPR estimated over 5,000 killed at Mariupol
Ukraine is saying at 22,000 civilians
Ukraine declared on 2 December that over 9,400 civilians had been killed by artillery shelling
Obviously would be fire from direct fire weapons and other means, but clearly the primary cause of civilian casualties is artillery shelling
Don’t know if these estimates include Mariupol.
Other clams don’t match up
For example UN claims 460 civilians killed in areas held by LPR and DPR
DPR claims 1,049 civilians killed and 3,377 civilians wounded as of 1 December 2022.<br>
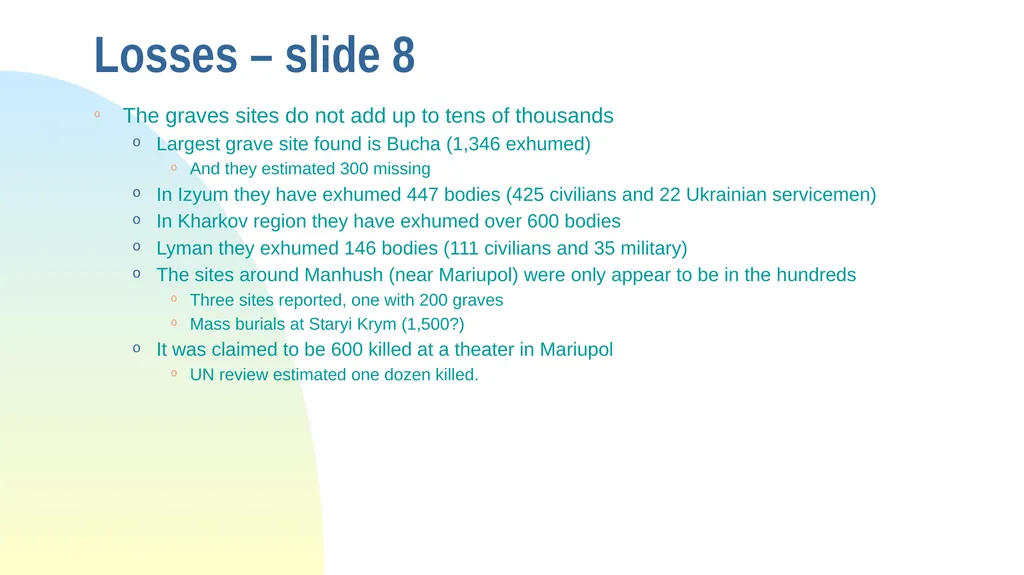
slide12. Losses – slide 8 The graves sites do not add up to tens of thousands
Largest grave site found is Bucha (1,346 exhumed)
And they estimated 300 missing
In Izyum they have exhumed 447 bodies (425 civilians and 22 Ukrainian servicemen)
In Kharkov region they have exhumed over 600 bodies
Lyman they exhumed 146 bodies (111 civilians and 35 military)
The sites around Manhush (near Mariupol) were only appear to be in the hundreds
Three sites reported, one with 200 graves
Mass burials at Staryi Krym (1,500?)
It was claimed to be 600 killed at a theater in Mariupol
UN review estimated one dozen killed.<br>
slide13. 2. Wounded-to-Killed Ratios This leads up to the question as to what are the wounded-to-killed ratios for this war
Theoretically the Ukrainians and Russians know, but they have not published their data.
DPR says 4.23-to-1 and they have been consistently publishing weekly since the war started.
For some reason, many people want to used the figure of 3-to-1
And some people arguing against me said it was lower than that (because?)
See my book War by Numbers, Chapter 15 (Casualties)<br>
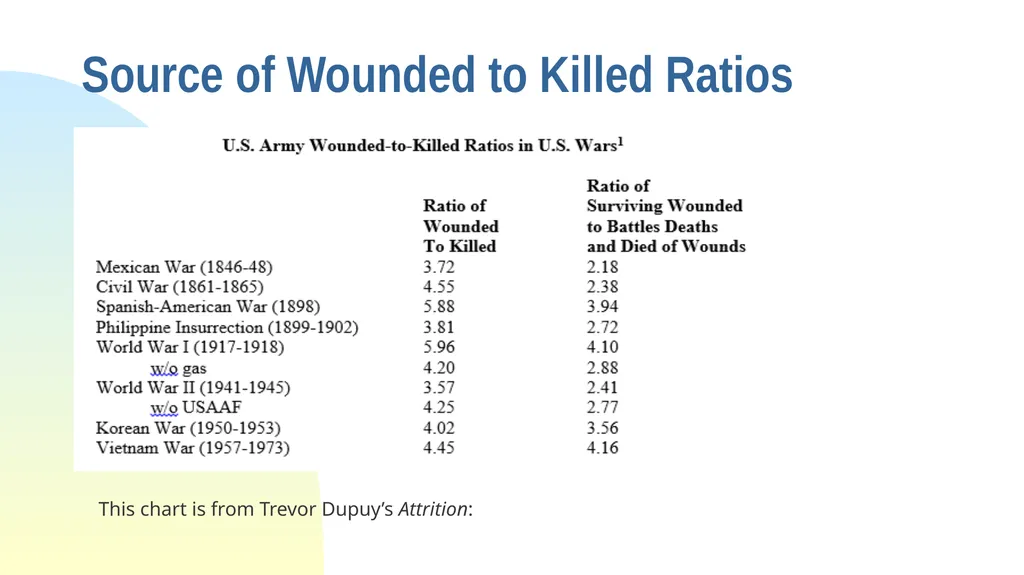
slide14. Source of Wounded to Killed Ratios This chart is from Trevor Dupuy’s Attrition:<br>
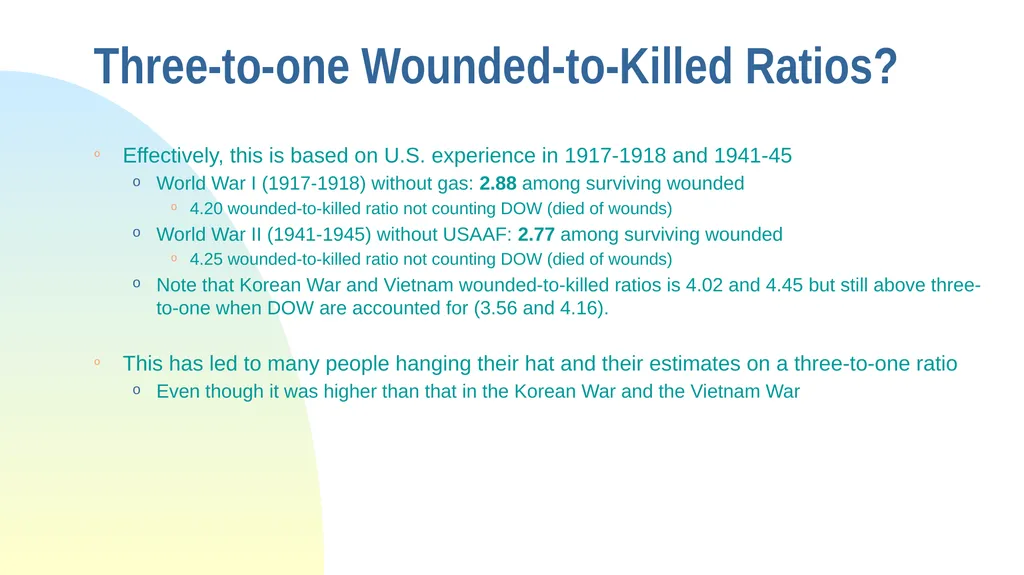
slide15. Three-to-one Wounded-to-Killed Ratios? Effectively, this is based on U.S. experience in 1917-1918 and 1941-45
World War I (1917-1918) without gas: 2.88 among surviving wounded
4.20 wounded-to-killed ratio not counting DOW (died of wounds)
World War II (1941-1945) without USAAF: 2.77 among surviving wounded
4.25 wounded-to-killed ratio not counting DOW (died of wounds)
Note that Korean War and Vietnam wounded-to-killed ratios is 4.02 and 4.45 but still above three-to-one when DOW are accounted for (3.56 and 4.16).
This has led to many people hanging their hat and their estimates on a three-to-one ratio
Even though it was higher than that in the Korean War and the Vietnam War<br>
slide16. Three-to-one Wounded-to-Killed Ratios? - slide 2 Three things have happened since World War II that influences wounded-to-killed ratios
Use of body armor (starting USMC in Vietnam)
The impact of this is discussed in depth in the TDI study “”Combat Mortality: Why is Marine Combat Morality Less than That of the Army? (March 1998)”
The development of motorization and helicopters, leading to faster evacuation
This does increase the DOW percentages.
Improved medical care
With these three factors in play, it is pretty hard to believe that wounded-to-killed ratios remain three-to-one some 75+ years after WWII.<br>
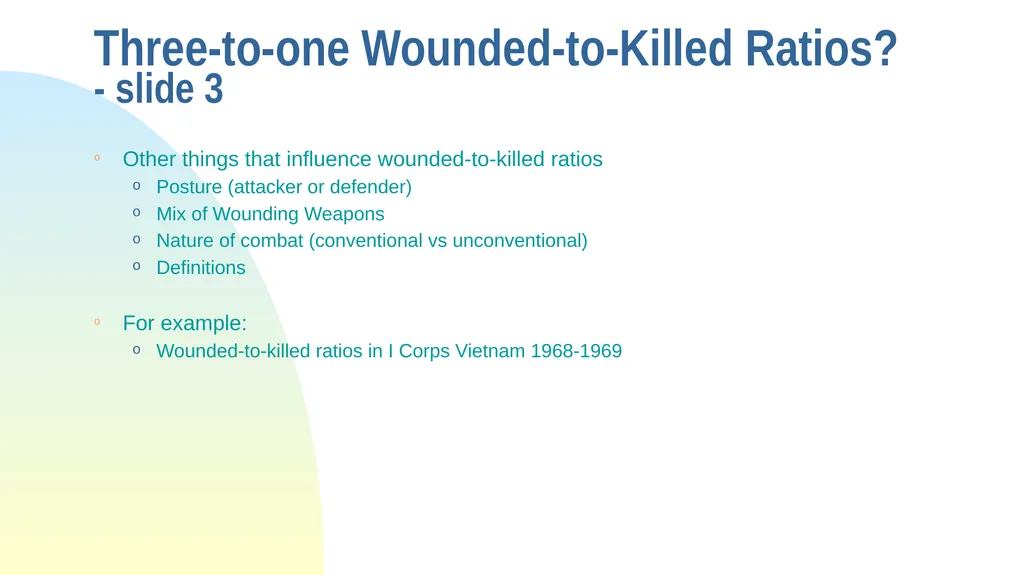
slide17. Three-to-one Wounded-to-Killed Ratios? - slide 3 Other things that influence wounded-to-killed ratios
Posture (attacker or defender)
Mix of Wounding Weapons
Nature of combat (conventional vs unconventional)
Definitions
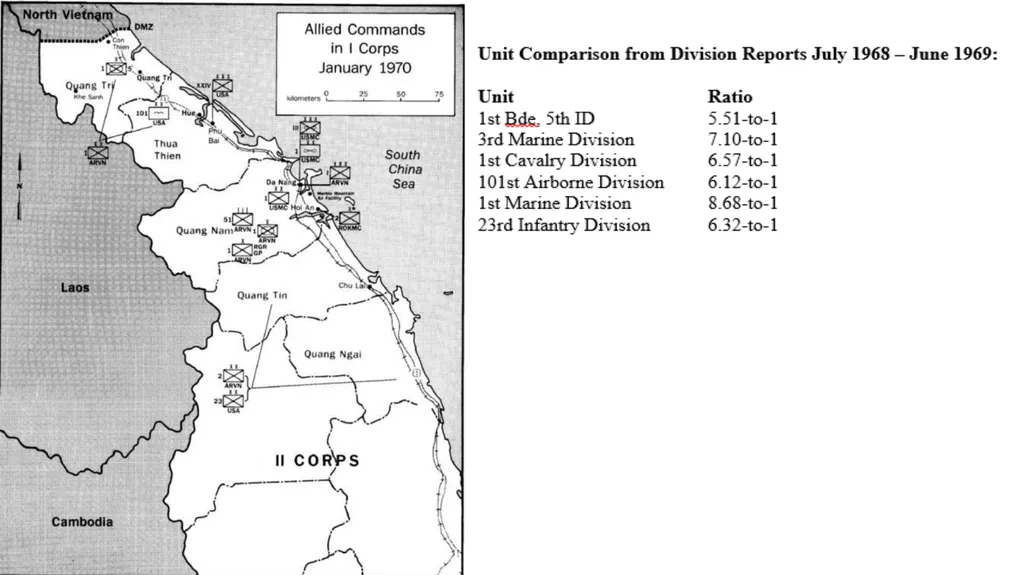
For example:
Wounded-to-killed ratios in I Corps Vietnam 1968-1969<br>
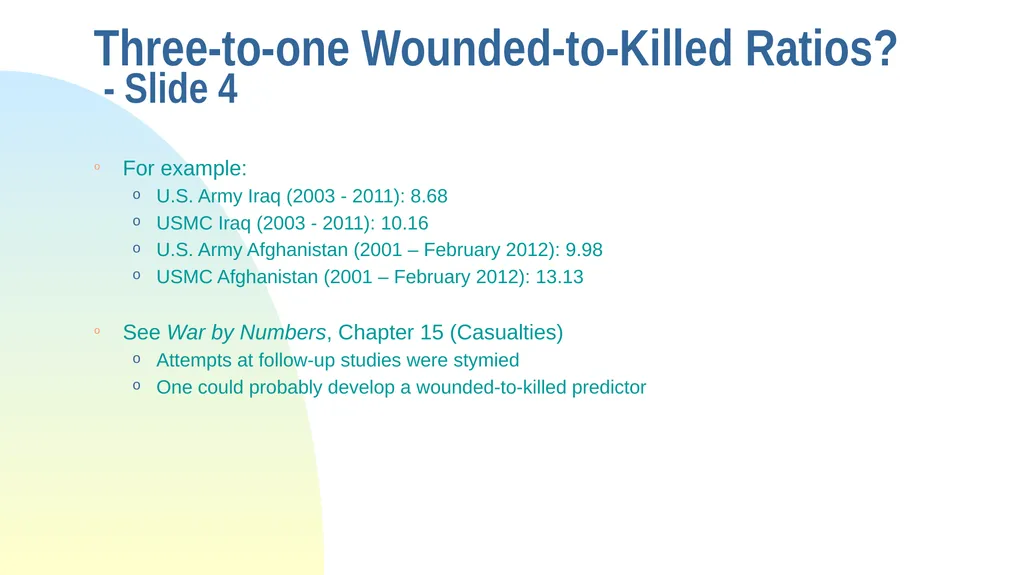
slide19. Three-to-one Wounded-to-Killed Ratios? - Slide 4 For example:
U.S. Army Iraq (2003 - 2011): 8.68
USMC Iraq (2003 - 2011): 10.16
U.S. Army Afghanistan (2001 – February 2012): 9.98
USMC Afghanistan (2001 – February 2012): 13.13
See War by Numbers, Chapter 15 (Casualties)
Attempts at follow-up studies were stymied
One could probably develop a wounded-to-killed predictor<br>
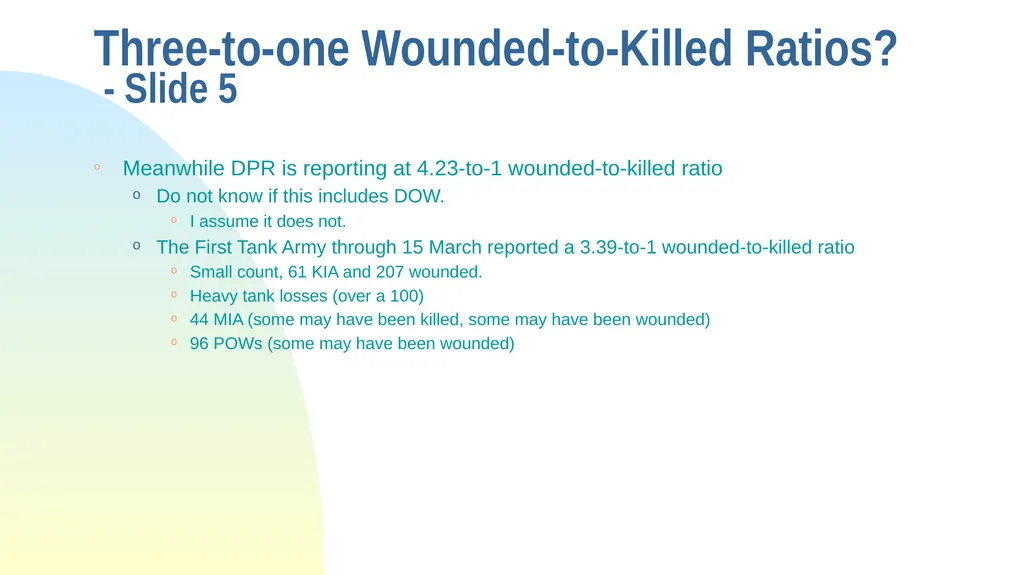
slide20. Three-to-one Wounded-to-Killed Ratios? - Slide 5 Meanwhile DPR is reporting at 4.23-to-1 wounded-to-killed ratio
Do not know if this includes DOW.
I assume it does not.
The First Tank Army through 15 March reported a 3.39-to-1 wounded-to-killed ratio
Small count, 61 KIA and 207 wounded.
Heavy tank losses (over a 100)
44 MIA (some may have been killed, some may have been wounded)
96 POWs (some may have been wounded)<br>
slide21. Tank Losses, Casualty Estimation and Wounded-to-Killed Ratios? Oryx, which is at least an independent broker, estimates:
For Russia (as of 14 November 2022):
1,423 tanks lost (destroyed, abandoned or captured)
55 abandoned and 515 captured
696 AFVs lost
24 abandoned and 234 captured
1,685 IFVs lost
79 abandoned and 536 captured
261 APCs lost.
12 abandoned and 92 captured.
3,523 other (see next slide)
Total for Russia: 7,588
This is based upon photo and video confirmation.
Real losses may be higher<br>
slide22. Tank Losses, Casualty Estimation and Wounded-to-Killed Ratios? – slide 2 For Russia (as of 14 November 2022):
1932 Trucks, vehicles and Jeeps
40 MRAP
163 IMV
191 CPs
242 Engineer vehicles
29 SP AT
25 Hvy Mortars
79 Artillery Support
128 Towed Artillery
267 SP Artillery
149 MLRS
Total = 3,523 Not counted for the total
148 UAVs
8 Naval Ships
6 Logistics Trains Also counted for the total
15 AA
22 SP AA
78 SAM
21 Radars
18 Jammers
61 Aircraft
63 Helicopters<br>
slide23. Tank Losses, Casualty Estimation and Wounded-to-Killed Ratios? – slide 3 Orynx, which is at least an independent broker, estimates:
For Ukraine (as of 14 November 2022):
342 tanks lost
202 AFVs lost
348 IFVs lost
171 APCs lost
1,013 other
This is based upon photo and video confirmation.
Real losses may be higher
Are Ukrainian losses as fully counted?
Total = 2,076<br>
slide24. Tank Losses, Casualty Estimation and Wounded-to-Killed Ratios? – slide 4 For Russia (as of 14 November 2022):
385 Trucks, vehicles and Jeeps
17 MRAP
201 IMV
7 CPs
33 Engineer vehicles
20 SP AT
0 Hvy Mortars
18 Artillery Support
62 Towed Artillery
67 SP Artillery
31 MLRS
Total = 1,013 Not counted for the total
51 UAVs
20 Naval Ships
0 Logistics Trains Also counted for the total
4 AA
2 SP AA
61 SAM
28 Radars
1 Jammers
55 Aircraft
21 Helicopters<br>
slide25. Tank Losses, Casualty Estimation and Wounded-to-Killed Ratios? – slide 5 Attrition reports (pages 80-81) that:
0.98 crew casualties per tank or 20% of the total crew
Tank burned: 1.28 crew casualty per loss
Tank did not burn: 0.78
Source: U.S. First Army, June 1944- April 1945
Note that a casualty is killed or wounded
Wounded-to-killed ratio for tank losses
Data not assembled
Lots of people assume 1:1
This also needs to be subject further explored<br>
slide26. Tank Losses, Casualty Estimation and Wounded-to-Killed Ratios? – slide 6 First Tank Army report for 1900, 15 March 2022:
1st Tank Regiment, 2nd Tank Division
Lost 45 T-72 B3M tanks
6 killed, 9 wounded
14th Tank Regiment, 4th Tank Division
Lost 44 T-80s UE tanks
2 killed, 13 wounded
12th Tank Regiment, 4th Tank Division
Lost 18 T-80 U tanks
5 killed, 27 wounded
0.58 or less crew casualties per tank
Vice 0.98 crew casualties per tank or 20% of the total crew
Total tank losses; 107
Total casualties: 62
13 killed, 49 wounded
3.77 wounded-to-killed ratio<br>
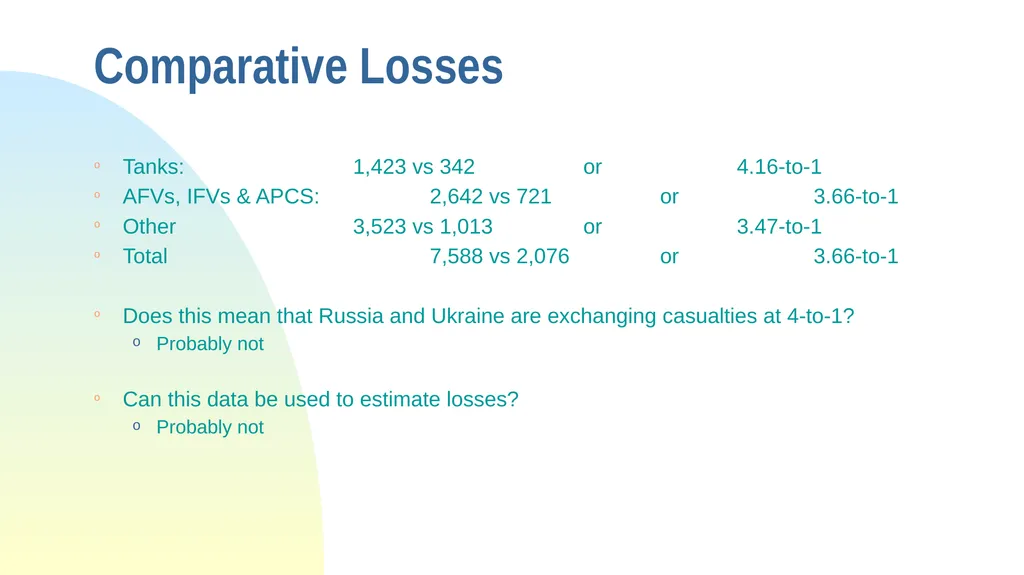
slide27. Comparative Losses Tanks: 1,423 vs 342 or 4.16-to-1
AFVs, IFVs & APCS: 2,642 vs 721 or 3.66-to-1
Other 3,523 vs 1,013 or 3.47-to-1
Total 7,588 vs 2,076 or 3.66-to-1
Does this mean that Russia and Ukraine are exchanging casualties at 4-to-1?
Probably not
Can this data be used to estimate losses?
Probably not<br>
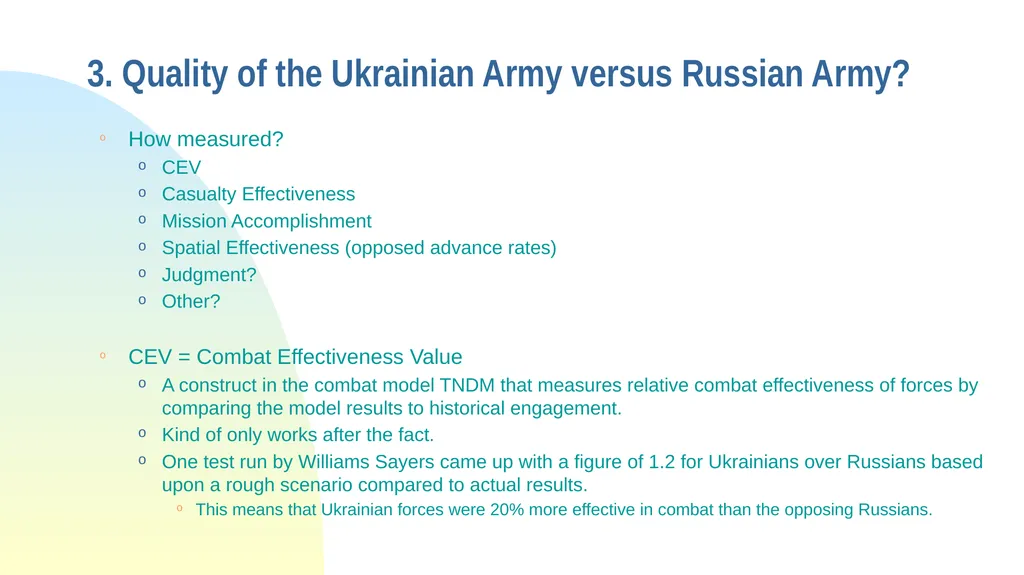
slide28. 3. Quality of the Ukrainian Army versus Russian Army? How measured?
CEV
Casualty Effectiveness
Mission Accomplishment
Spatial Effectiveness (opposed advance rates)
Judgment?
Other?
CEV = Combat Effectiveness Value
A construct in the combat model TNDM that measures relative combat effectiveness of forces by comparing the model results to historical engagement.
Kind of only works after the fact.
One test run by Williams Sayers came up with a figure of 1.2 for Ukrainians over Russians based upon a rough scenario compared to actual results.
This means that Ukrainian forces were 20% more effective in combat than the opposing Russians.<br>
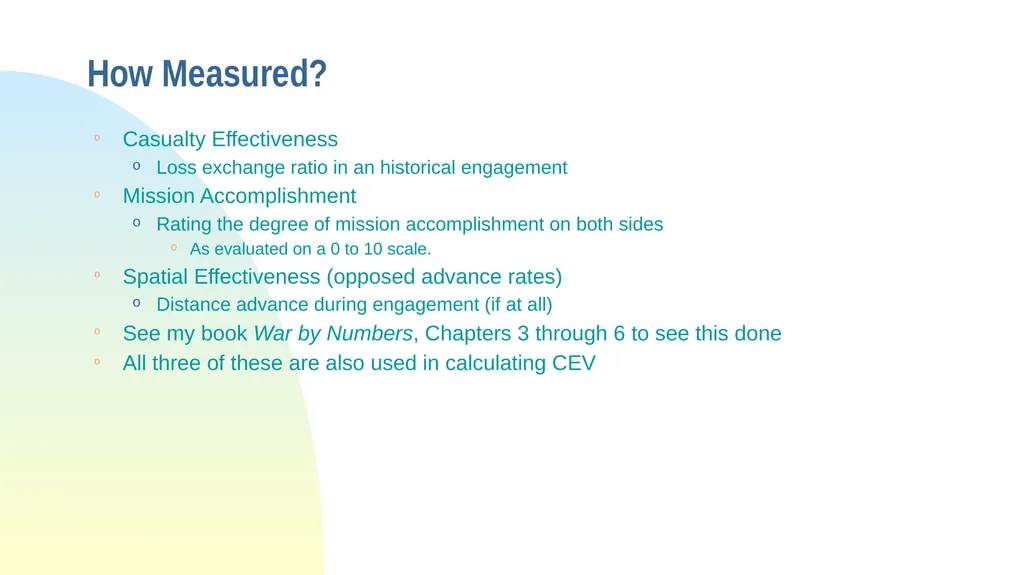
slide29. How Measured? Casualty Effectiveness
Loss exchange ratio in an historical engagement
Mission Accomplishment
Rating the degree of mission accomplishment on both sides
As evaluated on a 0 to 10 scale.
Spatial Effectiveness (opposed advance rates)
Distance advance during engagement (if at all)
See my book War by Numbers, Chapters 3 through 6 to see this done
All three of these are also used in calculating CEV<br>
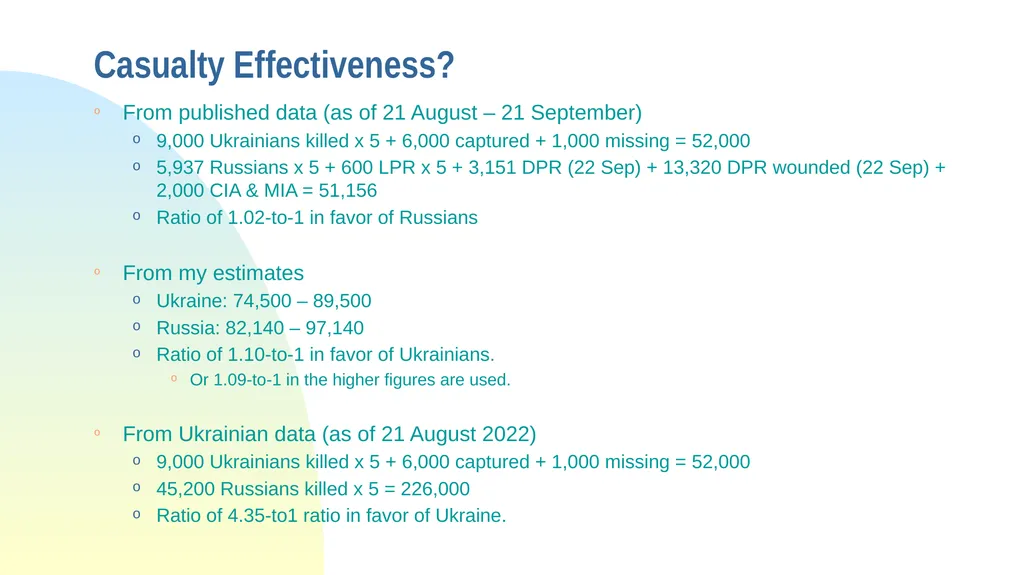
slide30. Casualty Effectiveness? From published data (as of 21 August – 21 September)
9,000 Ukrainians killed x 5 + 6,000 captured + 1,000 missing = 52,000
5,937 Russians x 5 + 600 LPR x 5 + 3,151 DPR (22 Sep) + 13,320 DPR wounded (22 Sep) + 2,000 CIA & MIA = 51,156
Ratio of 1.02-to-1 in favor of Russians
From my estimates
Ukraine: 74,500 – 89,500
Russia: 82,140 – 97,140
Ratio of 1.10-to-1 in favor of Ukrainians.
Or 1.09-to-1 in the higher figures are used.
From Ukrainian data (as of 21 August 2022)
9,000 Ukrainians killed x 5 + 6,000 captured + 1,000 missing = 52,000
45,200 Russians killed x 5 = 226,000
Ratio of 4.35-to1 ratio in favor of Ukraine.<br>
slide31. Casualty Effectiveness? - slide 2 Note that casualty effective does not equal combat effective, although they are probably related.
Trevor Dupuy postulated that casualty effectiveness was the square of combat effectiveness
i.e. a CEV of 1.2 = 1.44 advantage in casualty effectiveness
Or you can use:
Judgment?
Other?<br>
slide32. Some Judgments Up through 1991, the Ukrainian and Russian Armies came from a common core, the Soviet Army.
Ukrainian Army
From 1991 to 2010 the Ukrainian Army being westernized, but was still led by Soviet trained officers.
In 2010 Viktor Yanokovych was elected president and the Ukrainian Army shrunk to 60,000 men.
In 2014 – 2021 the army was rebuilt from 60,000 to 169,000.
Degree of Western Doctrine?
Training of officer corps?
Gathered experience in the fighting of 2014-2015.<br>
slide33. Some Judgments – slide 2 Russian Army
Has some experience
Chechnya
KFOR
Georgia (2008)
Syria
Ukraine (2014-2015)
Doctrine?
Conscripts
Contract Soldiers
And then there is the comparative performance of the fighting of the two armies in the 78-day August offensive near Kherson conducted by Ukraine.
Did the Ukrainian Army make any significant opposed advances there?
Who suffered the higher losses in that campaign?<br>
slide34. Tentative Conclusions The Ukrainian and Russian Armies are roughly similar in ability and capabilities
The Ukrainian have the advantage of higher motivation due to defending their homeland.
The relative capabilities of the armies can change over time depending on:
How the battles are going
How the war is going
The sources of recruitment
More training
More experience
Most likely the Ukrainian Army will only get better over time.
It is possible that the Russian Army will only get worse over time.
It is possible that if morale degrades enough, it could be more like the Russian Army of 1917.
Degrading morale may also force the Russians to compromises at the negotiation table.<br>
slide35. 4. Urban Warfare We did do three urban warfare studies back in 2002 – 2004
They don’t seem to get a lot of buzz
They did force RAND to revise their work
They are summarized in two chapters in War by Numbers
The fourth study (Stalingrad) was cancelled by Hurricane Katrina
General conclusions
Urban warfare slows down casualty rates
Urban warfare slows down advance rates
DNBI declines in an urban environment<br>
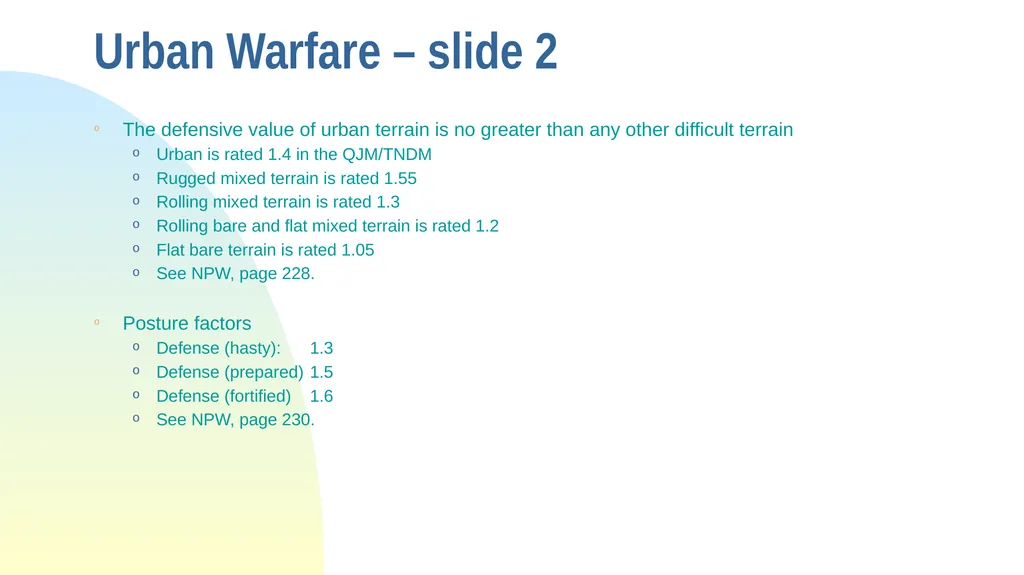
slide36. Urban Warfare – slide 2 The defensive value of urban terrain is no greater than any other difficult terrain
Urban is rated 1.4 in the QJM/TNDM
Rugged mixed terrain is rated 1.55
Rolling mixed terrain is rated 1.3
Rolling bare and flat mixed terrain is rated 1.2
Flat bare terrain is rated 1.05
See NPW, page 228.
Posture factors
Defense (hasty): 1.3
Defense (prepared) 1.5
Defense (fortified) 1.6
See NPW, page 230.<br>
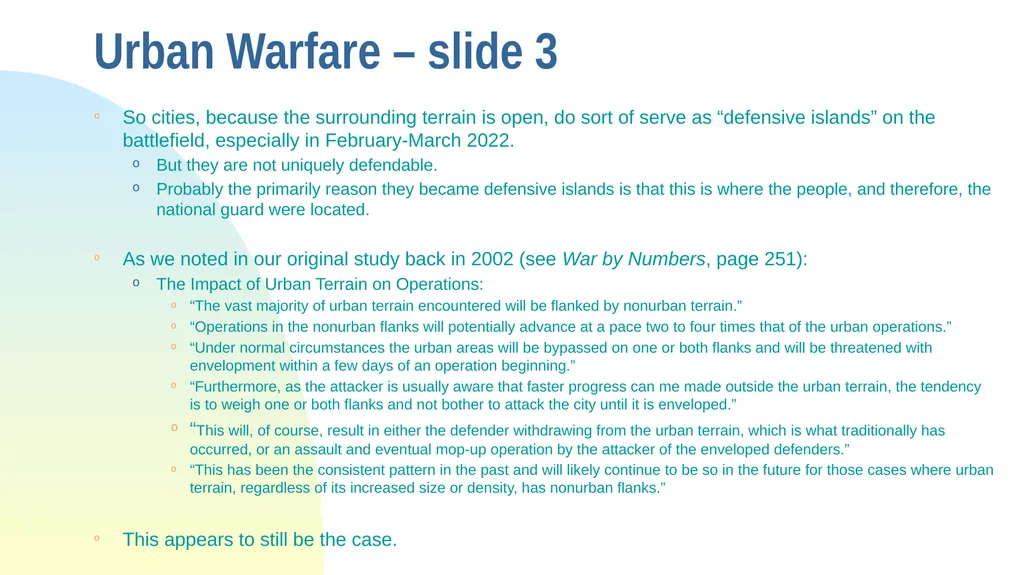
slide37. Urban Warfare – slide 3 So cities, because the surrounding terrain is open, do sort of serve as “defensive islands” on the battlefield, especially in February-March 2022.
But they are not uniquely defendable.
Probably the primarily reason they became defensive islands is that this is where the people, and therefore, the national guard were located.
As we noted in our original study back in 2002 (see War by Numbers, page 251):
The Impact of Urban Terrain on Operations:
“The vast majority of urban terrain encountered will be flanked by nonurban terrain.”
“Operations in the nonurban flanks will potentially advance at a pace two to four times that of the urban operations.”
“Under normal circumstances the urban areas will be bypassed on one or both flanks and will be threatened with envelopment within a few days of an operation beginning.”
“Furthermore, as the attacker is usually aware that faster progress can me made outside the urban terrain, the tendency is to weigh one or both flanks and not bother to attack the city until it is enveloped.”
“This will, of course, result in either the defender withdrawing from the urban terrain, which is what traditionally has occurred, or an assault and eventual mop-up operation by the attacker of the enveloped defenders.”
“This has been the consistent pattern in the past and will likely continue to be so in the future for those cases where urban terrain, regardless of its increased size or density, has nonurban flanks.”
This appears to still be the case.<br>
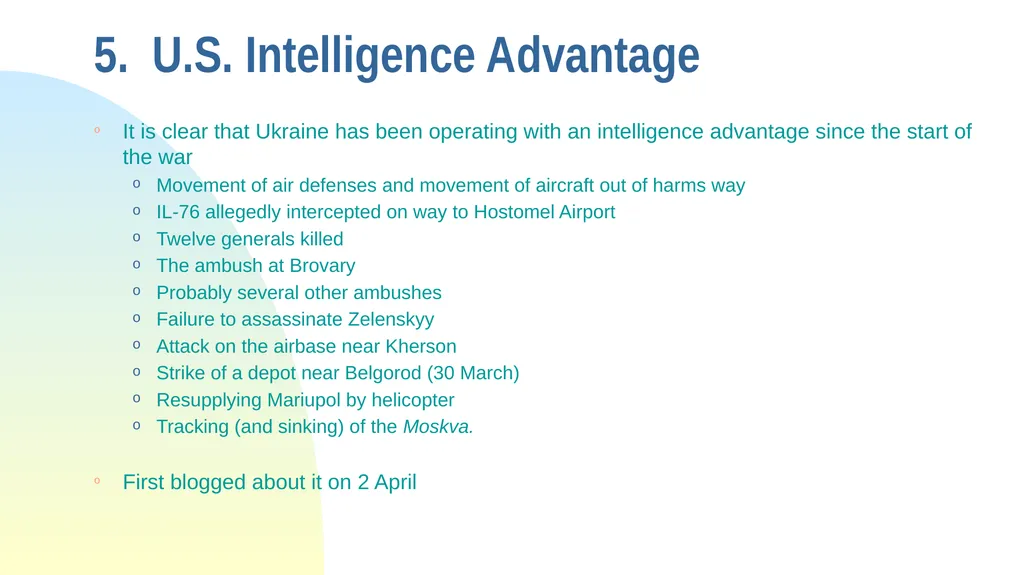
slide38. 5. U.S. Intelligence Advantage It is clear that Ukraine has been operating with an intelligence advantage since the start of the war
Movement of air defenses and movement of aircraft out of harms way
IL-76 allegedly intercepted on way to Hostomel Airport
Twelve generals killed
The ambush at Brovary
Probably several other ambushes
Failure to assassinate Zelenskyy
Attack on the airbase near Kherson
Strike of a depot near Belgorod (30 March)
Resupplying Mariupol by helicopter
Tracking (and sinking) of the Moskva.
First blogged about it on 2 April<br>
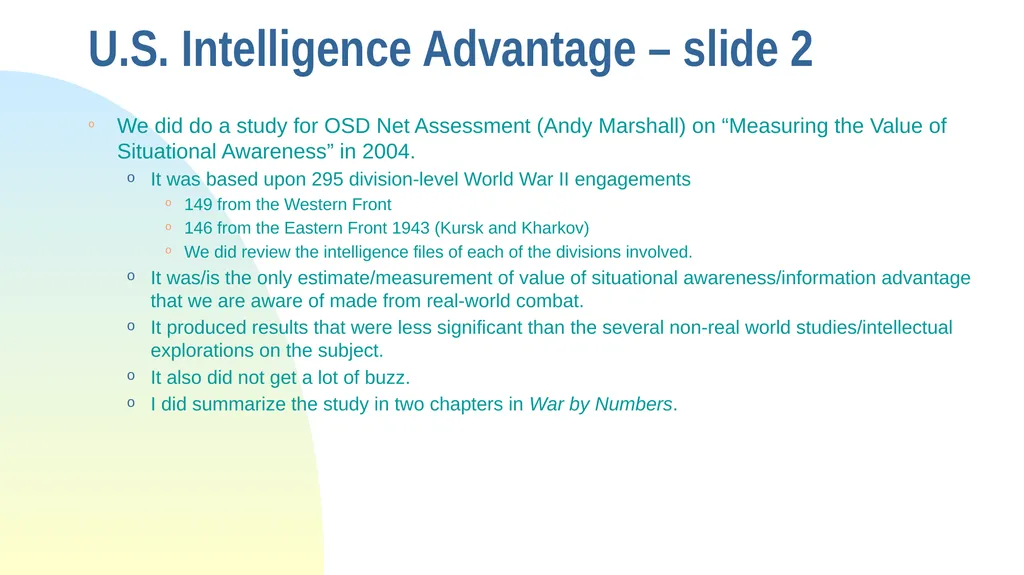
slide39. U.S. Intelligence Advantage – slide 2 We did do a study for OSD Net Assessment (Andy Marshall) on “Measuring the Value of Situational Awareness” in 2004.
It was based upon 295 division-level World War II engagements
149 from the Western Front
146 from the Eastern Front 1943 (Kursk and Kharkov)
We did review the intelligence files of each of the divisions involved.
It was/is the only estimate/measurement of value of situational awareness/information advantage that we are aware of made from real-world combat.
It produced results that were less significant than the several non-real world studies/intellectual explorations on the subject.
It also did not get a lot of buzz.
I did summarize the study in two chapters in War by Numbers.<br>
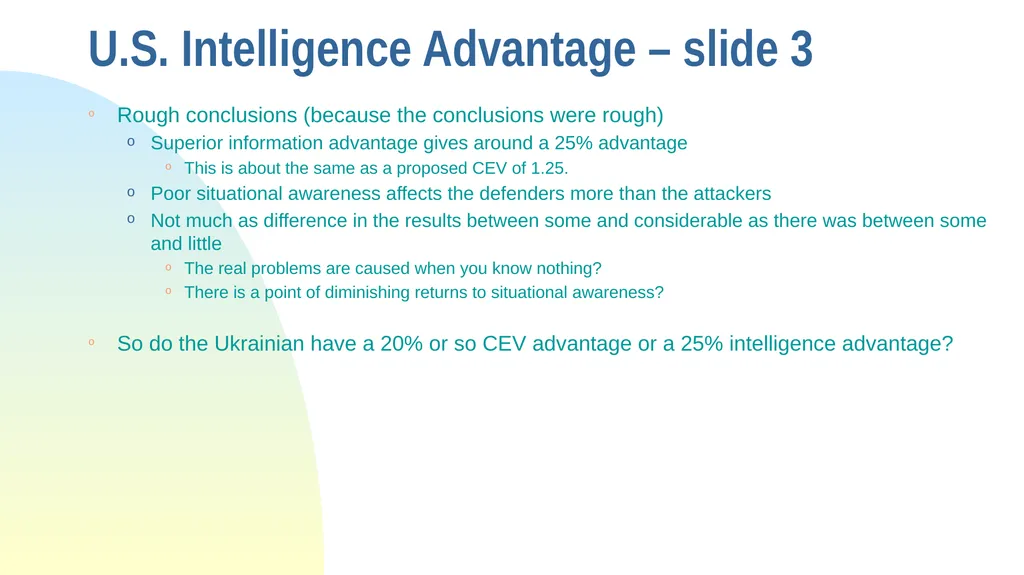
slide40. U.S. Intelligence Advantage – slide 3 Rough conclusions (because the conclusions were rough)
Superior information advantage gives around a 25% advantage
This is about the same as a proposed CEV of 1.25.
Poor situational awareness affects the defenders more than the attackers
Not much as difference in the results between some and considerable as there was between some and little
The real problems are caused when you know nothing?
There is a point of diminishing returns to situational awareness?
So do the Ukrainian have a 20% or so CEV advantage or a 25% intelligence advantage?<br>
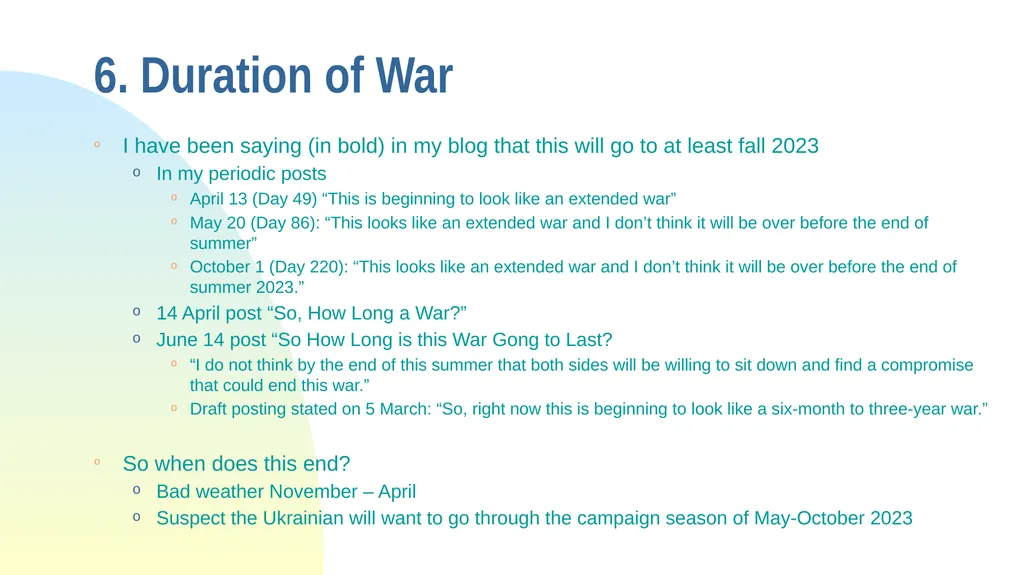
slide41. 6. Duration of War I have been saying (in bold) in my blog that this will go to at least fall 2023
In my periodic posts
April 13 (Day 49) “This is beginning to look like an extended war”
May 20 (Day 86): “This looks like an extended war and I don’t think it will be over before the end of summer”
October 1 (Day 220): “This looks like an extended war and I don’t think it will be over before the end of summer 2023.”
14 April post “So, How Long a War?”
June 14 post “So How Long is this War Gong to Last?
“I do not think by the end of this summer that both sides will be willing to sit down and find a compromise that could end this war.”
Draft posting stated on 5 March: “So, right now this is beginning to look like a six-month to three-year war.”
So when does this end?
Bad weather November – April
Suspect the Ukrainian will want to go through the campaign season of May-October 2023<br>
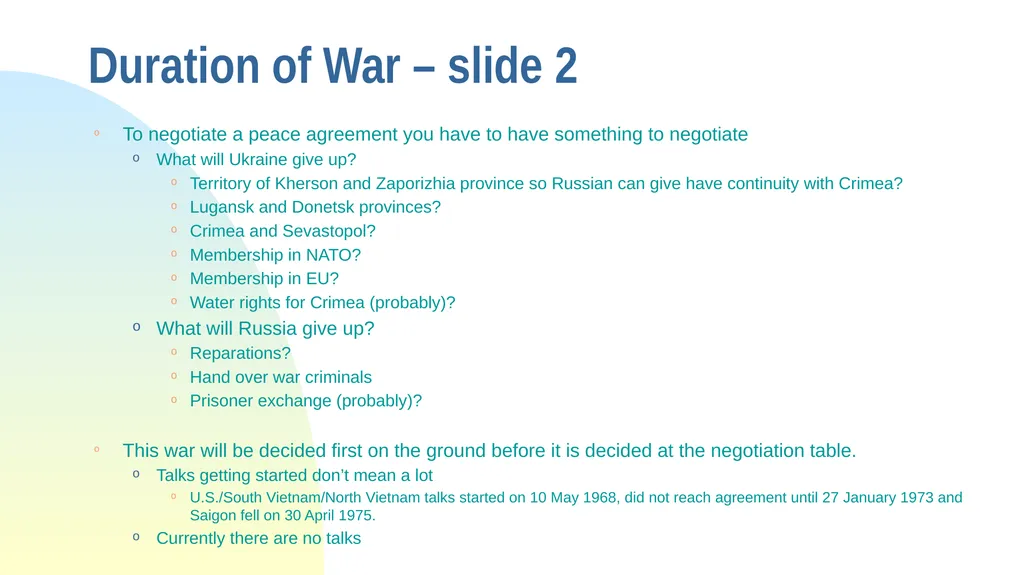
slide42. Duration of War – slide 2 To negotiate a peace agreement you have to have something to negotiate
What will Ukraine give up?
Territory of Kherson and Zaporizhia province so Russian can give have continuity with Crimea?
Lugansk and Donetsk provinces?
Crimea and Sevastopol?
Membership in NATO?
Membership in EU?
Water rights for Crimea (probably)?
What will Russia give up?
Reparations?
Hand over war criminals
Prisoner exchange (probably)?
This war will be decided first on the ground before it is decided at the negotiation table.
Talks getting started don’t mean a lot
U.S./South Vietnam/North Vietnam talks started on 10 May 1968, did not reach agreement until 27 January 1973 and Saigon fell on 30 April 1975.
Currently there are no talks<br>
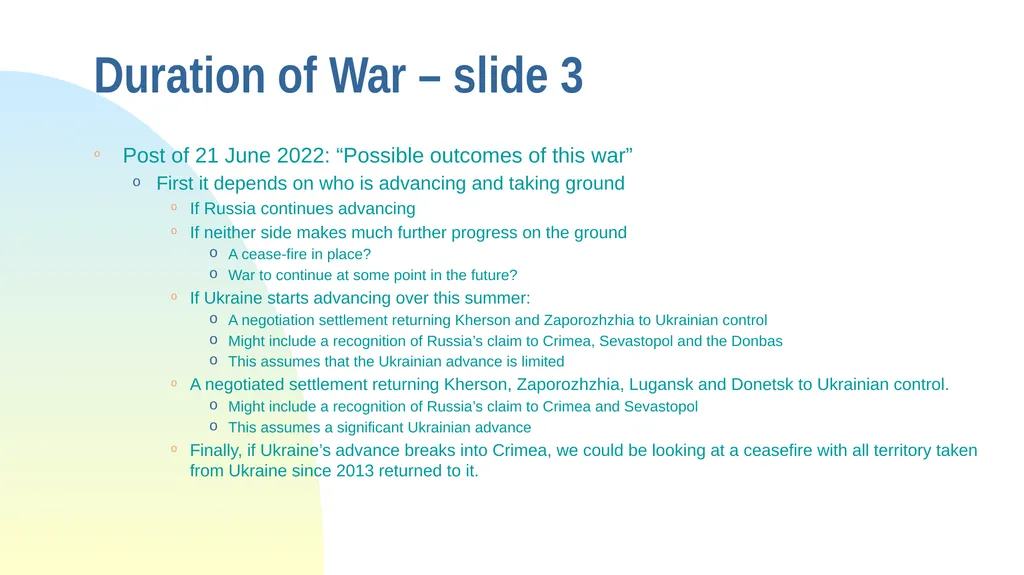
slide43. Duration of War – slide 3 Post of 21 June 2022: “Possible outcomes of this war”
First it depends on who is advancing and taking ground
If Russia continues advancing
If neither side makes much further progress on the ground
A cease-fire in place?
War to continue at some point in the future?
If Ukraine starts advancing over this summer:
A negotiation settlement returning Kherson and Zaporozhzhia to Ukrainian control
Might include a recognition of Russia’s claim to Crimea, Sevastopol and the Donbas
This assumes that the Ukrainian advance is limited
A negotiated settlement returning Kherson, Zaporozhzhia, Lugansk and Donetsk to Ukrainian control.
Might include a recognition of Russia’s claim to Crimea and Sevastopol
This assumes a significant Ukrainian advance
Finally, if Ukraine’s advance breaks into Crimea, we could be looking at a ceasefire with all territory taken from Ukraine since 2013 returned to it.<br>
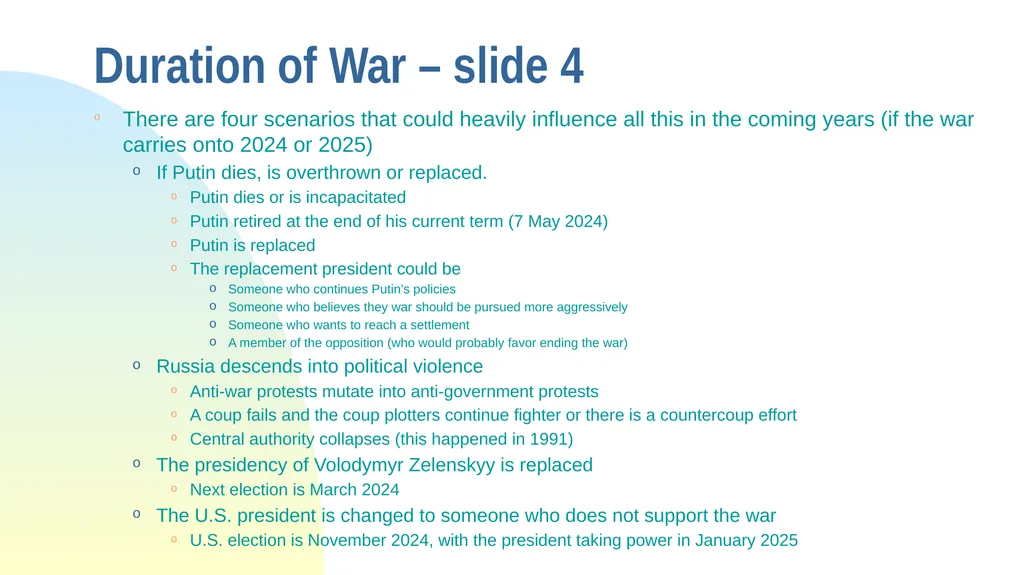
slide44. Duration of War – slide 4 There are four scenarios that could heavily influence all this in the coming years (if the war carries onto 2024 or 2025)
If Putin dies, is overthrown or replaced.
Putin dies or is incapacitated
Putin retired at the end of his current term (7 May 2024)
Putin is replaced
The replacement president could be
Someone who continues Putin’s policies
Someone who believes they war should be pursued more aggressively
Someone who wants to reach a settlement
A member of the opposition (who would probably favor ending the war)
Russia descends into political violence
Anti-war protests mutate into anti-government protests
A coup fails and the coup plotters continue fighter or there is a countercoup effort
Central authority collapses (this happened in 1991)
The presidency of Volodymyr Zelenskyy is replaced
Next election is March 2024
The U.S. president is changed to someone who does not support the war
U.S. election is November 2024, with the president taking power in January 2025<br>
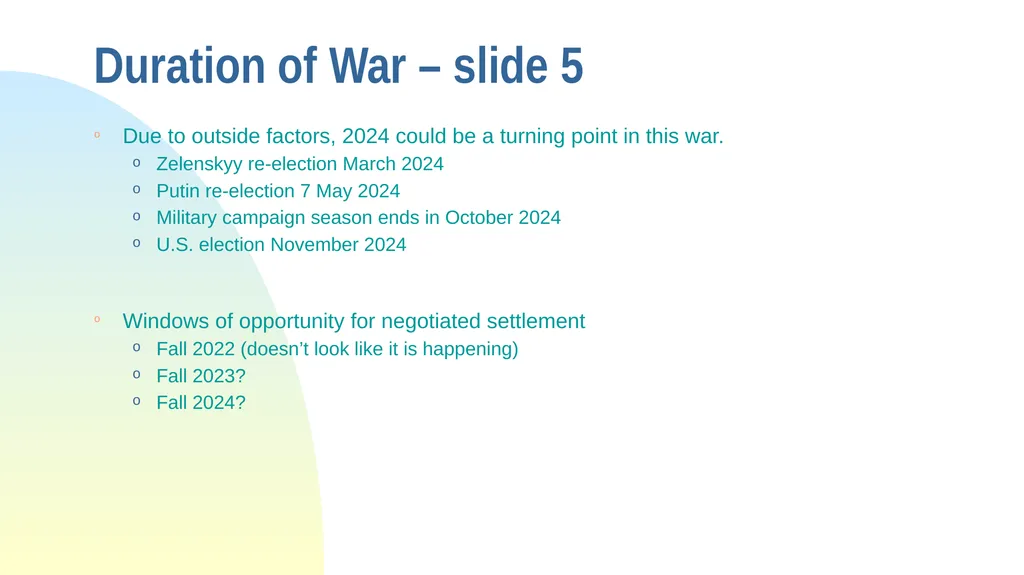
slide45. Duration of War – slide 5 Due to outside factors, 2024 could be a turning point in this war.
Zelenskyy re-election March 2024
Putin re-election 7 May 2024
Military campaign season ends in October 2024
U.S. election November 2024
Windows of opportunity for negotiated settlement
Fall 2022 (doesn’t look like it is happening)
Fall 2023?
Fall 2024?<br>
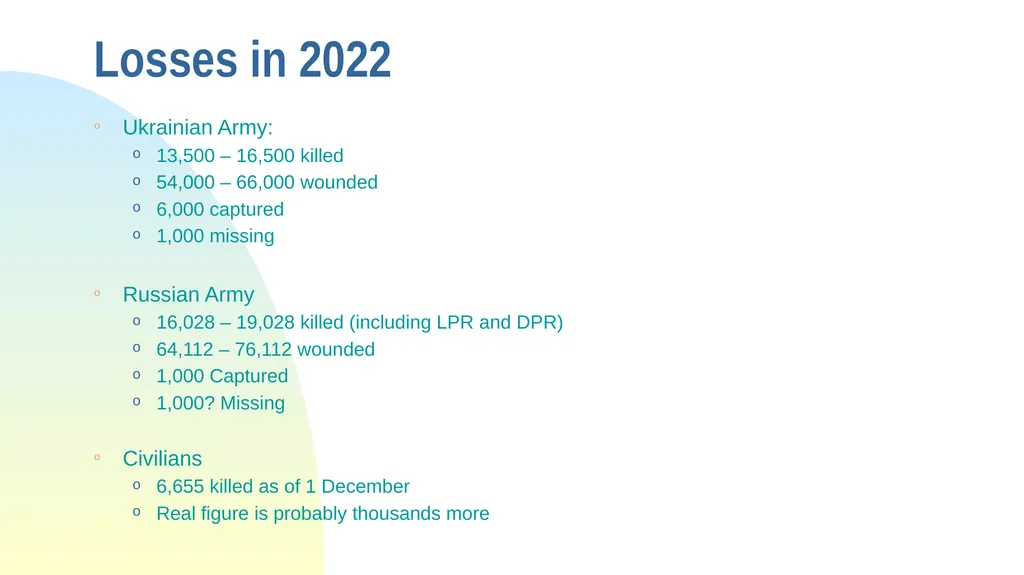
slide46. Losses in 2022 Ukrainian Army:
13,500 – 16,500 killed
54,000 – 66,000 wounded
6,000 captured
1,000 missing
Russian Army
16,028 – 19,028 killed (including LPR and DPR)
64,112 – 76,112 wounded
1,000 Captured
1,000? Missing
Civilians
6,655 killed as of 1 December
Real figure is probably thousands more<br>
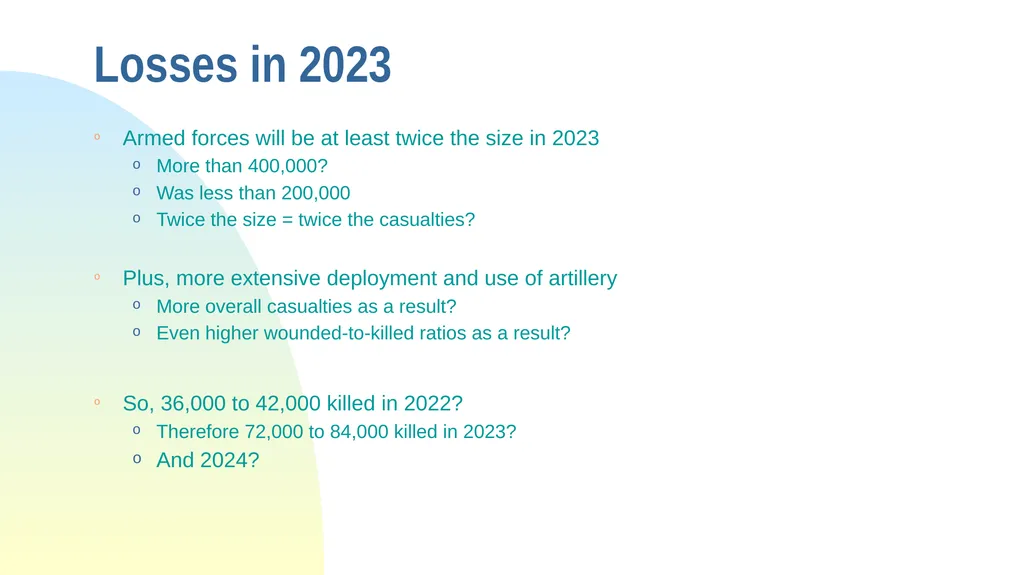
slide47. Losses in 2023 Armed forces will be at least twice the size in 2023
More than 400,000?
Was less than 200,000
Twice the size = twice the casualties?
Plus, more extensive deployment and use of artillery
More overall casualties as a result?
Even higher wounded-to-killed ratios as a result?
So, 36,000 to 42,000 killed in 2022?
Therefore 72,000 to 84,000 killed in 2023?
And 2024?<br>
slide48. Two possible hypotheses War will continue into 2024?
War may end with the removal of Putin
No really uses the word “hypotheses” in this business. They call everything a theory. Never knew why.<br>
slide49. Is Modern Combat Changing? Is the tank obsolete?
Value of drones?
Density of Deployment
Dispersion
Engagement Ranges
Loss Rates
Percent per day per division
Average loss rates
Intense loss rates
Changing Value of Wounded-to-killed ratios<br>
8215 Wolftrap Road
Tysons Corner, VA 22003
(703) 289-0007
www.dupuyinstitute.org
Christopher A. Lawrence
2 December 2022<br>
slide2. Outline: Some Observations from the War in Ukraine 1. Losses
2. Wounded-to-killed ratios
3. Combat Effectiveness
4. Urban Warfare
5. U.S. Intelligence Advantage
6. Duration of War<br>
slide3. My First Russo-Ukrainian War Book<br>
slide4. My Russo-Ukrainian War Books I am currently working on a book called “The Battle of Kyiv: The Fight for Ukraine’s Capital”
Primarily based on open sources, no special inside knowledge.
But we do have 100+ blog posts on the subject on our blog Mystics & Statistics
Completion December maybe
Better to do now, or wait?
Part of a series of four books
The Battle for Kyiv (February - March)
The Battle for Mariupol (February – May)
The Battle for the Donbas (April – July)
The Ukrainian Counteroffensives (August – November)
Whatever comes next
Each book is around 70,000 words
These are small books
But they do hopefully add up to one real book<br>
slide5. 1. Losses Ukraine has stated on 21 August that they have lost nearly 9,000 killed
This may be an understated.
Not sure if this figure includes National Guard (i.e. Azov regiment) or foreign fighters.
In 11 June Der Spiegel claimed that an advisor to Zelenskyy said that about 10,000 Ukrainian soldiers had been killed since the start of the war.
Is it safe to assume the real count is around 12,000 or higher?
Russia had stated on 21 September that they have lost 5,937
BBC Russia had assembled a listing at that time from various Russian open sources that showed 6,476 killed as of 15 September.
The BBC Russia count of Russian dead is up to 9,001 as of 18 November.
LPR stated on 5 April that they had lost 500 to 600 killed.
DPR has provided weekly loss reports and as of 1 December has lost 4,001 killed and 16,905 wounded (a 4.23-to-1 wounded-to-killed ratio).
Does this include Russians?
Are Russian Army losses 9,001 + 600 + 4,001 = 13,602 or higher?
Does this fully account for Chechens and the Wagner group?<br>
slide6. Losses – slide 2 And then there is Missing in Action
Russia stated on 30 June that they are holding 6,000 prisoners
They also have claimed to have captured 2,439 at Mariupol
Ukraine stated in early July that they had more than 7,000 missing
This includes soldiers, national guardsmen, border guards and intelligence officers.
President Zelenskyy has stated on 18 September that more Ukrainians have been captured than Russians.
There has been around 1,000 prisoners exchanged
Total Casualties are killed, wounded, captured and missing in action.<br>
slide7. Losses – slide 3 As of 7 June Ukraine was claiming to have killed 31,250 soldiers.
As of 5 June Russia was claiming to have killed 38,257 Ukrainians
Drawn from multiple sources
Lets run with the 31,250 figure for a moment.
Wounded-to-killed ratio might be 4-to-1
Probably more than half of the wounded could be returned to duty at some point
So 31,250 + (31,250 x 4) + CIA + MIA = 156,250
Long-term or irrecoverable losses could reduce this figure to below 93,750
The invading Russian Army was estimated to be 150,000 to 190,000 in strength
LPR estimated at 14,000
DPR estimated at 20,000
So, how is this army able to hold ground with such losses?
Either the Russian Army is amazingly determined and cohesive, or
Ukraine has taken similar levels of losses, leading to a “broken back” war, or
The Ukrainian casualty estimate are significantly over-estimated<br>
slide8. Losses – slide 4 Furthermore, if Russian casualties are 31,250 on 7 June and on 11 June the Ukrainians had lost 10,000 then are they killing Russians at better than a three-to-one ratio?
This is kind of what the Germans did at the Battle of Kursk (July 1943)
Is the relative performance differences of the two armies representative of the German versus the Soviet Army in World War II?
On 3 June I made a blog post called “The Ukrainian casualty claims are inflated”
“It does appear that the Ukrainian claims are off by a factor of 2 to 4.”
“The NYT claimed that as of 19 April U.S. intelligence estimated were between 7,000 to 10,000 Russians killed.”
Surprisingly this blog/twitter post did not get much pushback.
Some argued against the wounded-to-killed ratio I used.
Ukraine current claims (as of 29 November) are that they have killed 88,380 Russians
As of 21 August (when Ukraine claimed 9,000 of their own lost) the total was 45,200
So they had now gone up to a 5-to-1 kill ratio.
Russia is claiming they killed 61,207 as of 21 September.<br>
slide9. Losses – slide 5 A Ukrainian Estimate:
9,000 (21 August) + 3,000 unreported + 6,000 CIA + 1,000 MIA + 4,500 additional deaths
Additional deaths = 9,000/6 = 1,500 a month.
Total deaths = 13,500 – 16,500
Total Casualties = 74,500 – 89,500
This assumes a wounded-to-killed ratio of 4-to-1
A Russian estimate.
9,311 (BBC 25 November) + 600 (LPR 5 April) + 4,001 (DPR 1 December) = 13,912
+ 3,000 unreported + 1,000 CIA + 2,116 additional LPR deaths + 1,000? MIA
LPR estimates
600 x 9/1.5 = 3,600
(14,000 x 0.97)/5 = 2,716
Total deaths = 16,028 – 19,028
Total casualties = 82,140 – 97,140<br>
slide10. Losses – slide 6 Current DOD estimates (Gen. Milley on 9 November) are over 100,000 casualties on each side
Are they assuming parity in the casualty exchange ratio?
Does this mean that each side has lost over 25,000 killed?
Assuming they used the traditional 3-to-1 wounded-to-killed estimates
I think it is still lower
Lets say 13,500 – 18,700 killed each side
Wounded-to-killed ratio = 4-to-1
Estimate for Ukraine is 74,500 – 89,500 casualties
Estimated for Russia is 82,100 – 97,100 casualties
1 December: Ukrainian presidential advisor said between 10,000 to 13,000 Ukrainian troops had died.<br>
slide11. Losses – slide 7 Milley also stated Ukrainian civilian dead is about 40,000
The UN is currently counted 6,655 as of 28 November 2022
Probably does not include the counts from Mariupol
The head of DPR estimated over 5,000 killed at Mariupol
Ukraine is saying at 22,000 civilians
Ukraine declared on 2 December that over 9,400 civilians had been killed by artillery shelling
Obviously would be fire from direct fire weapons and other means, but clearly the primary cause of civilian casualties is artillery shelling
Don’t know if these estimates include Mariupol.
Other clams don’t match up
For example UN claims 460 civilians killed in areas held by LPR and DPR
DPR claims 1,049 civilians killed and 3,377 civilians wounded as of 1 December 2022.<br>
slide12. Losses – slide 8 The graves sites do not add up to tens of thousands
Largest grave site found is Bucha (1,346 exhumed)
And they estimated 300 missing
In Izyum they have exhumed 447 bodies (425 civilians and 22 Ukrainian servicemen)
In Kharkov region they have exhumed over 600 bodies
Lyman they exhumed 146 bodies (111 civilians and 35 military)
The sites around Manhush (near Mariupol) were only appear to be in the hundreds
Three sites reported, one with 200 graves
Mass burials at Staryi Krym (1,500?)
It was claimed to be 600 killed at a theater in Mariupol
UN review estimated one dozen killed.<br>
slide13. 2. Wounded-to-Killed Ratios This leads up to the question as to what are the wounded-to-killed ratios for this war
Theoretically the Ukrainians and Russians know, but they have not published their data.
DPR says 4.23-to-1 and they have been consistently publishing weekly since the war started.
For some reason, many people want to used the figure of 3-to-1
And some people arguing against me said it was lower than that (because?)
See my book War by Numbers, Chapter 15 (Casualties)<br>
slide14. Source of Wounded to Killed Ratios This chart is from Trevor Dupuy’s Attrition:<br>
slide15. Three-to-one Wounded-to-Killed Ratios? Effectively, this is based on U.S. experience in 1917-1918 and 1941-45
World War I (1917-1918) without gas: 2.88 among surviving wounded
4.20 wounded-to-killed ratio not counting DOW (died of wounds)
World War II (1941-1945) without USAAF: 2.77 among surviving wounded
4.25 wounded-to-killed ratio not counting DOW (died of wounds)
Note that Korean War and Vietnam wounded-to-killed ratios is 4.02 and 4.45 but still above three-to-one when DOW are accounted for (3.56 and 4.16).
This has led to many people hanging their hat and their estimates on a three-to-one ratio
Even though it was higher than that in the Korean War and the Vietnam War<br>
slide16. Three-to-one Wounded-to-Killed Ratios? - slide 2 Three things have happened since World War II that influences wounded-to-killed ratios
Use of body armor (starting USMC in Vietnam)
The impact of this is discussed in depth in the TDI study “”Combat Mortality: Why is Marine Combat Morality Less than That of the Army? (March 1998)”
The development of motorization and helicopters, leading to faster evacuation
This does increase the DOW percentages.
Improved medical care
With these three factors in play, it is pretty hard to believe that wounded-to-killed ratios remain three-to-one some 75+ years after WWII.<br>
slide17. Three-to-one Wounded-to-Killed Ratios? - slide 3 Other things that influence wounded-to-killed ratios
Posture (attacker or defender)
Mix of Wounding Weapons
Nature of combat (conventional vs unconventional)
Definitions
For example:
Wounded-to-killed ratios in I Corps Vietnam 1968-1969<br>
slide19. Three-to-one Wounded-to-Killed Ratios? - Slide 4 For example:
U.S. Army Iraq (2003 - 2011): 8.68
USMC Iraq (2003 - 2011): 10.16
U.S. Army Afghanistan (2001 – February 2012): 9.98
USMC Afghanistan (2001 – February 2012): 13.13
See War by Numbers, Chapter 15 (Casualties)
Attempts at follow-up studies were stymied
One could probably develop a wounded-to-killed predictor<br>
slide20. Three-to-one Wounded-to-Killed Ratios? - Slide 5 Meanwhile DPR is reporting at 4.23-to-1 wounded-to-killed ratio
Do not know if this includes DOW.
I assume it does not.
The First Tank Army through 15 March reported a 3.39-to-1 wounded-to-killed ratio
Small count, 61 KIA and 207 wounded.
Heavy tank losses (over a 100)
44 MIA (some may have been killed, some may have been wounded)
96 POWs (some may have been wounded)<br>
slide21. Tank Losses, Casualty Estimation and Wounded-to-Killed Ratios? Oryx, which is at least an independent broker, estimates:
For Russia (as of 14 November 2022):
1,423 tanks lost (destroyed, abandoned or captured)
55 abandoned and 515 captured
696 AFVs lost
24 abandoned and 234 captured
1,685 IFVs lost
79 abandoned and 536 captured
261 APCs lost.
12 abandoned and 92 captured.
3,523 other (see next slide)
Total for Russia: 7,588
This is based upon photo and video confirmation.
Real losses may be higher<br>
slide22. Tank Losses, Casualty Estimation and Wounded-to-Killed Ratios? – slide 2 For Russia (as of 14 November 2022):
1932 Trucks, vehicles and Jeeps
40 MRAP
163 IMV
191 CPs
242 Engineer vehicles
29 SP AT
25 Hvy Mortars
79 Artillery Support
128 Towed Artillery
267 SP Artillery
149 MLRS
Total = 3,523 Not counted for the total
148 UAVs
8 Naval Ships
6 Logistics Trains Also counted for the total
15 AA
22 SP AA
78 SAM
21 Radars
18 Jammers
61 Aircraft
63 Helicopters<br>
slide23. Tank Losses, Casualty Estimation and Wounded-to-Killed Ratios? – slide 3 Orynx, which is at least an independent broker, estimates:
For Ukraine (as of 14 November 2022):
342 tanks lost
202 AFVs lost
348 IFVs lost
171 APCs lost
1,013 other
This is based upon photo and video confirmation.
Real losses may be higher
Are Ukrainian losses as fully counted?
Total = 2,076<br>
slide24. Tank Losses, Casualty Estimation and Wounded-to-Killed Ratios? – slide 4 For Russia (as of 14 November 2022):
385 Trucks, vehicles and Jeeps
17 MRAP
201 IMV
7 CPs
33 Engineer vehicles
20 SP AT
0 Hvy Mortars
18 Artillery Support
62 Towed Artillery
67 SP Artillery
31 MLRS
Total = 1,013 Not counted for the total
51 UAVs
20 Naval Ships
0 Logistics Trains Also counted for the total
4 AA
2 SP AA
61 SAM
28 Radars
1 Jammers
55 Aircraft
21 Helicopters<br>
slide25. Tank Losses, Casualty Estimation and Wounded-to-Killed Ratios? – slide 5 Attrition reports (pages 80-81) that:
0.98 crew casualties per tank or 20% of the total crew
Tank burned: 1.28 crew casualty per loss
Tank did not burn: 0.78
Source: U.S. First Army, June 1944- April 1945
Note that a casualty is killed or wounded
Wounded-to-killed ratio for tank losses
Data not assembled
Lots of people assume 1:1
This also needs to be subject further explored<br>
slide26. Tank Losses, Casualty Estimation and Wounded-to-Killed Ratios? – slide 6 First Tank Army report for 1900, 15 March 2022:
1st Tank Regiment, 2nd Tank Division
Lost 45 T-72 B3M tanks
6 killed, 9 wounded
14th Tank Regiment, 4th Tank Division
Lost 44 T-80s UE tanks
2 killed, 13 wounded
12th Tank Regiment, 4th Tank Division
Lost 18 T-80 U tanks
5 killed, 27 wounded
0.58 or less crew casualties per tank
Vice 0.98 crew casualties per tank or 20% of the total crew
Total tank losses; 107
Total casualties: 62
13 killed, 49 wounded
3.77 wounded-to-killed ratio<br>
slide27. Comparative Losses Tanks: 1,423 vs 342 or 4.16-to-1
AFVs, IFVs & APCS: 2,642 vs 721 or 3.66-to-1
Other 3,523 vs 1,013 or 3.47-to-1
Total 7,588 vs 2,076 or 3.66-to-1
Does this mean that Russia and Ukraine are exchanging casualties at 4-to-1?
Probably not
Can this data be used to estimate losses?
Probably not<br>
slide28. 3. Quality of the Ukrainian Army versus Russian Army? How measured?
CEV
Casualty Effectiveness
Mission Accomplishment
Spatial Effectiveness (opposed advance rates)
Judgment?
Other?
CEV = Combat Effectiveness Value
A construct in the combat model TNDM that measures relative combat effectiveness of forces by comparing the model results to historical engagement.
Kind of only works after the fact.
One test run by Williams Sayers came up with a figure of 1.2 for Ukrainians over Russians based upon a rough scenario compared to actual results.
This means that Ukrainian forces were 20% more effective in combat than the opposing Russians.<br>
slide29. How Measured? Casualty Effectiveness
Loss exchange ratio in an historical engagement
Mission Accomplishment
Rating the degree of mission accomplishment on both sides
As evaluated on a 0 to 10 scale.
Spatial Effectiveness (opposed advance rates)
Distance advance during engagement (if at all)
See my book War by Numbers, Chapters 3 through 6 to see this done
All three of these are also used in calculating CEV<br>
slide30. Casualty Effectiveness? From published data (as of 21 August – 21 September)
9,000 Ukrainians killed x 5 + 6,000 captured + 1,000 missing = 52,000
5,937 Russians x 5 + 600 LPR x 5 + 3,151 DPR (22 Sep) + 13,320 DPR wounded (22 Sep) + 2,000 CIA & MIA = 51,156
Ratio of 1.02-to-1 in favor of Russians
From my estimates
Ukraine: 74,500 – 89,500
Russia: 82,140 – 97,140
Ratio of 1.10-to-1 in favor of Ukrainians.
Or 1.09-to-1 in the higher figures are used.
From Ukrainian data (as of 21 August 2022)
9,000 Ukrainians killed x 5 + 6,000 captured + 1,000 missing = 52,000
45,200 Russians killed x 5 = 226,000
Ratio of 4.35-to1 ratio in favor of Ukraine.<br>
slide31. Casualty Effectiveness? - slide 2 Note that casualty effective does not equal combat effective, although they are probably related.
Trevor Dupuy postulated that casualty effectiveness was the square of combat effectiveness
i.e. a CEV of 1.2 = 1.44 advantage in casualty effectiveness
Or you can use:
Judgment?
Other?<br>
slide32. Some Judgments Up through 1991, the Ukrainian and Russian Armies came from a common core, the Soviet Army.
Ukrainian Army
From 1991 to 2010 the Ukrainian Army being westernized, but was still led by Soviet trained officers.
In 2010 Viktor Yanokovych was elected president and the Ukrainian Army shrunk to 60,000 men.
In 2014 – 2021 the army was rebuilt from 60,000 to 169,000.
Degree of Western Doctrine?
Training of officer corps?
Gathered experience in the fighting of 2014-2015.<br>
slide33. Some Judgments – slide 2 Russian Army
Has some experience
Chechnya
KFOR
Georgia (2008)
Syria
Ukraine (2014-2015)
Doctrine?
Conscripts
Contract Soldiers
And then there is the comparative performance of the fighting of the two armies in the 78-day August offensive near Kherson conducted by Ukraine.
Did the Ukrainian Army make any significant opposed advances there?
Who suffered the higher losses in that campaign?<br>
slide34. Tentative Conclusions The Ukrainian and Russian Armies are roughly similar in ability and capabilities
The Ukrainian have the advantage of higher motivation due to defending their homeland.
The relative capabilities of the armies can change over time depending on:
How the battles are going
How the war is going
The sources of recruitment
More training
More experience
Most likely the Ukrainian Army will only get better over time.
It is possible that the Russian Army will only get worse over time.
It is possible that if morale degrades enough, it could be more like the Russian Army of 1917.
Degrading morale may also force the Russians to compromises at the negotiation table.<br>
slide35. 4. Urban Warfare We did do three urban warfare studies back in 2002 – 2004
They don’t seem to get a lot of buzz
They did force RAND to revise their work
They are summarized in two chapters in War by Numbers
The fourth study (Stalingrad) was cancelled by Hurricane Katrina
General conclusions
Urban warfare slows down casualty rates
Urban warfare slows down advance rates
DNBI declines in an urban environment<br>
slide36. Urban Warfare – slide 2 The defensive value of urban terrain is no greater than any other difficult terrain
Urban is rated 1.4 in the QJM/TNDM
Rugged mixed terrain is rated 1.55
Rolling mixed terrain is rated 1.3
Rolling bare and flat mixed terrain is rated 1.2
Flat bare terrain is rated 1.05
See NPW, page 228.
Posture factors
Defense (hasty): 1.3
Defense (prepared) 1.5
Defense (fortified) 1.6
See NPW, page 230.<br>
slide37. Urban Warfare – slide 3 So cities, because the surrounding terrain is open, do sort of serve as “defensive islands” on the battlefield, especially in February-March 2022.
But they are not uniquely defendable.
Probably the primarily reason they became defensive islands is that this is where the people, and therefore, the national guard were located.
As we noted in our original study back in 2002 (see War by Numbers, page 251):
The Impact of Urban Terrain on Operations:
“The vast majority of urban terrain encountered will be flanked by nonurban terrain.”
“Operations in the nonurban flanks will potentially advance at a pace two to four times that of the urban operations.”
“Under normal circumstances the urban areas will be bypassed on one or both flanks and will be threatened with envelopment within a few days of an operation beginning.”
“Furthermore, as the attacker is usually aware that faster progress can me made outside the urban terrain, the tendency is to weigh one or both flanks and not bother to attack the city until it is enveloped.”
“This will, of course, result in either the defender withdrawing from the urban terrain, which is what traditionally has occurred, or an assault and eventual mop-up operation by the attacker of the enveloped defenders.”
“This has been the consistent pattern in the past and will likely continue to be so in the future for those cases where urban terrain, regardless of its increased size or density, has nonurban flanks.”
This appears to still be the case.<br>
slide38. 5. U.S. Intelligence Advantage It is clear that Ukraine has been operating with an intelligence advantage since the start of the war
Movement of air defenses and movement of aircraft out of harms way
IL-76 allegedly intercepted on way to Hostomel Airport
Twelve generals killed
The ambush at Brovary
Probably several other ambushes
Failure to assassinate Zelenskyy
Attack on the airbase near Kherson
Strike of a depot near Belgorod (30 March)
Resupplying Mariupol by helicopter
Tracking (and sinking) of the Moskva.
First blogged about it on 2 April<br>
slide39. U.S. Intelligence Advantage – slide 2 We did do a study for OSD Net Assessment (Andy Marshall) on “Measuring the Value of Situational Awareness” in 2004.
It was based upon 295 division-level World War II engagements
149 from the Western Front
146 from the Eastern Front 1943 (Kursk and Kharkov)
We did review the intelligence files of each of the divisions involved.
It was/is the only estimate/measurement of value of situational awareness/information advantage that we are aware of made from real-world combat.
It produced results that were less significant than the several non-real world studies/intellectual explorations on the subject.
It also did not get a lot of buzz.
I did summarize the study in two chapters in War by Numbers.<br>
slide40. U.S. Intelligence Advantage – slide 3 Rough conclusions (because the conclusions were rough)
Superior information advantage gives around a 25% advantage
This is about the same as a proposed CEV of 1.25.
Poor situational awareness affects the defenders more than the attackers
Not much as difference in the results between some and considerable as there was between some and little
The real problems are caused when you know nothing?
There is a point of diminishing returns to situational awareness?
So do the Ukrainian have a 20% or so CEV advantage or a 25% intelligence advantage?<br>
slide41. 6. Duration of War I have been saying (in bold) in my blog that this will go to at least fall 2023
In my periodic posts
April 13 (Day 49) “This is beginning to look like an extended war”
May 20 (Day 86): “This looks like an extended war and I don’t think it will be over before the end of summer”
October 1 (Day 220): “This looks like an extended war and I don’t think it will be over before the end of summer 2023.”
14 April post “So, How Long a War?”
June 14 post “So How Long is this War Gong to Last?
“I do not think by the end of this summer that both sides will be willing to sit down and find a compromise that could end this war.”
Draft posting stated on 5 March: “So, right now this is beginning to look like a six-month to three-year war.”
So when does this end?
Bad weather November – April
Suspect the Ukrainian will want to go through the campaign season of May-October 2023<br>
slide42. Duration of War – slide 2 To negotiate a peace agreement you have to have something to negotiate
What will Ukraine give up?
Territory of Kherson and Zaporizhia province so Russian can give have continuity with Crimea?
Lugansk and Donetsk provinces?
Crimea and Sevastopol?
Membership in NATO?
Membership in EU?
Water rights for Crimea (probably)?
What will Russia give up?
Reparations?
Hand over war criminals
Prisoner exchange (probably)?
This war will be decided first on the ground before it is decided at the negotiation table.
Talks getting started don’t mean a lot
U.S./South Vietnam/North Vietnam talks started on 10 May 1968, did not reach agreement until 27 January 1973 and Saigon fell on 30 April 1975.
Currently there are no talks<br>
slide43. Duration of War – slide 3 Post of 21 June 2022: “Possible outcomes of this war”
First it depends on who is advancing and taking ground
If Russia continues advancing
If neither side makes much further progress on the ground
A cease-fire in place?
War to continue at some point in the future?
If Ukraine starts advancing over this summer:
A negotiation settlement returning Kherson and Zaporozhzhia to Ukrainian control
Might include a recognition of Russia’s claim to Crimea, Sevastopol and the Donbas
This assumes that the Ukrainian advance is limited
A negotiated settlement returning Kherson, Zaporozhzhia, Lugansk and Donetsk to Ukrainian control.
Might include a recognition of Russia’s claim to Crimea and Sevastopol
This assumes a significant Ukrainian advance
Finally, if Ukraine’s advance breaks into Crimea, we could be looking at a ceasefire with all territory taken from Ukraine since 2013 returned to it.<br>
slide44. Duration of War – slide 4 There are four scenarios that could heavily influence all this in the coming years (if the war carries onto 2024 or 2025)
If Putin dies, is overthrown or replaced.
Putin dies or is incapacitated
Putin retired at the end of his current term (7 May 2024)
Putin is replaced
The replacement president could be
Someone who continues Putin’s policies
Someone who believes they war should be pursued more aggressively
Someone who wants to reach a settlement
A member of the opposition (who would probably favor ending the war)
Russia descends into political violence
Anti-war protests mutate into anti-government protests
A coup fails and the coup plotters continue fighter or there is a countercoup effort
Central authority collapses (this happened in 1991)
The presidency of Volodymyr Zelenskyy is replaced
Next election is March 2024
The U.S. president is changed to someone who does not support the war
U.S. election is November 2024, with the president taking power in January 2025<br>
slide45. Duration of War – slide 5 Due to outside factors, 2024 could be a turning point in this war.
Zelenskyy re-election March 2024
Putin re-election 7 May 2024
Military campaign season ends in October 2024
U.S. election November 2024
Windows of opportunity for negotiated settlement
Fall 2022 (doesn’t look like it is happening)
Fall 2023?
Fall 2024?<br>
slide46. Losses in 2022 Ukrainian Army:
13,500 – 16,500 killed
54,000 – 66,000 wounded
6,000 captured
1,000 missing
Russian Army
16,028 – 19,028 killed (including LPR and DPR)
64,112 – 76,112 wounded
1,000 Captured
1,000? Missing
Civilians
6,655 killed as of 1 December
Real figure is probably thousands more<br>
slide47. Losses in 2023 Armed forces will be at least twice the size in 2023
More than 400,000?
Was less than 200,000
Twice the size = twice the casualties?
Plus, more extensive deployment and use of artillery
More overall casualties as a result?
Even higher wounded-to-killed ratios as a result?
So, 36,000 to 42,000 killed in 2022?
Therefore 72,000 to 84,000 killed in 2023?
And 2024?<br>
slide48. Two possible hypotheses War will continue into 2024?
War may end with the removal of Putin
No really uses the word “hypotheses” in this business. They call everything a theory. Never knew why.<br>
slide49. Is Modern Combat Changing? Is the tank obsolete?
Value of drones?
Density of Deployment
Dispersion
Engagement Ranges
Loss Rates
Percent per day per division
Average loss rates
Intense loss rates
Changing Value of Wounded-to-killed ratios<br>