
Soot and gaseous emissions characterization of

Description: Soot and gaseous emissions characterization of butyl-acetatediesel blend in a heavy-duty engine Paper Number: 23PFL-0478 Spencer Hall, Joshua Bittle University of Alabama, Tuscaloosa WCX SAE 2023 WCX SAE World Congress Experience April
Related Topics
Download Presentation
"Soot and gaseous emissions characterization of" is the property of its rightful owner. Permission is granted to download and print the materials on this website for personal, non-commercial use only, and to display it on your personal computer provided you do not modify the materials and that you retain all copyright notices contained in the materials. By downloading content from our website, you accept the terms of this agreement.
Presentation Transcript
slide1. Soot and gaseous emissions characterization of butyl-acetate/diesel blend in a heavy-duty engine
Paper Number: 23PFL-0478
Spencer Hall, Joshua Bittle
University of Alabama, Tuscaloosa
WCX SAE 2023
WCX SAE World Congress Experience
April 18–20, 2023, Detroit, Michigan 1/#<br>
slide2. Outline 2/# Background
Objectives
Experimental setup
Data Processing Methods
Test conditions
Results<br>
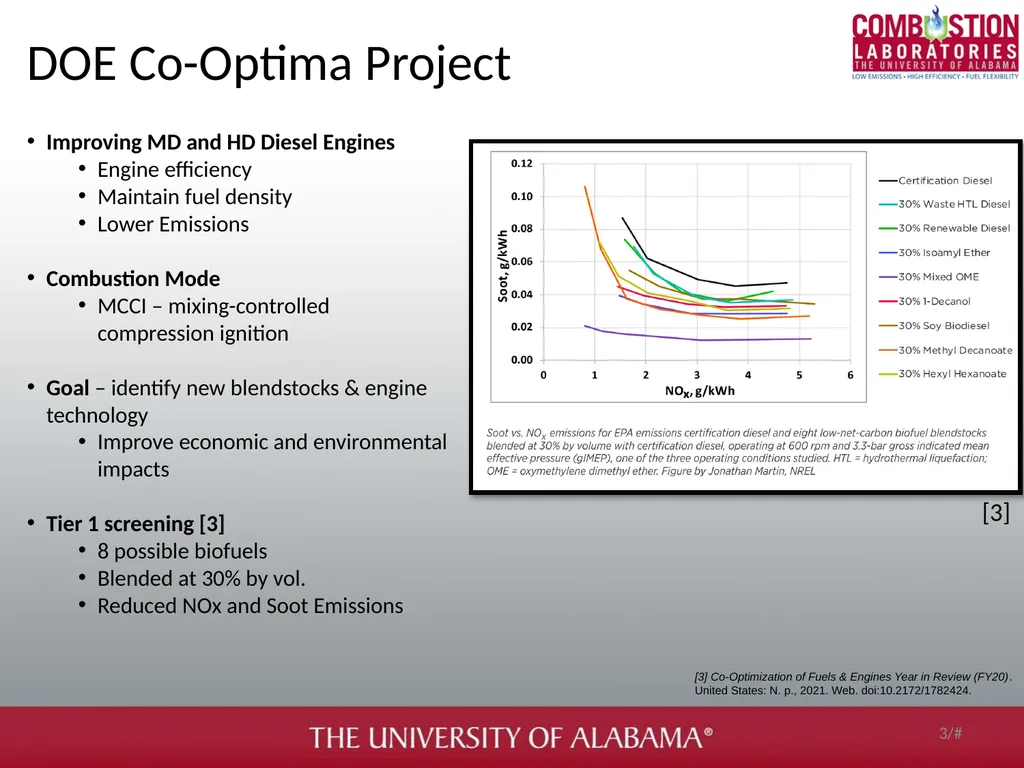
slide3. DOE Co-Optima Project 3/# [3] Improving MD and HD Diesel Engines
Engine efficiency
Maintain fuel density
Lower Emissions
Combustion Mode
MCCI – mixing-controlled compression ignition
Goal – identify new blendstocks & engine technology
Improve economic and environmental impacts
Tier 1 screening [3]
8 possible biofuels
Blended at 30% by vol.
Reduced NOx and Soot Emissions [3] Co-Optimization of Fuels & Engines Year in Review (FY20). United States: N. p., 2021. Web. doi:10.2172/1782424.<br>
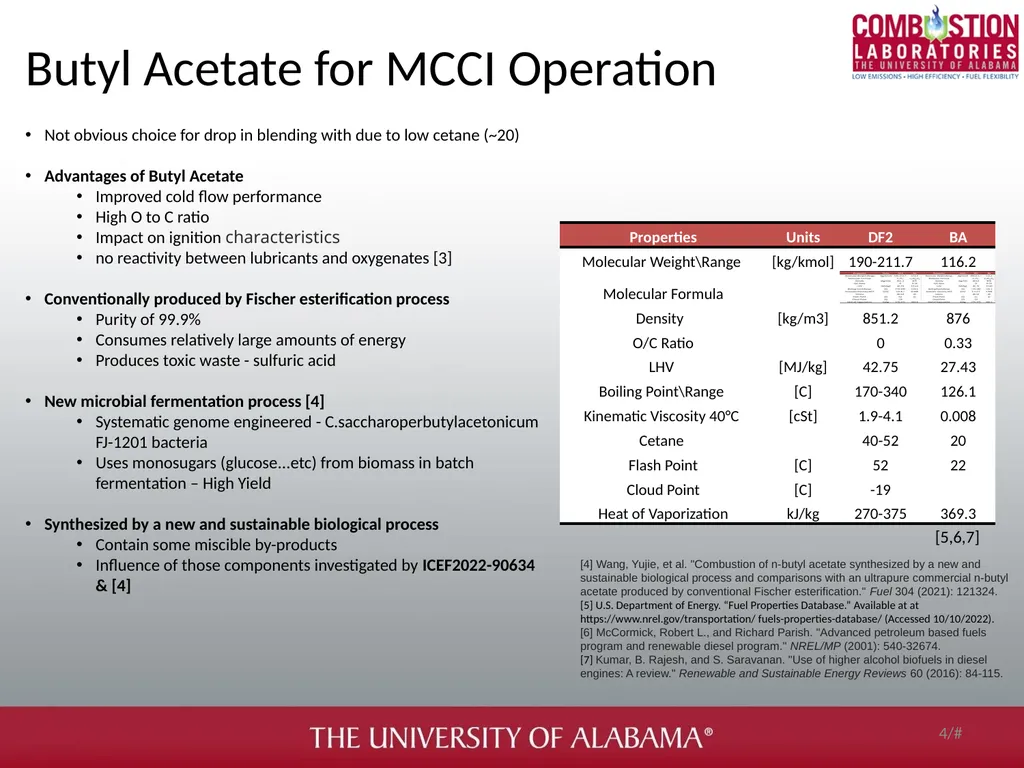
slide4. Butyl Acetate for MCCI Operation 4/# Not obvious choice for drop in blending with due to low cetane (~20)
Advantages of Butyl Acetate
Improved cold flow performance
High O to C ratio
Impact on ignition characteristics
no reactivity between lubricants and oxygenates [3]
Conventionally produced by Fischer esterification process
Purity of 99.9%
Consumes relatively large amounts of energy
Produces toxic waste - sulfuric acid
New microbial fermentation process [4]
Systematic genome engineered - C.saccharoperbutylacetonicum FJ-1201 bacteria
Uses monosugars (glucose...etc) from biomass in batch fermentation – High Yield
Synthesized by a new and sustainable biological process
Contain some miscible by-products
Influence of those components investigated by ICEF2022-90634 & [4] [4] Wang, Yujie, et al. "Combustion of n-butyl acetate synthesized by a new and sustainable biological process and comparisons with an ultrapure commercial n-butyl acetate produced by conventional Fischer esterification." Fuel 304 (2021): 121324.
[5] U.S. Department of Energy. “Fuel Properties Database.” Available at at https://www.nrel.gov/transportation/ fuels-properties-database/ (Accessed 10/10/2022).
[6] McCormick, Robert L., and Richard Parish. "Advanced petroleum based fuels program and renewable diesel program." NREL/MP (2001): 540-32674.
[7] Kumar, B. Rajesh, and S. Saravanan. "Use of higher alcohol biofuels in diesel engines: A review." Renewable and Sustainable Energy Reviews 60 (2016): 84-115. [5,6,7]<br>
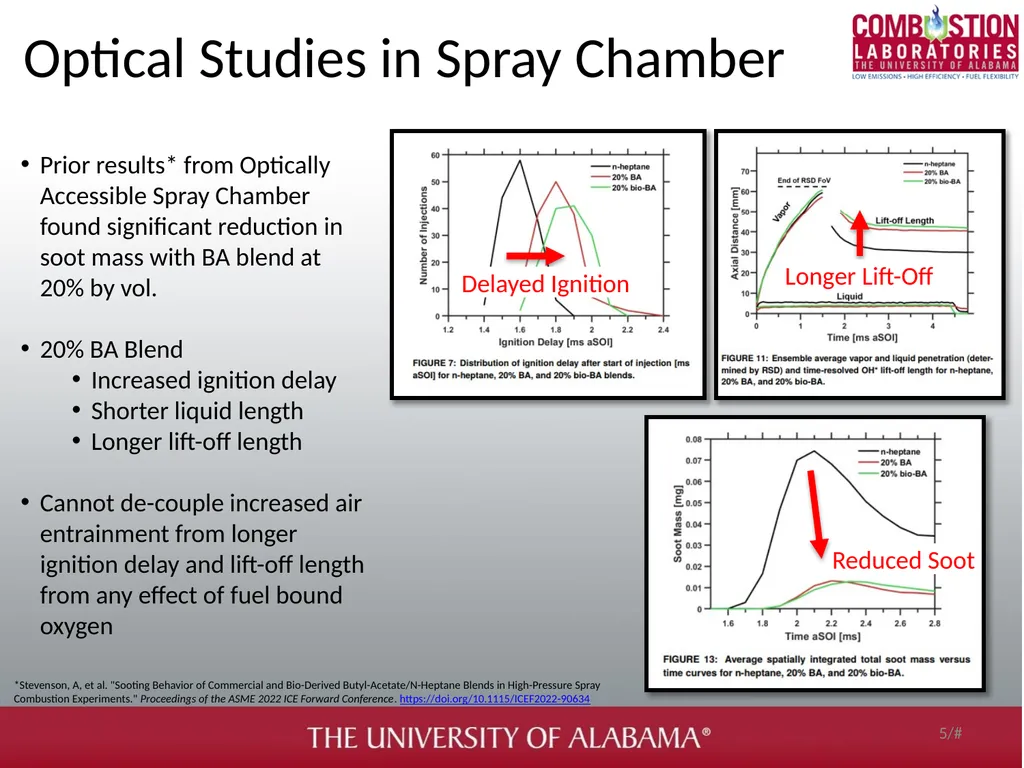
slide5. Optical Studies in Spray Chamber 5/# Prior results* from Optically Accessible Spray Chamber found significant reduction in soot mass with BA blend at 20% by vol.
20% BA Blend
Increased ignition delay
Shorter liquid length
Longer lift-off length
Cannot de-couple increased air entrainment from longer ignition delay and lift-off length from any effect of fuel bound oxygen Delayed Ignition Longer Lift-Off Reduced Soot *Stevenson, A, et al. "Sooting Behavior of Commercial and Bio-Derived Butyl-Acetate/N-Heptane Blends in High-Pressure Spray Combustion Experiments." Proceedings of the ASME 2022 ICE Forward Conference. https://doi.org/10.1115/ICEF2022-90634<br>
slide6. Objectives Test BA blend as drop-in blend at 5% by vol HDD
Compare Engine Performance between fuels
Soot Emissions
Efficiency & Performance
Emissions & Combustion
Investigate how engine ECU responds to different fuel
Identify potential benefits and drawbacks to BA and why it performs differently 6/#<br>
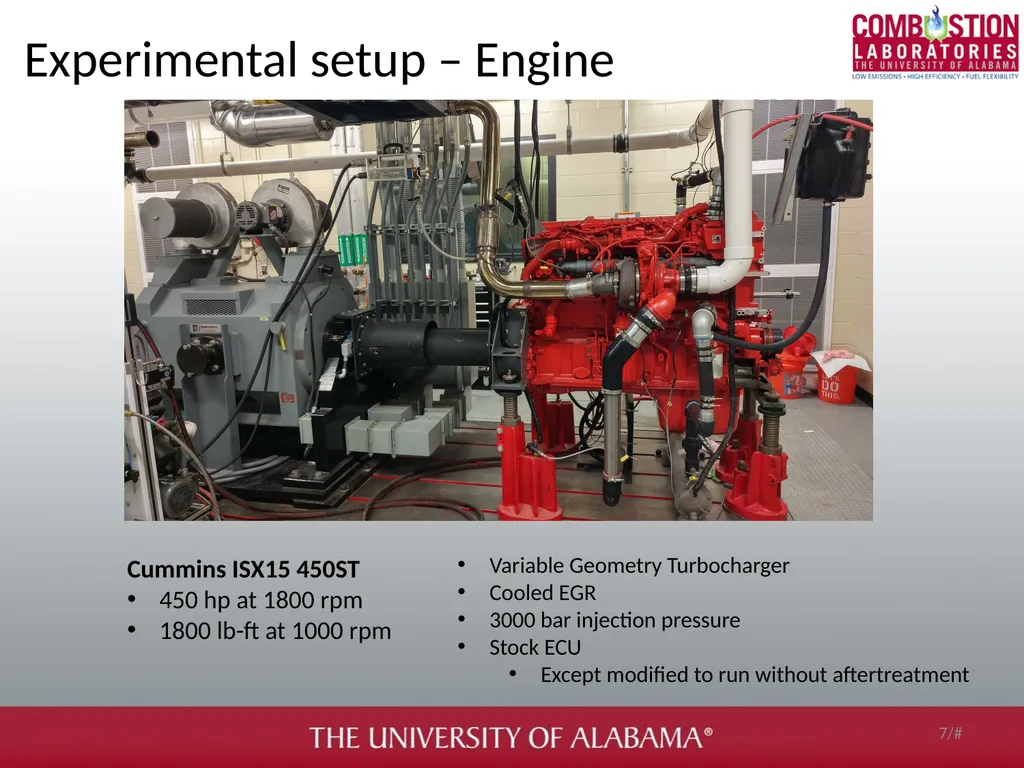
slide7. Experimental setup – Engine 7/# Variable Geometry Turbocharger
Cooled EGR
3000 bar injection pressure
Stock ECU
Except modified to run without aftertreatment Cummins ISX15 450ST
450 hp at 1800 rpm
1800 lb-ft at 1000 rpm<br>
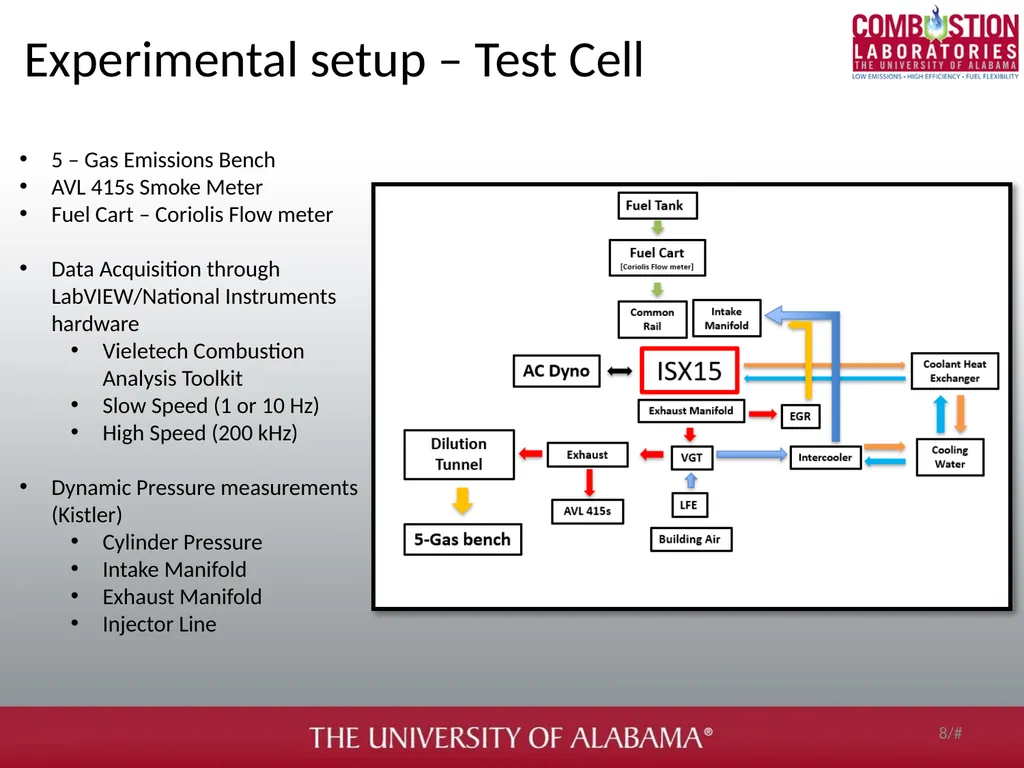
slide8. Experimental setup – Test Cell 8/# 5 – Gas Emissions Bench
AVL 415s Smoke Meter
Fuel Cart – Coriolis Flow meter
Data Acquisition through LabVIEW/National Instruments hardware
Vieletech Combustion Analysis Toolkit
Slow Speed (1 or 10 Hz)
High Speed (200 kHz)
Dynamic Pressure measurements (Kistler)
Cylinder Pressure
Intake Manifold
Exhaust Manifold
Injector Line<br>
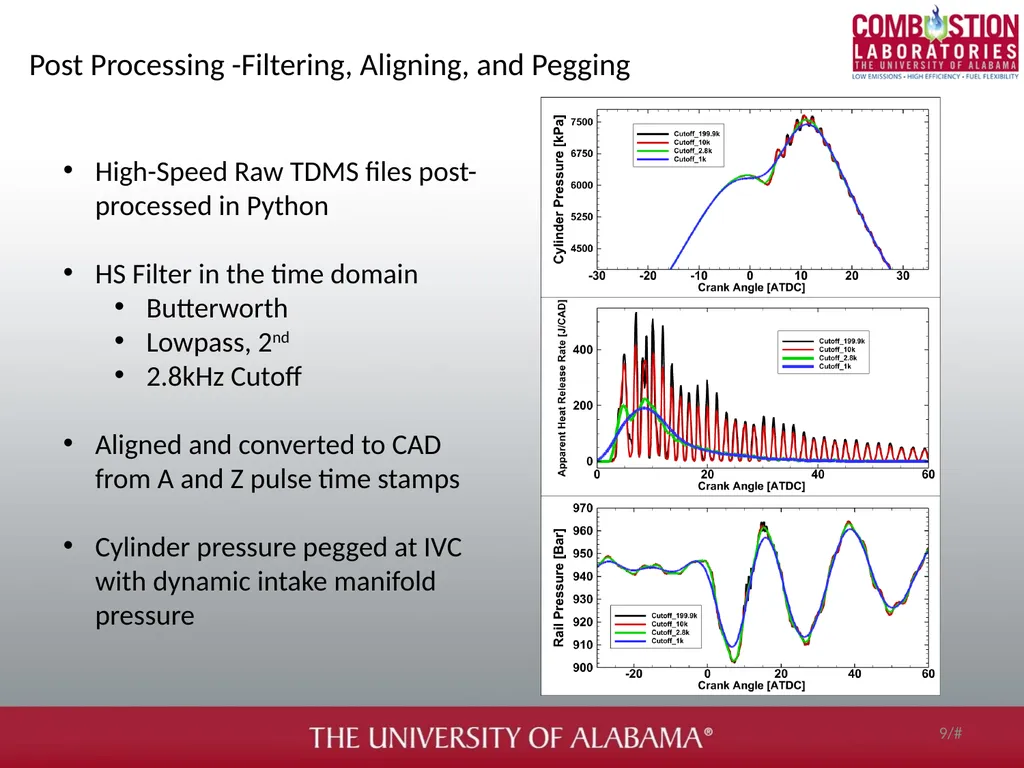
slide9. Post Processing -Filtering, Aligning, and Pegging 9/# High-Speed Raw TDMS files post-processed in Python
HS Filter in the time domain
Butterworth
Lowpass, 2nd
2.8kHz Cutoff
Aligned and converted to CAD from A and Z pulse time stamps
Cylinder pressure pegged at IVC with dynamic intake manifold pressure<br>
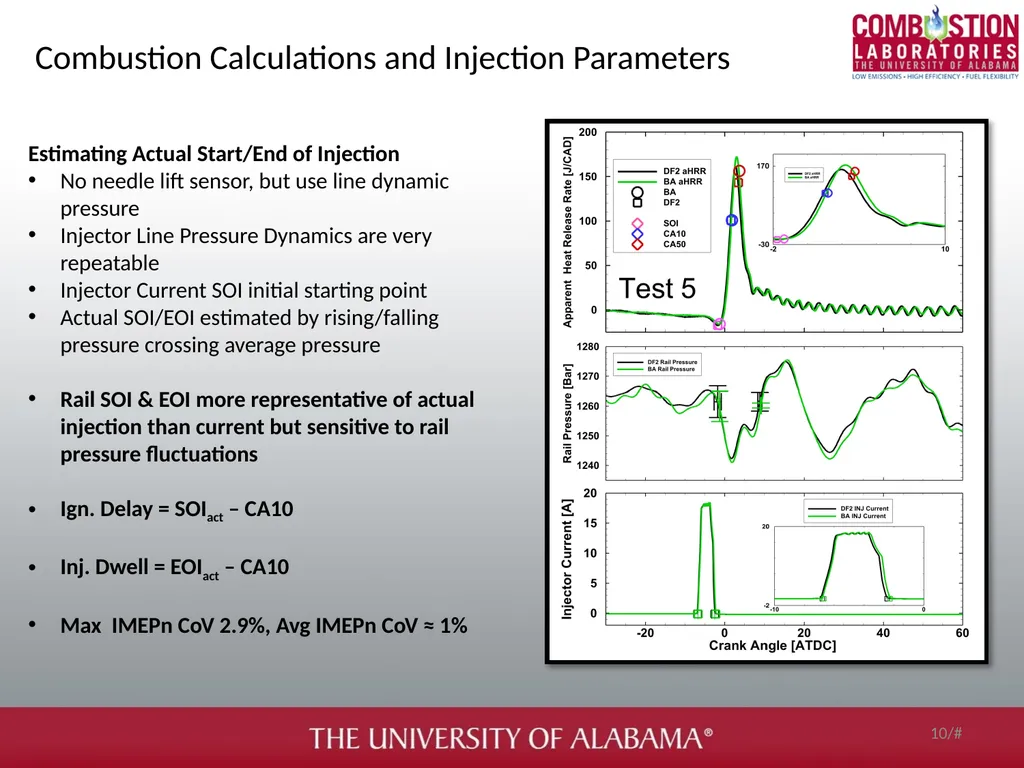
slide10. Combustion Calculations and Injection Parameters 10/# Estimating Actual Start/End of Injection
No needle lift sensor, but use line dynamic pressure
Injector Line Pressure Dynamics are very repeatable
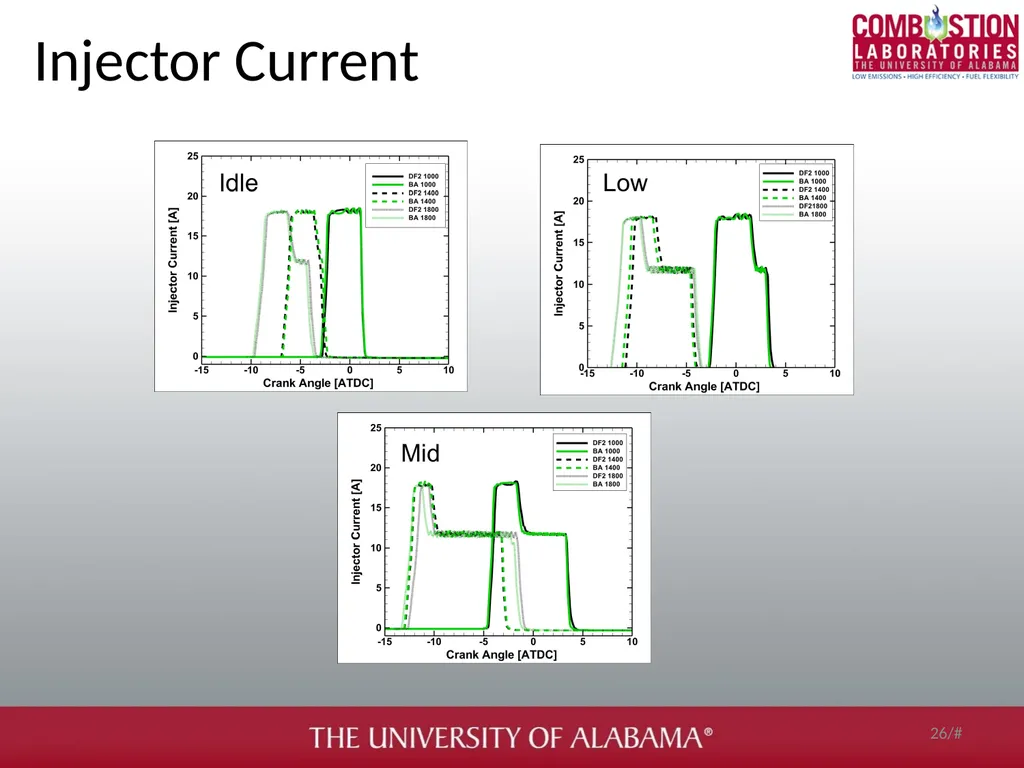
Injector Current SOI initial starting point
Actual SOI/EOI estimated by rising/falling pressure crossing average pressure
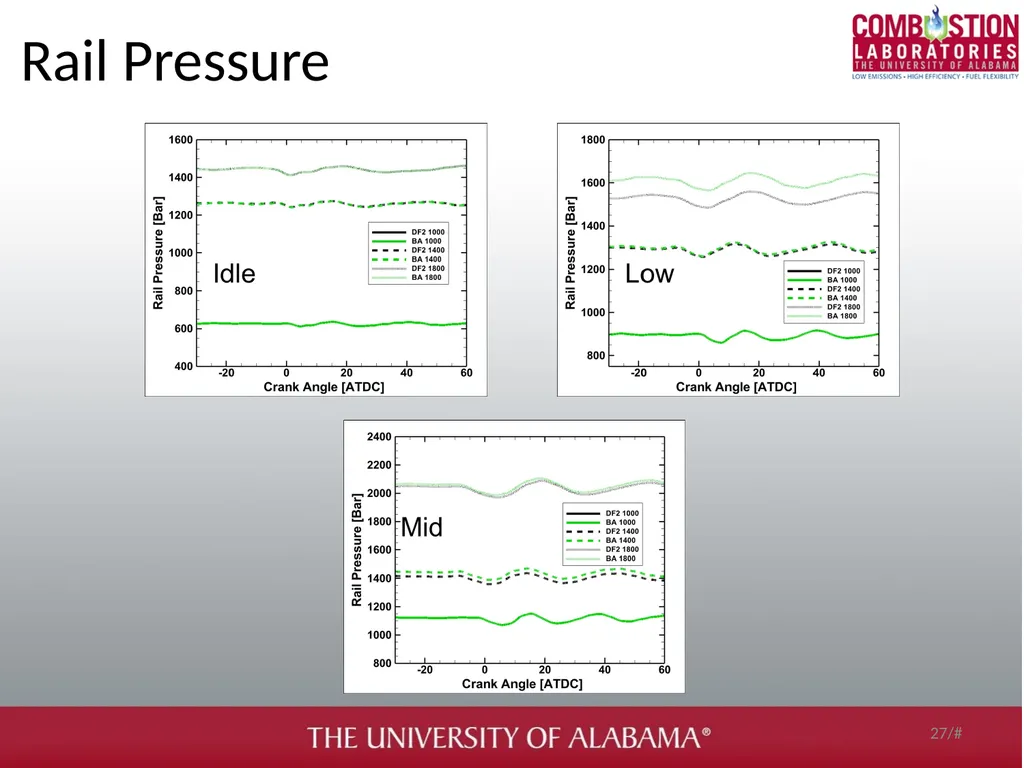
Rail SOI & EOI more representative of actual injection than current but sensitive to rail pressure fluctuations
Ign. Delay = SOIact – CA10
Inj. Dwell = EOIact – CA10
Max IMEPn CoV 2.9%, Avg IMEPn CoV ≈ 1%<br>
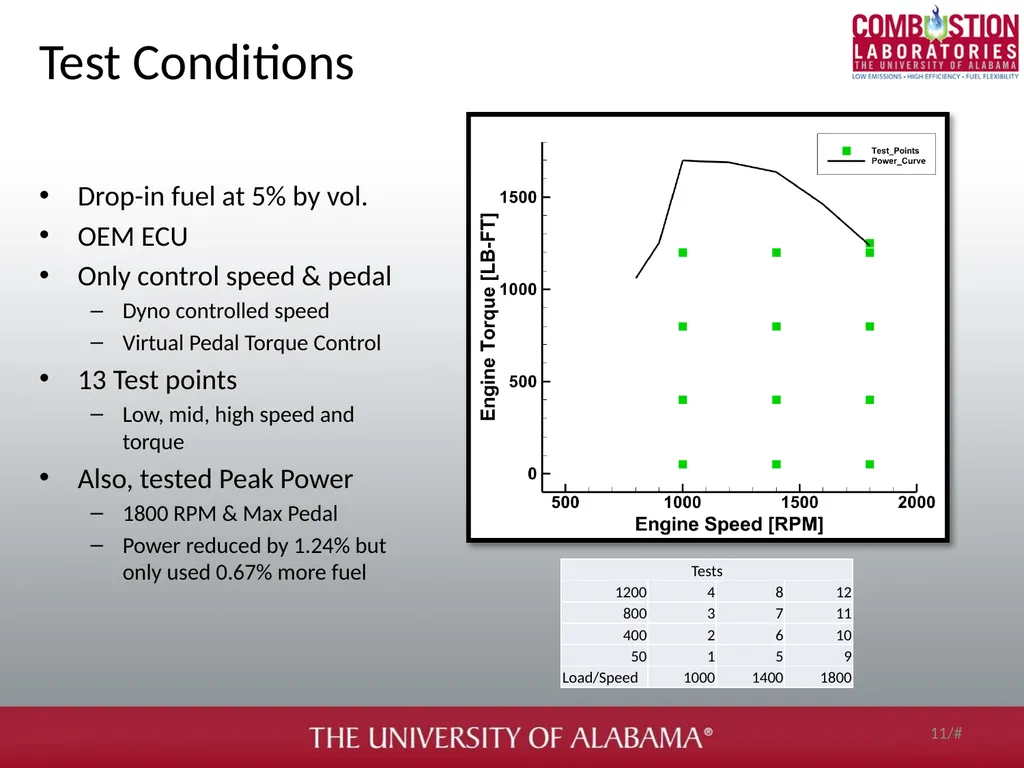
slide11. Test Conditions 11/# Drop-in fuel at 5% by vol.
OEM ECU
Only control speed & pedal
Dyno controlled speed
Virtual Pedal Torque Control
13 Test points
Low, mid, high speed and torque
Also, tested Peak Power
1800 RPM & Max Pedal
Power reduced by 1.24% but only used 0.67% more fuel<br>
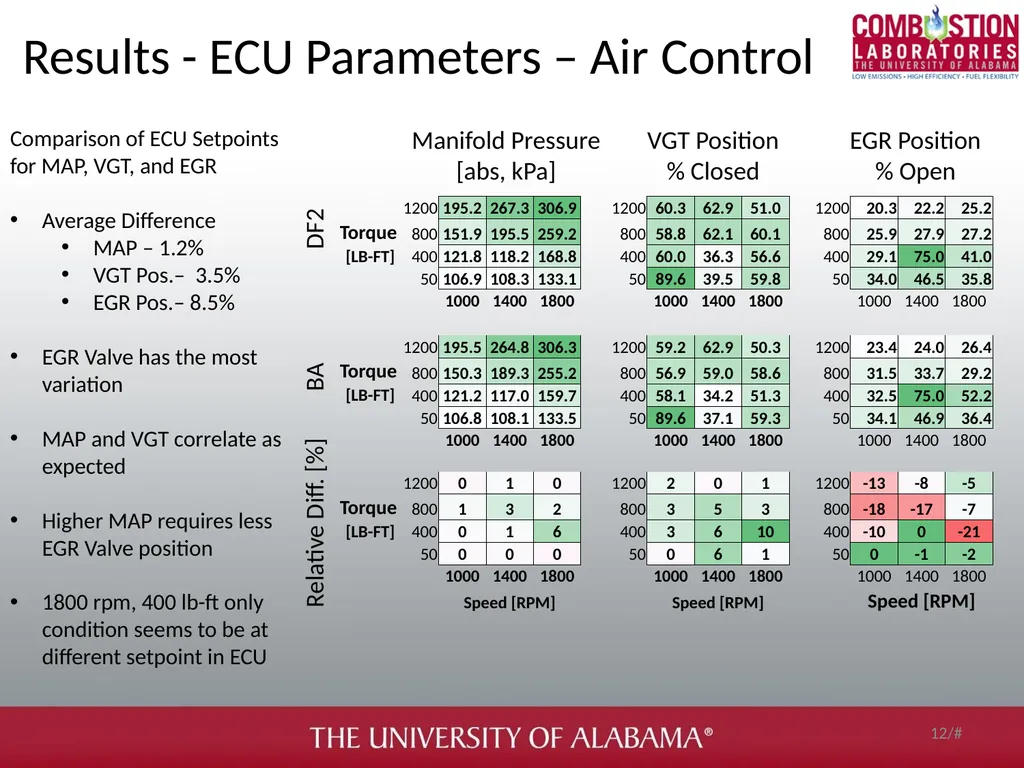
slide12. Results - ECU Parameters – Air Control 12/# Comparison of ECU Setpoints for MAP, VGT, and EGR
Average Difference
MAP – 1.2%
VGT Pos.– 3.5%
EGR Pos.– 8.5%
EGR Valve has the most variation
MAP and VGT correlate as expected
Higher MAP requires less EGR Valve position
1800 rpm, 400 lb-ft only condition seems to be at different setpoint in ECU Manifold Pressure
[abs, kPa] VGT Position
% Closed EGR Position
% Open Relative Diff. [%] BA DF2<br>
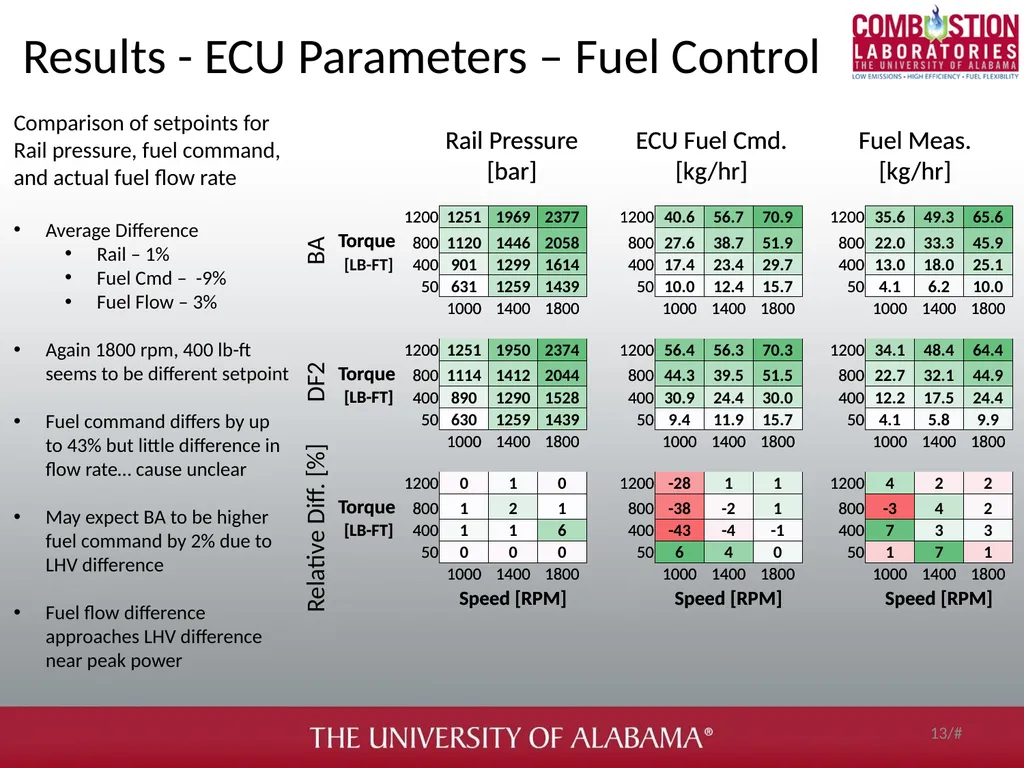
slide13. Results - ECU Parameters – Fuel Control 13/# Comparison of setpoints for Rail pressure, fuel command, and actual fuel flow rate
Average Difference
Rail – 1%
Fuel Cmd – -9%
Fuel Flow – 3%
Again 1800 rpm, 400 lb-ft seems to be different setpoint
Fuel command differs by up to 43% but little difference in flow rate… cause unclear
May expect BA to be higher fuel command by 2% due to LHV difference
Fuel flow difference approaches LHV difference near peak power Rail Pressure
[bar] ECU Fuel Cmd.
[kg/hr] Fuel Meas.
[kg/hr] Relative Diff. [%] DF2 BA Rail Pressure
[bar] ECU Fuel Cmd.
[kg/hr] Fuel Meas.
[kg/hr]<br>
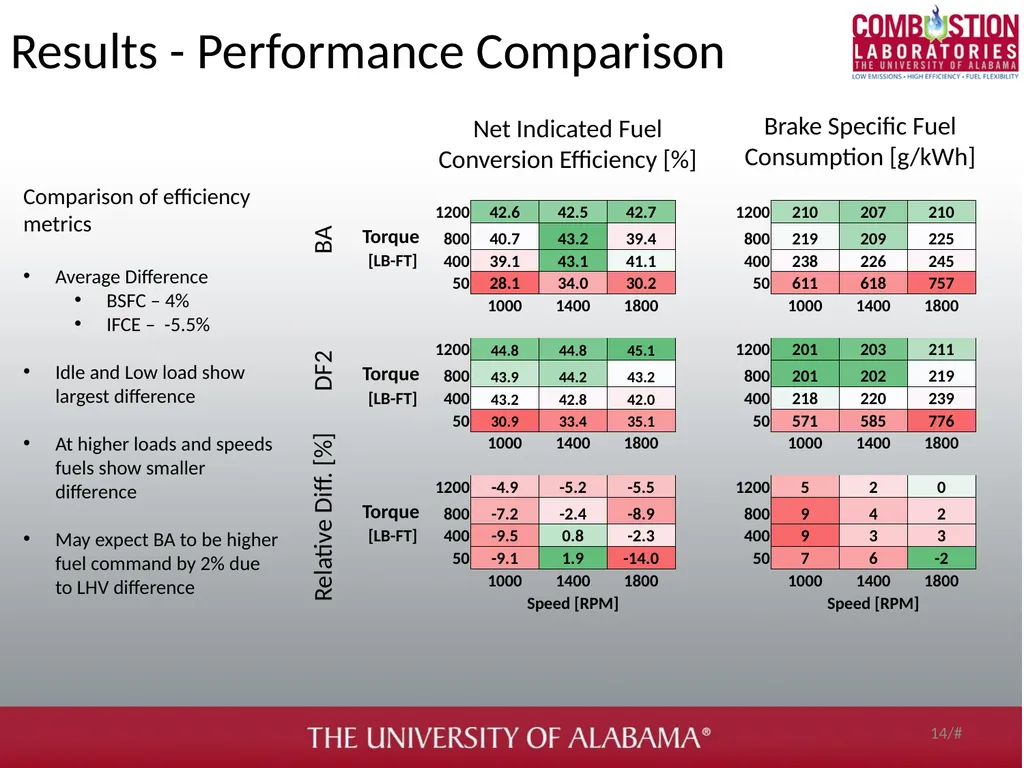
slide14. Results - Performance Comparison 14/# Comparison of efficiency metrics
Average Difference
BSFC – 4%
IFCE – -5.5%
Idle and Low load show largest difference
At higher loads and speeds fuels show smaller difference
May expect BA to be higher fuel command by 2% due to LHV difference Net Indicated Fuel Conversion Efficiency [%] Brake Specific Fuel Consumption [g/kWh] Relative Diff. [%] DF2 BA<br>
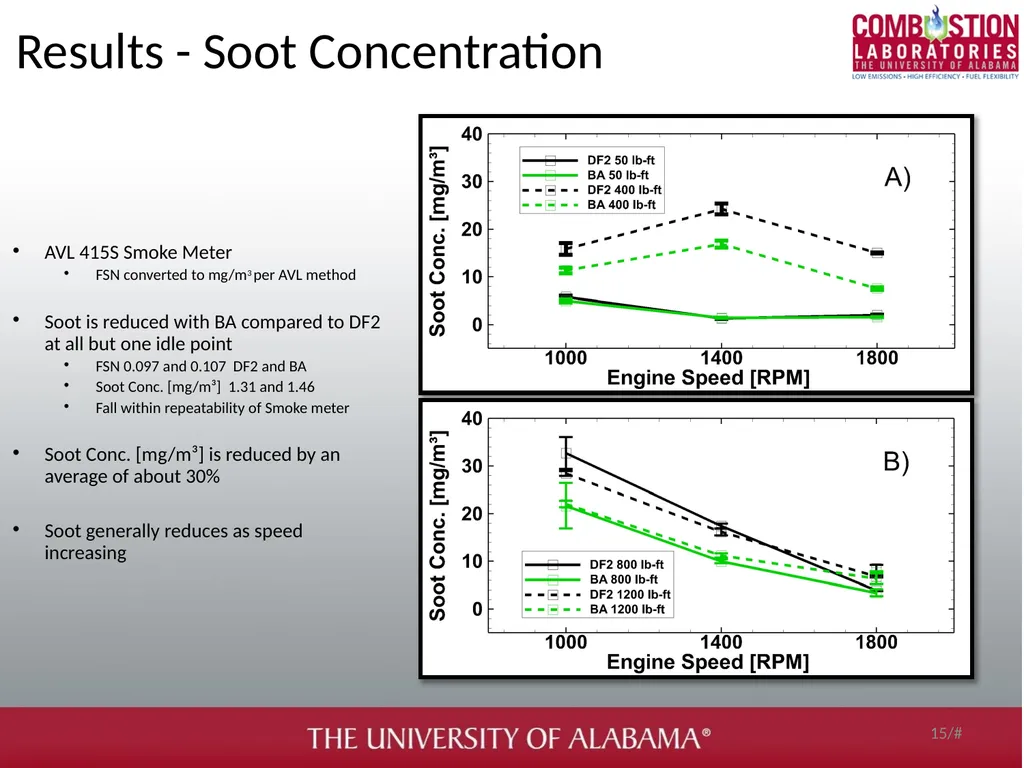
slide15. Results - Soot Concentration 15/# AVL 415S Smoke Meter
FSN converted to mg/m3 per AVL method
Soot is reduced with BA compared to DF2 at all but one idle point
FSN 0.097 and 0.107 DF2 and BA
Soot Conc. [mg/m³] 1.31 and 1.46
Fall within repeatability of Smoke meter
Soot Conc. [mg/m³] is reduced by an average of about 30%
Soot generally reduces as speed increasing<br>
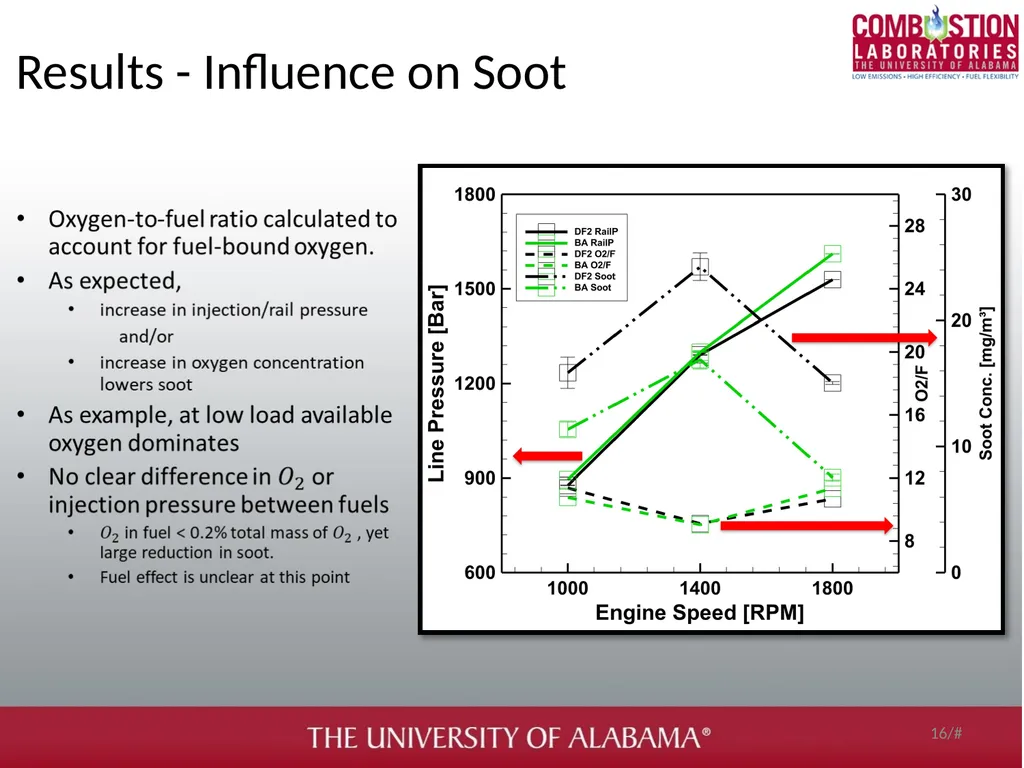
slide16. Results - Influence on Soot 16/#<br>
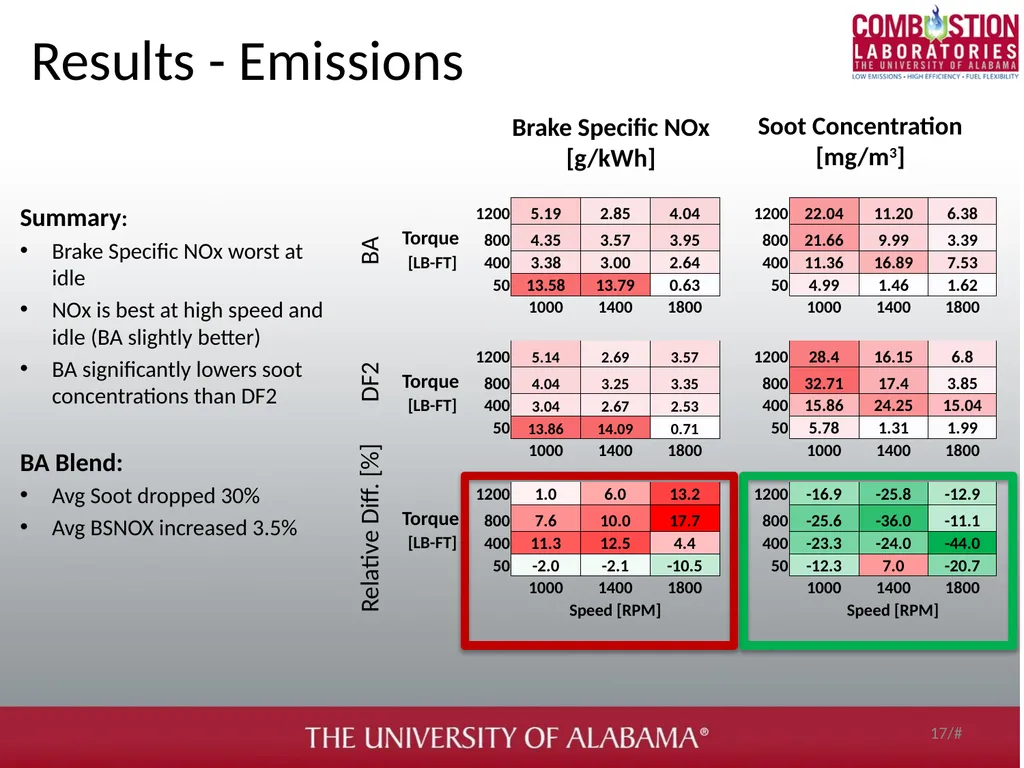
slide17. Summary:
Brake Specific NOx worst at idle
NOx is best at high speed and idle (BA slightly better)
BA significantly lowers soot concentrations than DF2
BA Blend:
Avg Soot dropped 30%
Avg BSNOX increased 3.5% Results - Emissions 17/# Brake Specific NOx [g/kWh] Soot Concentration [mg/m3] Relative Diff. [%] DF2 BA<br>
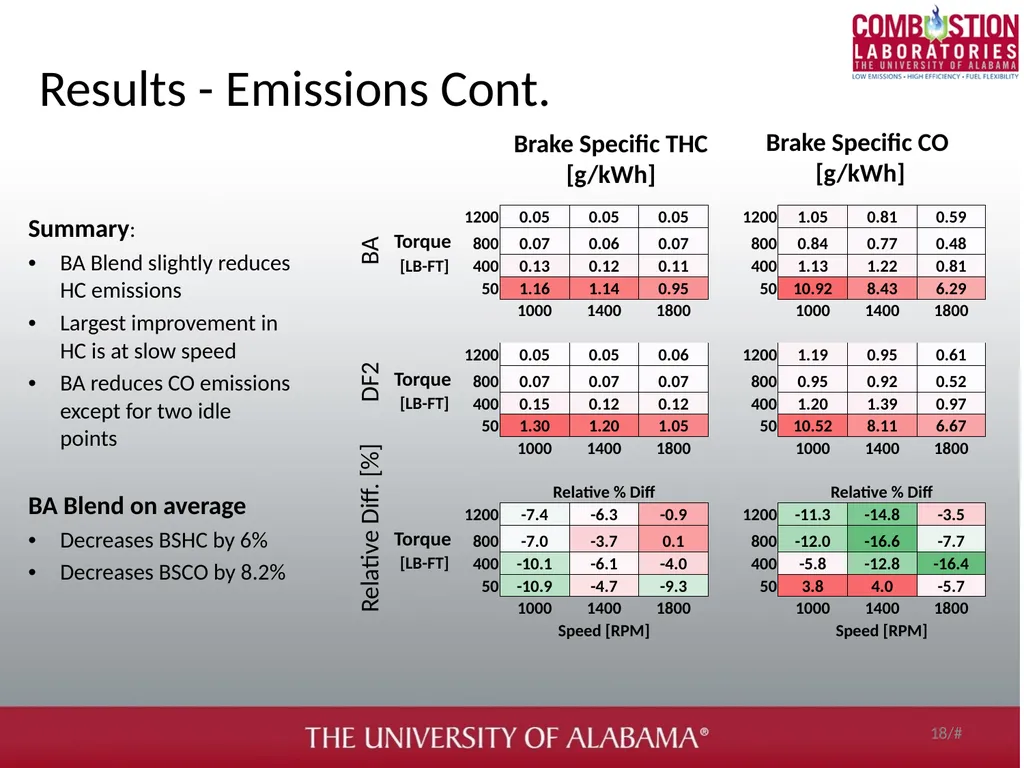
slide18. Summary:
BA Blend slightly reduces HC emissions
Largest improvement in HC is at slow speed
BA reduces CO emissions except for two idle points
BA Blend on average
Decreases BSHC by 6%
Decreases BSCO by 8.2% Results - Emissions Cont. 18/# Brake Specific THC [g/kWh] Brake Specific CO [g/kWh] Relative Diff. [%] DF2 BA<br>
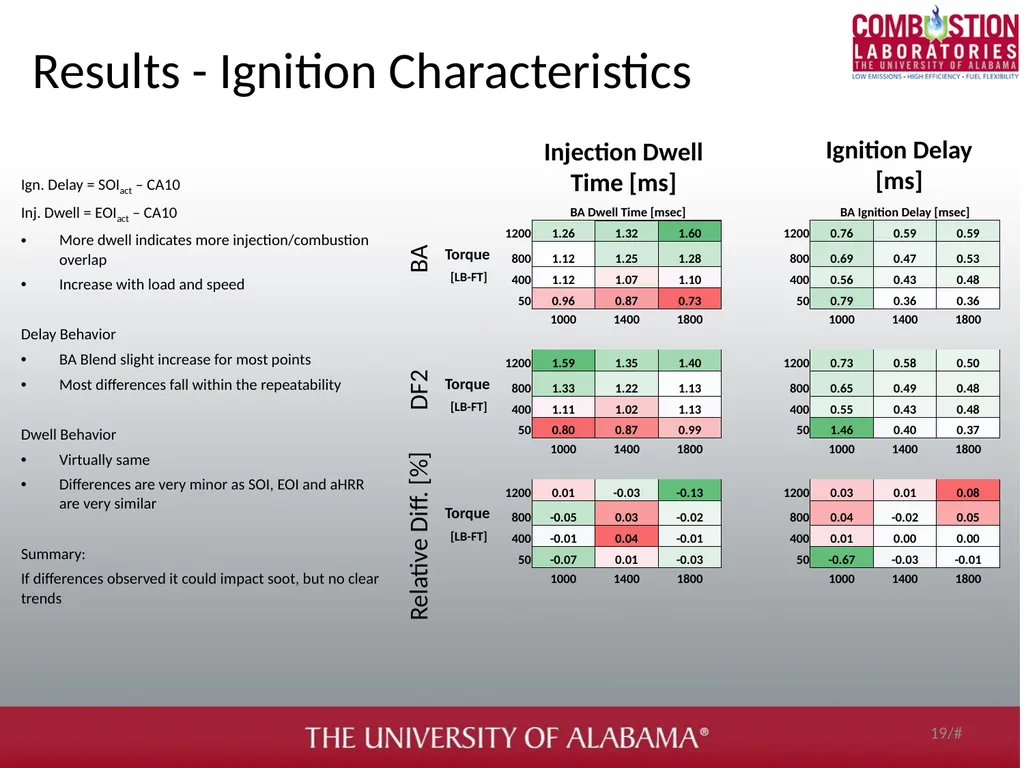
slide19. Ign. Delay = SOIact – CA10
Inj. Dwell = EOIact – CA10
More dwell indicates more injection/combustion overlap
Increase with load and speed
Delay Behavior
BA Blend slight increase for most points
Most differences fall within the repeatability
Dwell Behavior
Virtually same
Differences are very minor as SOI, EOI and aHRR are very similar
Summary:
If differences observed it could impact soot, but no clear trends Results - Ignition Characteristics 19/# Injection Dwell Time [ms] Ignition Delay [ms] Relative Diff. [%] DF2 BA<br>
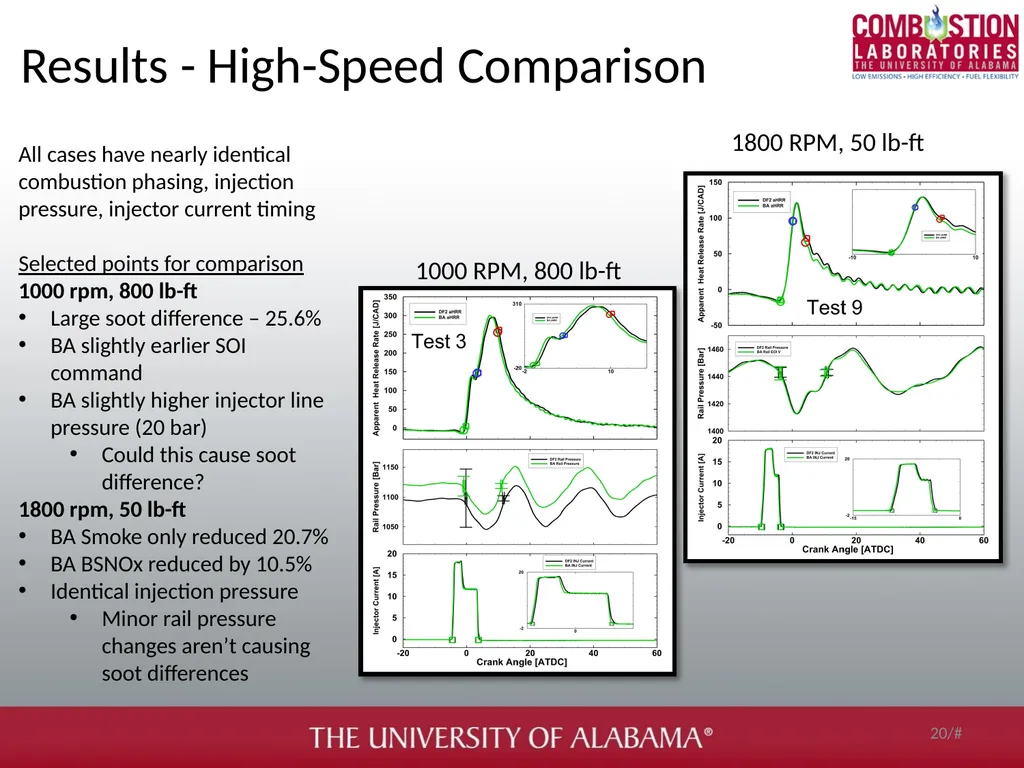
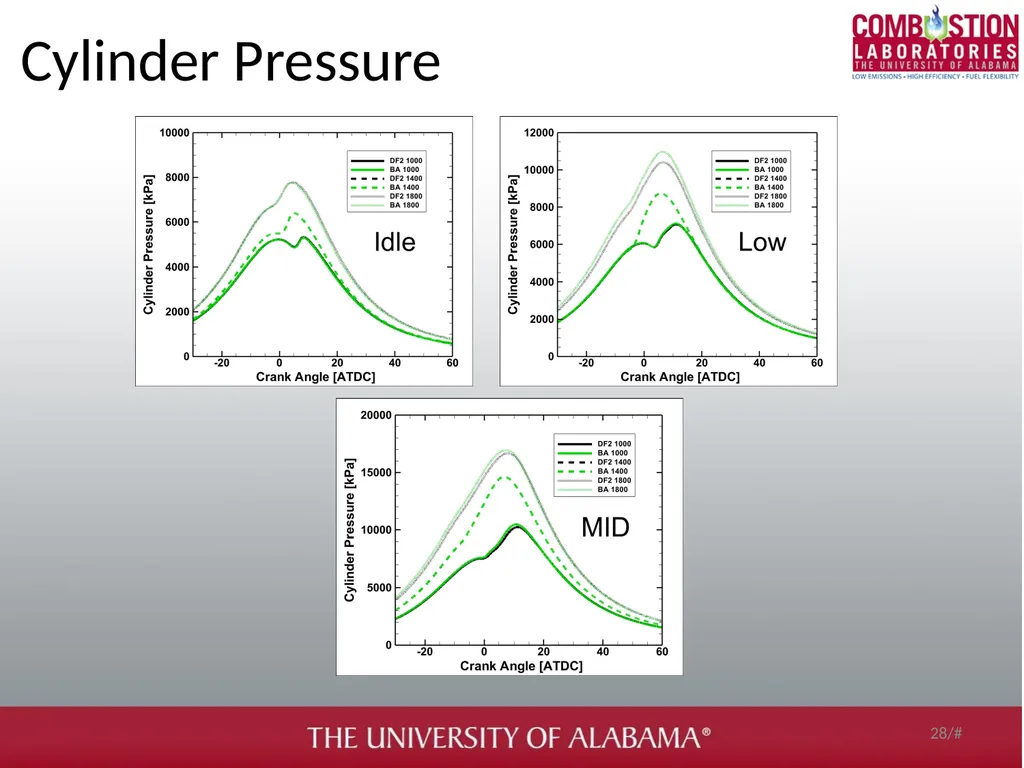
slide20. Results - High-Speed Comparison 20/# All cases have nearly identical combustion phasing, injection pressure, injector current timing
Selected points for comparison
1000 rpm, 800 lb-ft
Large soot difference – 25.6%
BA slightly earlier SOI command
BA slightly higher injector line pressure (20 bar)
Could this cause soot difference?
1800 rpm, 50 lb-ft
BA Smoke only reduced 20.7%
BA BSNOx reduced by 10.5%
Identical injection pressure
Minor rail pressure changes aren’t causing soot differences 1000 RPM, 800 lb-ft 1800 RPM, 50 lb-ft<br>
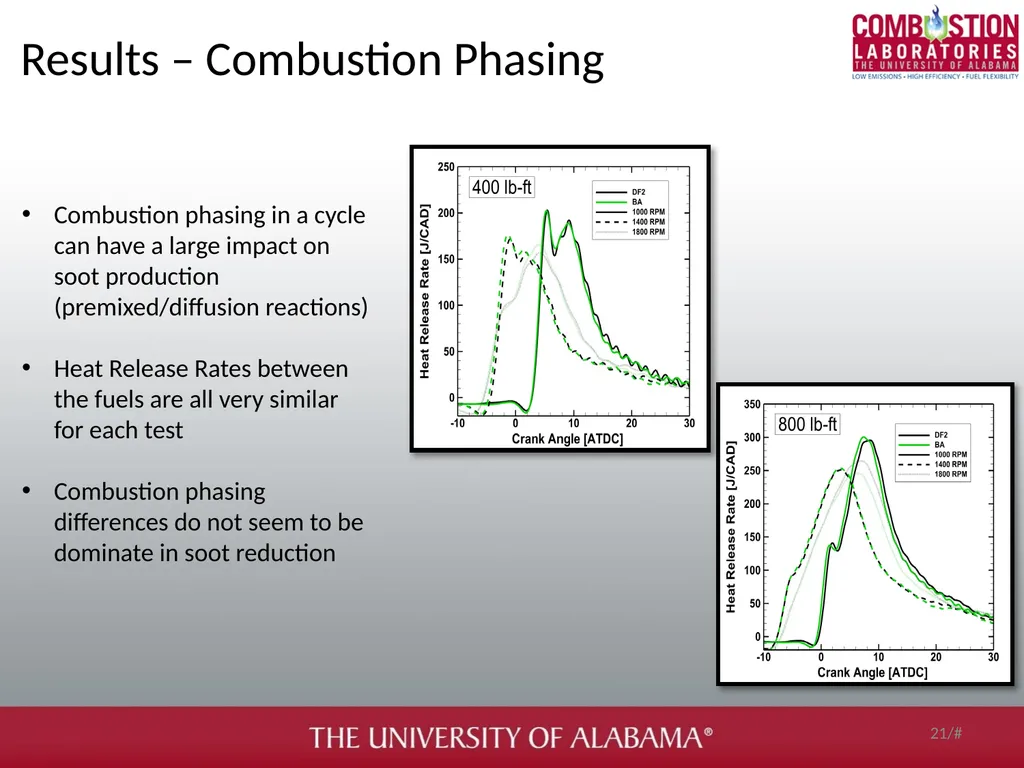
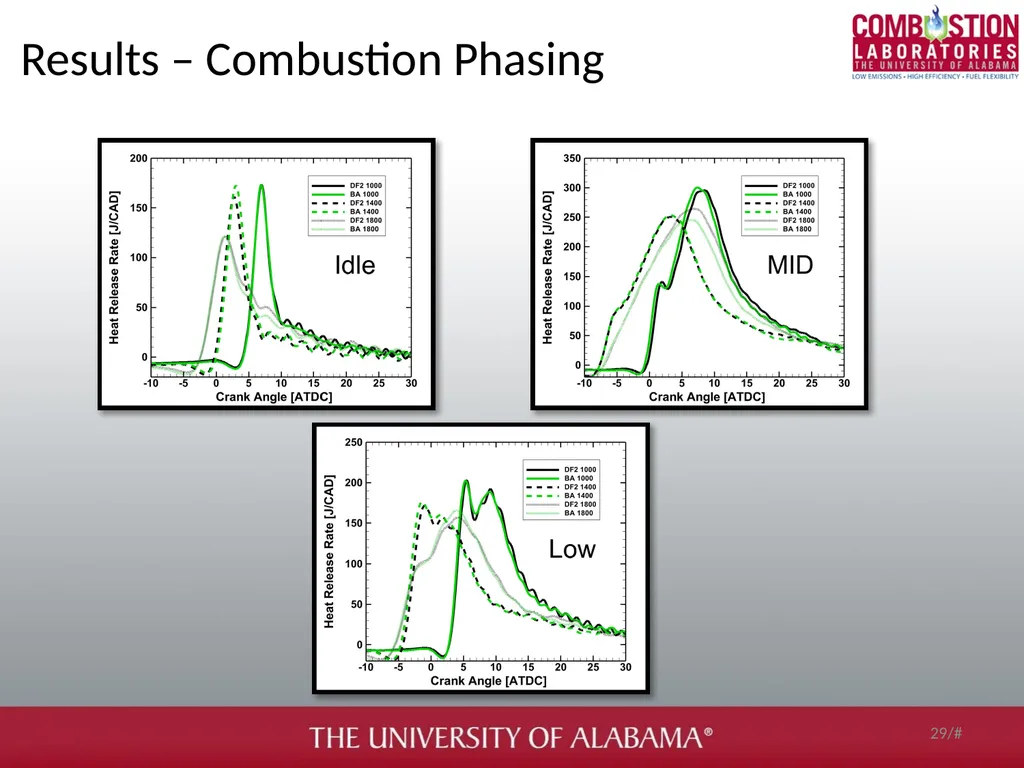
slide21. Results – Combustion Phasing 21/# Combustion phasing in a cycle can have a large impact on soot production (premixed/diffusion reactions)
Heat Release Rates between the fuels are all very similar for each test
Combustion phasing differences do not seem to be dominate in soot reduction<br>
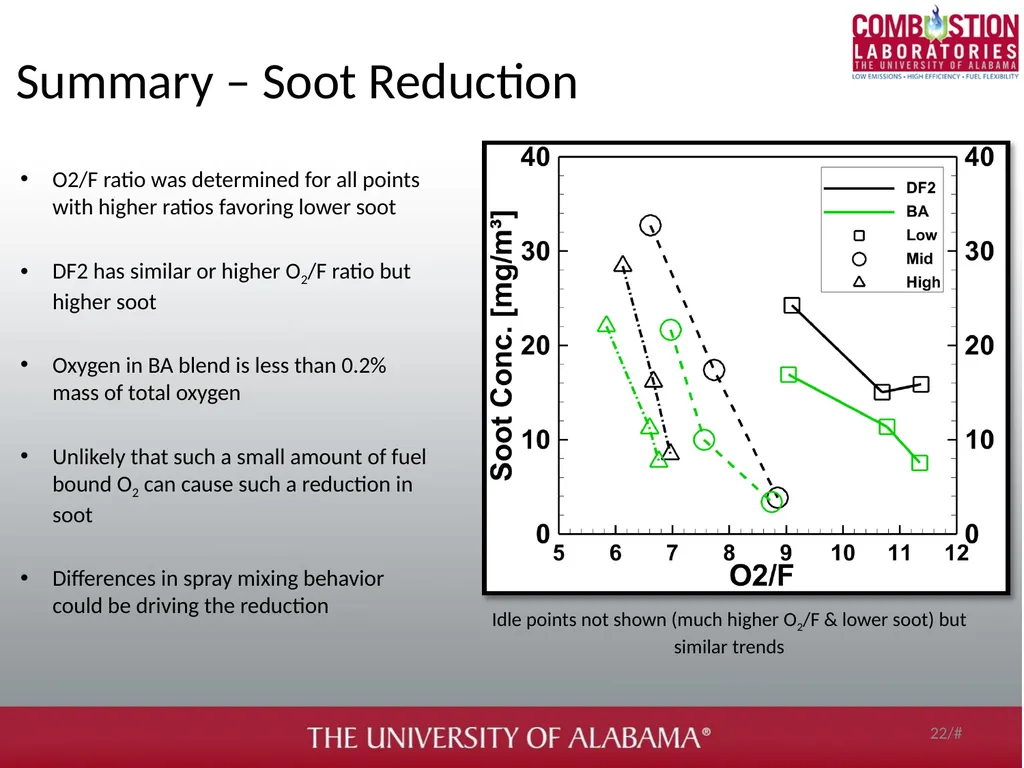
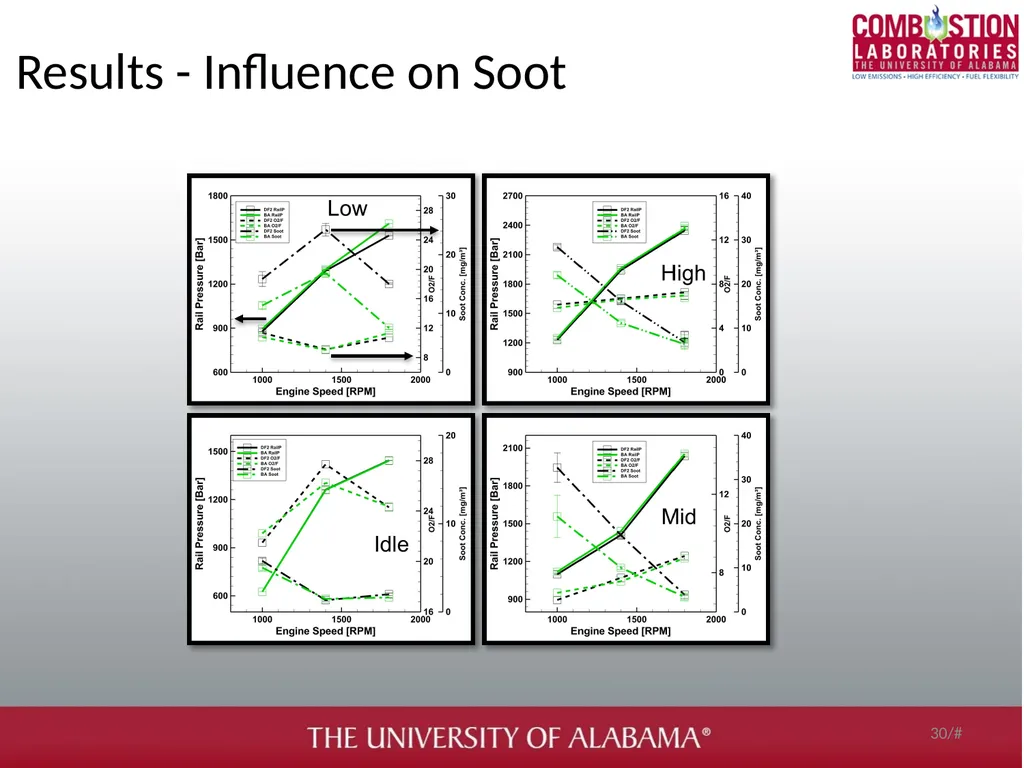
slide22. Summary – Soot Reduction 22/# O2/F ratio was determined for all points with higher ratios favoring lower soot
DF2 has similar or higher O2/F ratio but higher soot
Oxygen in BA blend is less than 0.2% mass of total oxygen
Unlikely that such a small amount of fuel bound O2 can cause such a reduction in soot
Differences in spray mixing behavior could be driving the reduction Idle points not shown (much higher O2/F & lower soot) but similar trends<br>
slide23. Conclusion 23/# 5% by volume blend of Butyl-Acetate in DF2 was tested across the engine operating range using a stock ECU with negligible differences.
Minimal changes to performance (efficiency, combustion phasing, etc.)
Soot reduced by roughly 30% while BSNOx increased by only 3.5%
Global O2/F ratio trend doesn’t match soot behavior, and with matched combustion phasing
Improved mixing, further aided by local oxygenation likely driving soot reduction
Butyl Acetate reduces soot without significant negative impacts<br>
slide24. 24/# Acknowledgements Thank you for your attention. Questions? This material is based upon work supported by the U.S. Department
of Energy’s Office of Energy Efficiency and Renewable Energy
(EERE) under the Vehicle Technologies Office (VTO) and Bioenergy
Technologies Office (BETO) as part of the Co-Optimization of Fuels
& Engines program and award number DE-EE0008483. The views
expressed herein do not necessarily represent the views of the U.S.
Department of Energy or the United States Government.<br>
slide25. Figure References [1] Rakopoulos, C. D., et al. "Comparative performance and emissions study of a direct injection diesel engine using blends of diesel fuel with vegetable oils or bio-diesels of various origins." Energy conversion and management 47.18-19 (2006): 3272-3287.
[2] McCormick, Robert L., Jeffrey D. Ross, and Michael S. Graboski. "Effect of several oxygenates on regulated emissions from heavy-duty diesel engines." Environmental Science & Technology 31.4 (1997): 1144-1150.
[3] Co-Optimization of Fuels & Engines Year in Review (FY20). United States: N. p., 2021. Web. doi:10.2172/1782424.
[4] Wang, Yujie, et al. "Combustion of n-butyl acetate synthesized by a new and sustainable biological process and comparisons with an ultrapure commercial n-butyl acetate produced by conventional Fischer esterification." Fuel 304 (2021): 121324.
[5] U.S. Department of Energy. “Fuel Properties Database.” Available at at https://www.nrel.gov/transportation/ fuels-properties-database/ (Accessed 10/10/2022).
[6] McCormick, Robert L., and Richard Parish. "Advanced petroleum based fuels program and renewable diesel program." NREL/MP (2001): 540-32674.
[7] Kumar, B. Rajesh, and S. Saravanan. "Use of higher alcohol biofuels in diesel engines: A review." Renewable and Sustainable Energy Reviews 60 (2016): 84-115. 25/#<br>
slide26. Injector Current 26/#<br>
slide27. Rail Pressure 27/#<br>
slide28. Cylinder Pressure 28/#<br>
slide29. Results – Combustion Phasing 29/#<br>
slide30. Results - Influence on Soot 30/#<br>
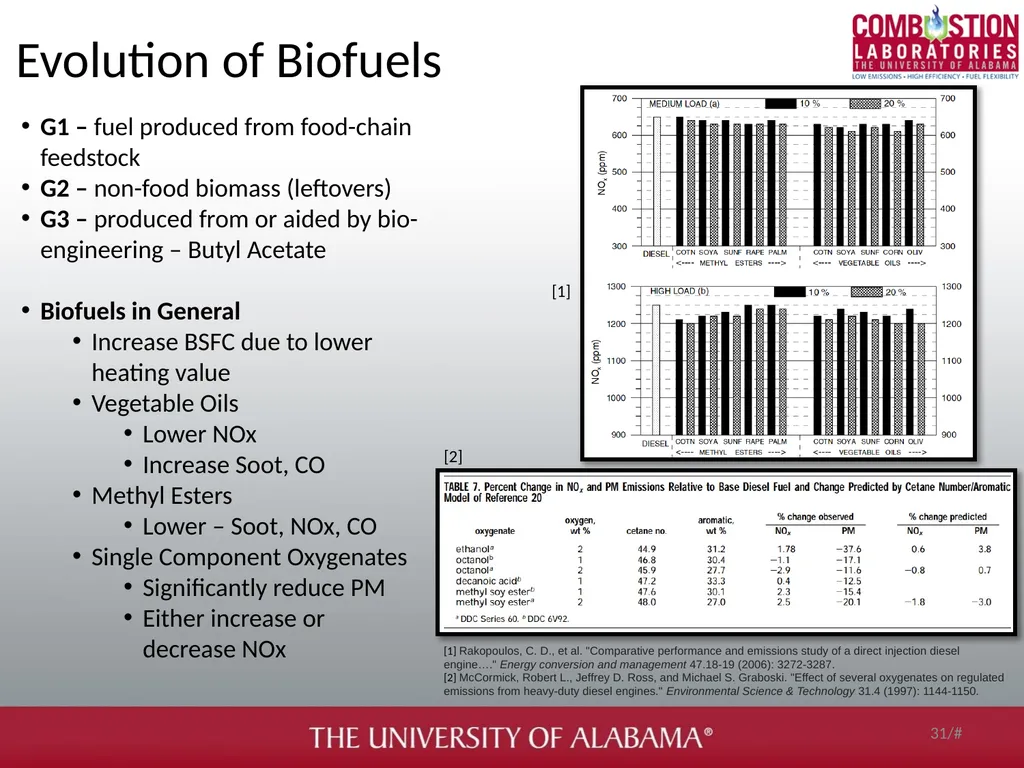
slide31. Evolution of Biofuels 31/# [1] Rakopoulos, C. D., et al. "Comparative performance and emissions study of a direct injection diesel engine…." Energy conversion and management 47.18-19 (2006): 3272-3287.
[2] McCormick, Robert L., Jeffrey D. Ross, and Michael S. Graboski. "Effect of several oxygenates on regulated emissions from heavy-duty diesel engines." Environmental Science & Technology 31.4 (1997): 1144-1150. [2] G1 – fuel produced from food-chain feedstock
G2 – non-food biomass (leftovers)
G3 – produced from or aided by bio-engineering – Butyl Acetate
Biofuels in General
Increase BSFC due to lower heating value
Vegetable Oils
Lower NOx
Increase Soot, CO
Methyl Esters
Lower – Soot, NOx, CO
Single Component Oxygenates
Significantly reduce PM
Either increase or decrease NOx [1]<br>
slide2. Outline 2/# Background
Objectives
Experimental setup
Data Processing Methods
Test conditions
Results<br>
slide3. DOE Co-Optima Project 3/# [3] Improving MD and HD Diesel Engines
Engine efficiency
Maintain fuel density
Lower Emissions
Combustion Mode
MCCI – mixing-controlled compression ignition
Goal – identify new blendstocks & engine technology
Improve economic and environmental impacts
Tier 1 screening [3]
8 possible biofuels
Blended at 30% by vol.
Reduced NOx and Soot Emissions [3] Co-Optimization of Fuels & Engines Year in Review (FY20). United States: N. p., 2021. Web. doi:10.2172/1782424.<br>
slide4. Butyl Acetate for MCCI Operation 4/# Not obvious choice for drop in blending with due to low cetane (~20)
Advantages of Butyl Acetate
Improved cold flow performance
High O to C ratio
Impact on ignition characteristics
no reactivity between lubricants and oxygenates [3]
Conventionally produced by Fischer esterification process
Purity of 99.9%
Consumes relatively large amounts of energy
Produces toxic waste - sulfuric acid
New microbial fermentation process [4]
Systematic genome engineered - C.saccharoperbutylacetonicum FJ-1201 bacteria
Uses monosugars (glucose...etc) from biomass in batch fermentation – High Yield
Synthesized by a new and sustainable biological process
Contain some miscible by-products
Influence of those components investigated by ICEF2022-90634 & [4] [4] Wang, Yujie, et al. "Combustion of n-butyl acetate synthesized by a new and sustainable biological process and comparisons with an ultrapure commercial n-butyl acetate produced by conventional Fischer esterification." Fuel 304 (2021): 121324.
[5] U.S. Department of Energy. “Fuel Properties Database.” Available at at https://www.nrel.gov/transportation/ fuels-properties-database/ (Accessed 10/10/2022).
[6] McCormick, Robert L., and Richard Parish. "Advanced petroleum based fuels program and renewable diesel program." NREL/MP (2001): 540-32674.
[7] Kumar, B. Rajesh, and S. Saravanan. "Use of higher alcohol biofuels in diesel engines: A review." Renewable and Sustainable Energy Reviews 60 (2016): 84-115. [5,6,7]<br>
slide5. Optical Studies in Spray Chamber 5/# Prior results* from Optically Accessible Spray Chamber found significant reduction in soot mass with BA blend at 20% by vol.
20% BA Blend
Increased ignition delay
Shorter liquid length
Longer lift-off length
Cannot de-couple increased air entrainment from longer ignition delay and lift-off length from any effect of fuel bound oxygen Delayed Ignition Longer Lift-Off Reduced Soot *Stevenson, A, et al. "Sooting Behavior of Commercial and Bio-Derived Butyl-Acetate/N-Heptane Blends in High-Pressure Spray Combustion Experiments." Proceedings of the ASME 2022 ICE Forward Conference. https://doi.org/10.1115/ICEF2022-90634<br>
slide6. Objectives Test BA blend as drop-in blend at 5% by vol HDD
Compare Engine Performance between fuels
Soot Emissions
Efficiency & Performance
Emissions & Combustion
Investigate how engine ECU responds to different fuel
Identify potential benefits and drawbacks to BA and why it performs differently 6/#<br>
slide7. Experimental setup – Engine 7/# Variable Geometry Turbocharger
Cooled EGR
3000 bar injection pressure
Stock ECU
Except modified to run without aftertreatment Cummins ISX15 450ST
450 hp at 1800 rpm
1800 lb-ft at 1000 rpm<br>
slide8. Experimental setup – Test Cell 8/# 5 – Gas Emissions Bench
AVL 415s Smoke Meter
Fuel Cart – Coriolis Flow meter
Data Acquisition through LabVIEW/National Instruments hardware
Vieletech Combustion Analysis Toolkit
Slow Speed (1 or 10 Hz)
High Speed (200 kHz)
Dynamic Pressure measurements (Kistler)
Cylinder Pressure
Intake Manifold
Exhaust Manifold
Injector Line<br>
slide9. Post Processing -Filtering, Aligning, and Pegging 9/# High-Speed Raw TDMS files post-processed in Python
HS Filter in the time domain
Butterworth
Lowpass, 2nd
2.8kHz Cutoff
Aligned and converted to CAD from A and Z pulse time stamps
Cylinder pressure pegged at IVC with dynamic intake manifold pressure<br>
slide10. Combustion Calculations and Injection Parameters 10/# Estimating Actual Start/End of Injection
No needle lift sensor, but use line dynamic pressure
Injector Line Pressure Dynamics are very repeatable
Injector Current SOI initial starting point
Actual SOI/EOI estimated by rising/falling pressure crossing average pressure
Rail SOI & EOI more representative of actual injection than current but sensitive to rail pressure fluctuations
Ign. Delay = SOIact – CA10
Inj. Dwell = EOIact – CA10
Max IMEPn CoV 2.9%, Avg IMEPn CoV ≈ 1%<br>
slide11. Test Conditions 11/# Drop-in fuel at 5% by vol.
OEM ECU
Only control speed & pedal
Dyno controlled speed
Virtual Pedal Torque Control
13 Test points
Low, mid, high speed and torque
Also, tested Peak Power
1800 RPM & Max Pedal
Power reduced by 1.24% but only used 0.67% more fuel<br>
slide12. Results - ECU Parameters – Air Control 12/# Comparison of ECU Setpoints for MAP, VGT, and EGR
Average Difference
MAP – 1.2%
VGT Pos.– 3.5%
EGR Pos.– 8.5%
EGR Valve has the most variation
MAP and VGT correlate as expected
Higher MAP requires less EGR Valve position
1800 rpm, 400 lb-ft only condition seems to be at different setpoint in ECU Manifold Pressure
[abs, kPa] VGT Position
% Closed EGR Position
% Open Relative Diff. [%] BA DF2<br>
slide13. Results - ECU Parameters – Fuel Control 13/# Comparison of setpoints for Rail pressure, fuel command, and actual fuel flow rate
Average Difference
Rail – 1%
Fuel Cmd – -9%
Fuel Flow – 3%
Again 1800 rpm, 400 lb-ft seems to be different setpoint
Fuel command differs by up to 43% but little difference in flow rate… cause unclear
May expect BA to be higher fuel command by 2% due to LHV difference
Fuel flow difference approaches LHV difference near peak power Rail Pressure
[bar] ECU Fuel Cmd.
[kg/hr] Fuel Meas.
[kg/hr] Relative Diff. [%] DF2 BA Rail Pressure
[bar] ECU Fuel Cmd.
[kg/hr] Fuel Meas.
[kg/hr]<br>
slide14. Results - Performance Comparison 14/# Comparison of efficiency metrics
Average Difference
BSFC – 4%
IFCE – -5.5%
Idle and Low load show largest difference
At higher loads and speeds fuels show smaller difference
May expect BA to be higher fuel command by 2% due to LHV difference Net Indicated Fuel Conversion Efficiency [%] Brake Specific Fuel Consumption [g/kWh] Relative Diff. [%] DF2 BA<br>
slide15. Results - Soot Concentration 15/# AVL 415S Smoke Meter
FSN converted to mg/m3 per AVL method
Soot is reduced with BA compared to DF2 at all but one idle point
FSN 0.097 and 0.107 DF2 and BA
Soot Conc. [mg/m³] 1.31 and 1.46
Fall within repeatability of Smoke meter
Soot Conc. [mg/m³] is reduced by an average of about 30%
Soot generally reduces as speed increasing<br>
slide16. Results - Influence on Soot 16/#<br>
slide17. Summary:
Brake Specific NOx worst at idle
NOx is best at high speed and idle (BA slightly better)
BA significantly lowers soot concentrations than DF2
BA Blend:
Avg Soot dropped 30%
Avg BSNOX increased 3.5% Results - Emissions 17/# Brake Specific NOx [g/kWh] Soot Concentration [mg/m3] Relative Diff. [%] DF2 BA<br>
slide18. Summary:
BA Blend slightly reduces HC emissions
Largest improvement in HC is at slow speed
BA reduces CO emissions except for two idle points
BA Blend on average
Decreases BSHC by 6%
Decreases BSCO by 8.2% Results - Emissions Cont. 18/# Brake Specific THC [g/kWh] Brake Specific CO [g/kWh] Relative Diff. [%] DF2 BA<br>
slide19. Ign. Delay = SOIact – CA10
Inj. Dwell = EOIact – CA10
More dwell indicates more injection/combustion overlap
Increase with load and speed
Delay Behavior
BA Blend slight increase for most points
Most differences fall within the repeatability
Dwell Behavior
Virtually same
Differences are very minor as SOI, EOI and aHRR are very similar
Summary:
If differences observed it could impact soot, but no clear trends Results - Ignition Characteristics 19/# Injection Dwell Time [ms] Ignition Delay [ms] Relative Diff. [%] DF2 BA<br>
slide20. Results - High-Speed Comparison 20/# All cases have nearly identical combustion phasing, injection pressure, injector current timing
Selected points for comparison
1000 rpm, 800 lb-ft
Large soot difference – 25.6%
BA slightly earlier SOI command
BA slightly higher injector line pressure (20 bar)
Could this cause soot difference?
1800 rpm, 50 lb-ft
BA Smoke only reduced 20.7%
BA BSNOx reduced by 10.5%
Identical injection pressure
Minor rail pressure changes aren’t causing soot differences 1000 RPM, 800 lb-ft 1800 RPM, 50 lb-ft<br>
slide21. Results – Combustion Phasing 21/# Combustion phasing in a cycle can have a large impact on soot production (premixed/diffusion reactions)
Heat Release Rates between the fuels are all very similar for each test
Combustion phasing differences do not seem to be dominate in soot reduction<br>
slide22. Summary – Soot Reduction 22/# O2/F ratio was determined for all points with higher ratios favoring lower soot
DF2 has similar or higher O2/F ratio but higher soot
Oxygen in BA blend is less than 0.2% mass of total oxygen
Unlikely that such a small amount of fuel bound O2 can cause such a reduction in soot
Differences in spray mixing behavior could be driving the reduction Idle points not shown (much higher O2/F & lower soot) but similar trends<br>
slide23. Conclusion 23/# 5% by volume blend of Butyl-Acetate in DF2 was tested across the engine operating range using a stock ECU with negligible differences.
Minimal changes to performance (efficiency, combustion phasing, etc.)
Soot reduced by roughly 30% while BSNOx increased by only 3.5%
Global O2/F ratio trend doesn’t match soot behavior, and with matched combustion phasing
Improved mixing, further aided by local oxygenation likely driving soot reduction
Butyl Acetate reduces soot without significant negative impacts<br>
slide24. 24/# Acknowledgements Thank you for your attention. Questions? This material is based upon work supported by the U.S. Department
of Energy’s Office of Energy Efficiency and Renewable Energy
(EERE) under the Vehicle Technologies Office (VTO) and Bioenergy
Technologies Office (BETO) as part of the Co-Optimization of Fuels
& Engines program and award number DE-EE0008483. The views
expressed herein do not necessarily represent the views of the U.S.
Department of Energy or the United States Government.<br>
slide25. Figure References [1] Rakopoulos, C. D., et al. "Comparative performance and emissions study of a direct injection diesel engine using blends of diesel fuel with vegetable oils or bio-diesels of various origins." Energy conversion and management 47.18-19 (2006): 3272-3287.
[2] McCormick, Robert L., Jeffrey D. Ross, and Michael S. Graboski. "Effect of several oxygenates on regulated emissions from heavy-duty diesel engines." Environmental Science & Technology 31.4 (1997): 1144-1150.
[3] Co-Optimization of Fuels & Engines Year in Review (FY20). United States: N. p., 2021. Web. doi:10.2172/1782424.
[4] Wang, Yujie, et al. "Combustion of n-butyl acetate synthesized by a new and sustainable biological process and comparisons with an ultrapure commercial n-butyl acetate produced by conventional Fischer esterification." Fuel 304 (2021): 121324.
[5] U.S. Department of Energy. “Fuel Properties Database.” Available at at https://www.nrel.gov/transportation/ fuels-properties-database/ (Accessed 10/10/2022).
[6] McCormick, Robert L., and Richard Parish. "Advanced petroleum based fuels program and renewable diesel program." NREL/MP (2001): 540-32674.
[7] Kumar, B. Rajesh, and S. Saravanan. "Use of higher alcohol biofuels in diesel engines: A review." Renewable and Sustainable Energy Reviews 60 (2016): 84-115. 25/#<br>
slide26. Injector Current 26/#<br>
slide27. Rail Pressure 27/#<br>
slide28. Cylinder Pressure 28/#<br>
slide29. Results – Combustion Phasing 29/#<br>
slide30. Results - Influence on Soot 30/#<br>
slide31. Evolution of Biofuels 31/# [1] Rakopoulos, C. D., et al. "Comparative performance and emissions study of a direct injection diesel engine…." Energy conversion and management 47.18-19 (2006): 3272-3287.
[2] McCormick, Robert L., Jeffrey D. Ross, and Michael S. Graboski. "Effect of several oxygenates on regulated emissions from heavy-duty diesel engines." Environmental Science & Technology 31.4 (1997): 1144-1150. [2] G1 – fuel produced from food-chain feedstock
G2 – non-food biomass (leftovers)
G3 – produced from or aided by bio-engineering – Butyl Acetate
Biofuels in General
Increase BSFC due to lower heating value
Vegetable Oils
Lower NOx
Increase Soot, CO
Methyl Esters
Lower – Soot, NOx, CO
Single Component Oxygenates
Significantly reduce PM
Either increase or decrease NOx [1]<br>