04
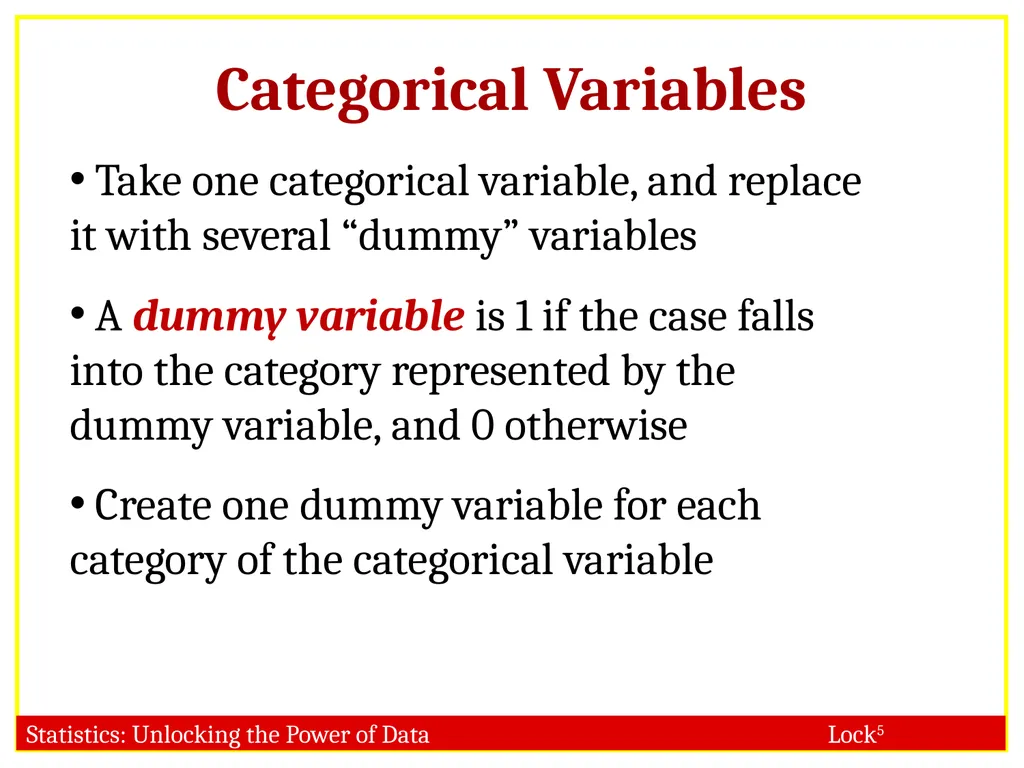
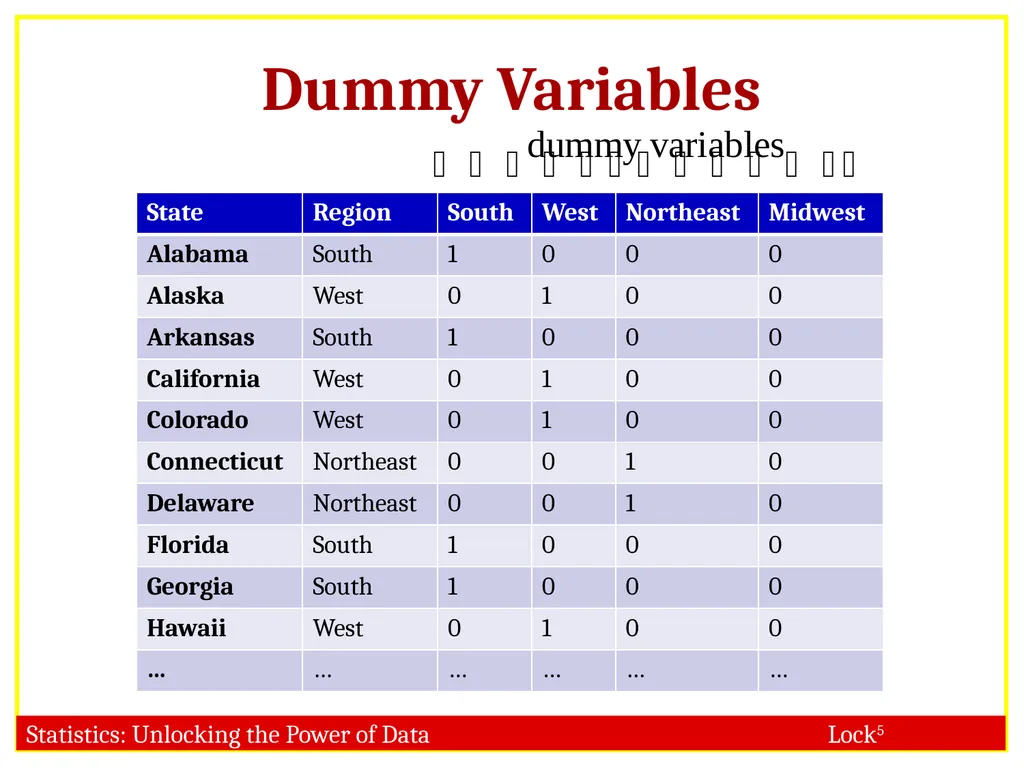
Categorical Variables Take one categorical variable, and replace it with several “dummy” variables
A dummy variable is 1 if the case falls into the category represented by the dummy variable, and 0 otherwise
Create one dummy variable for each category of the categorical variable<br>
06
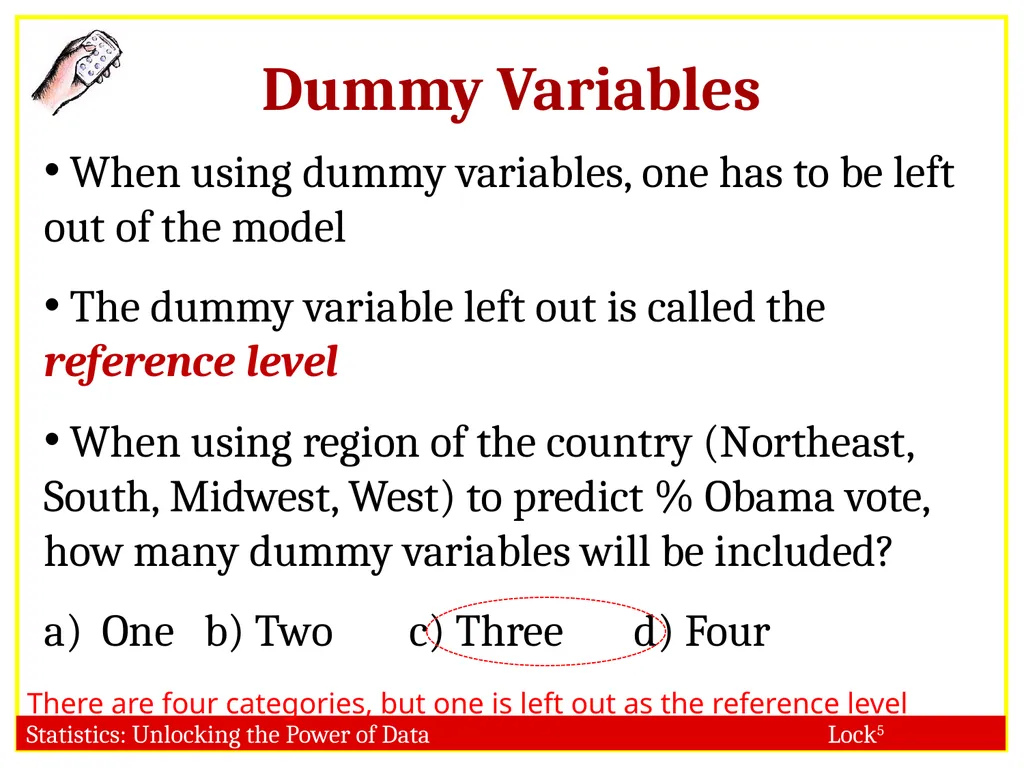
Dummy Variables When using dummy variables, one has to be left out of the model
The dummy variable left out is called the reference level
When using region of the country (Northeast, South, Midwest, West) to predict % Obama vote, how many dummy variables will be included?
One b) Two c) Three d) Four There are four categories, but one is left out as the reference level<br>
07
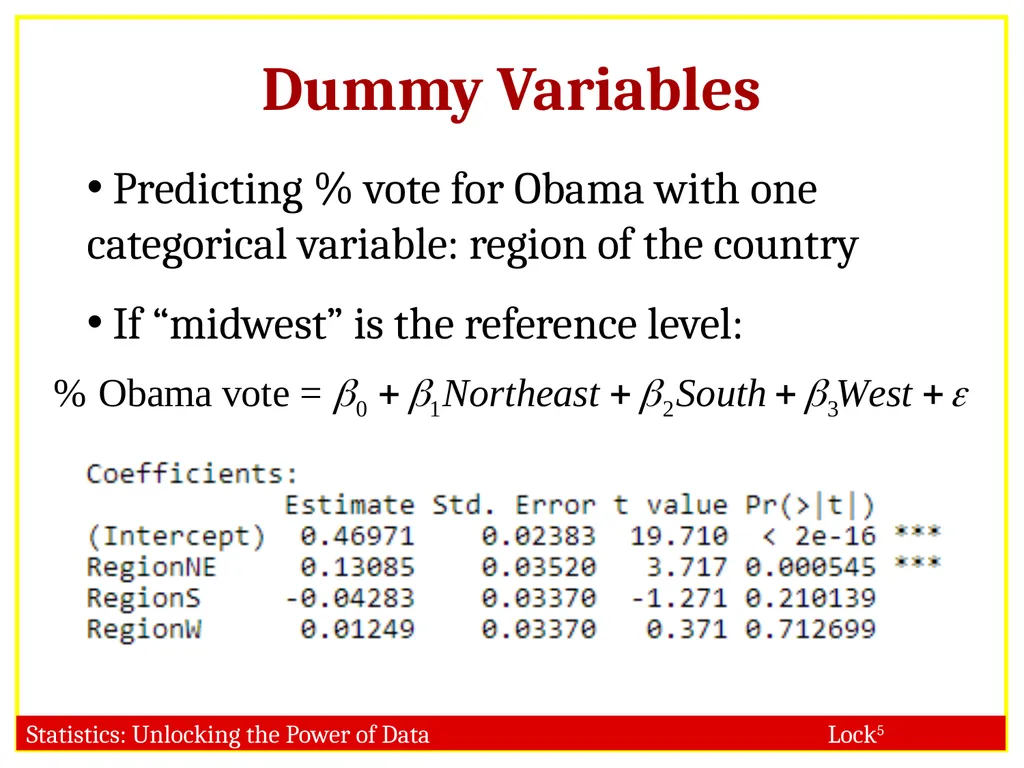
Dummy Variables Predicting % vote for Obama with one categorical variable: region of the country
If “midwest” is the reference level:<br>
08
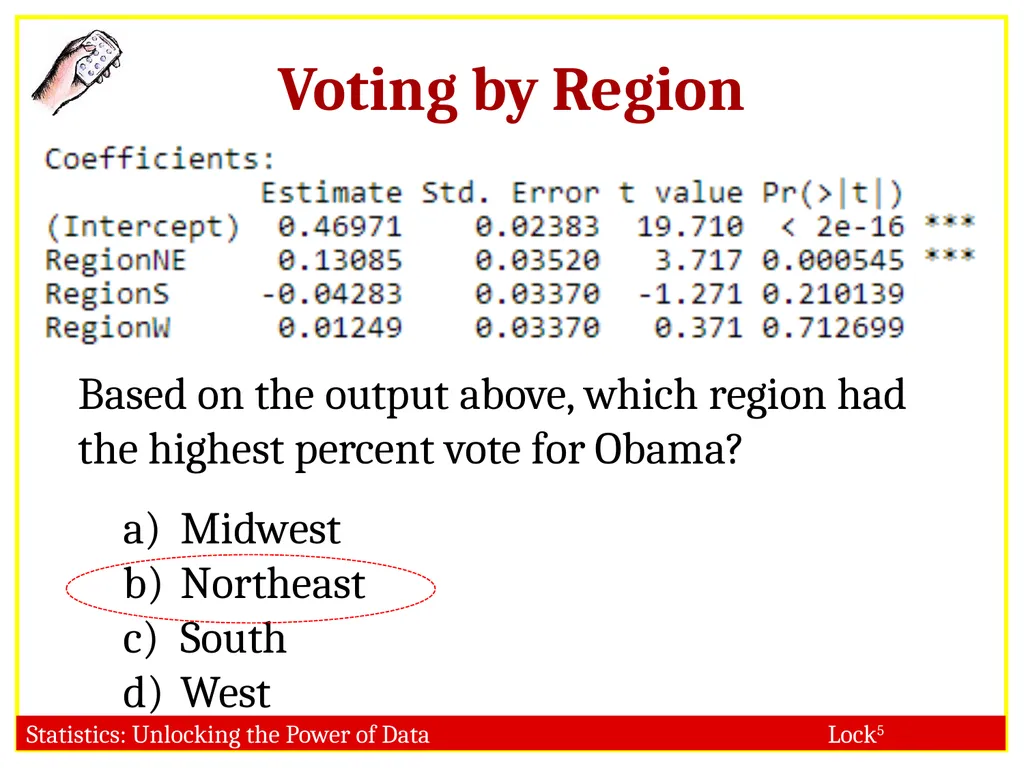
Voting by Region Based on the output above, which region had the highest percent vote for Obama?
Midwest
Northeast
South
West<br>
09
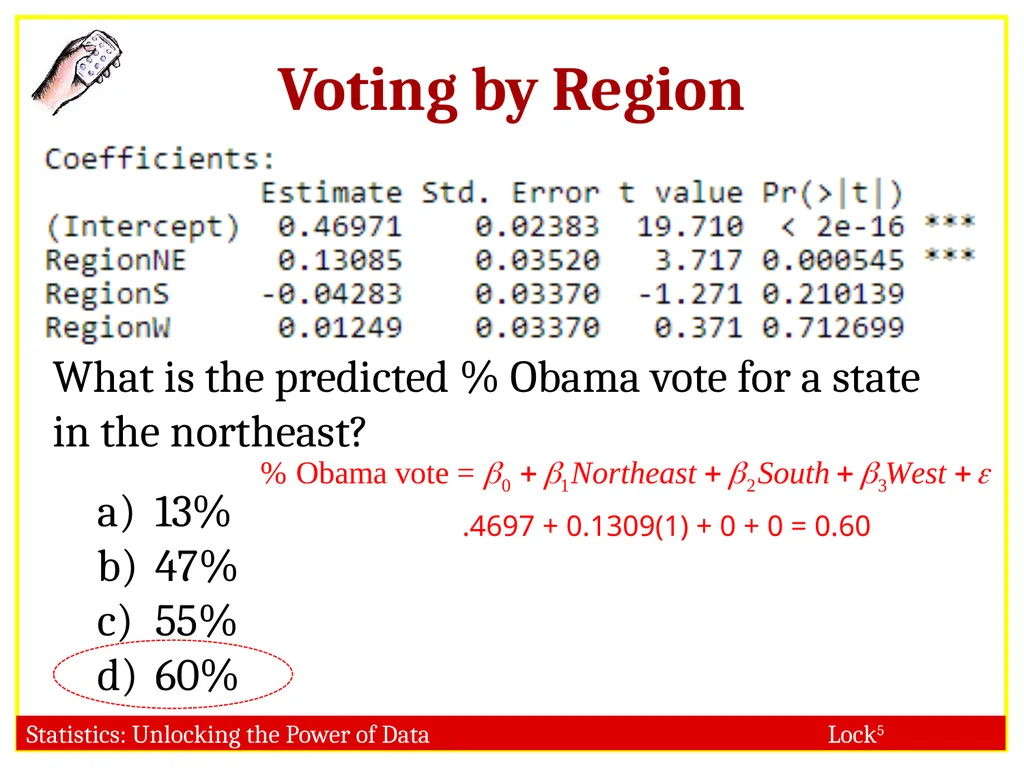
Voting by Region What is the predicted % Obama vote for a state in the northeast?
13%
47%
55%
60% .4697 + 0.1309(1) + 0 + 0 = 0.60<br>
10
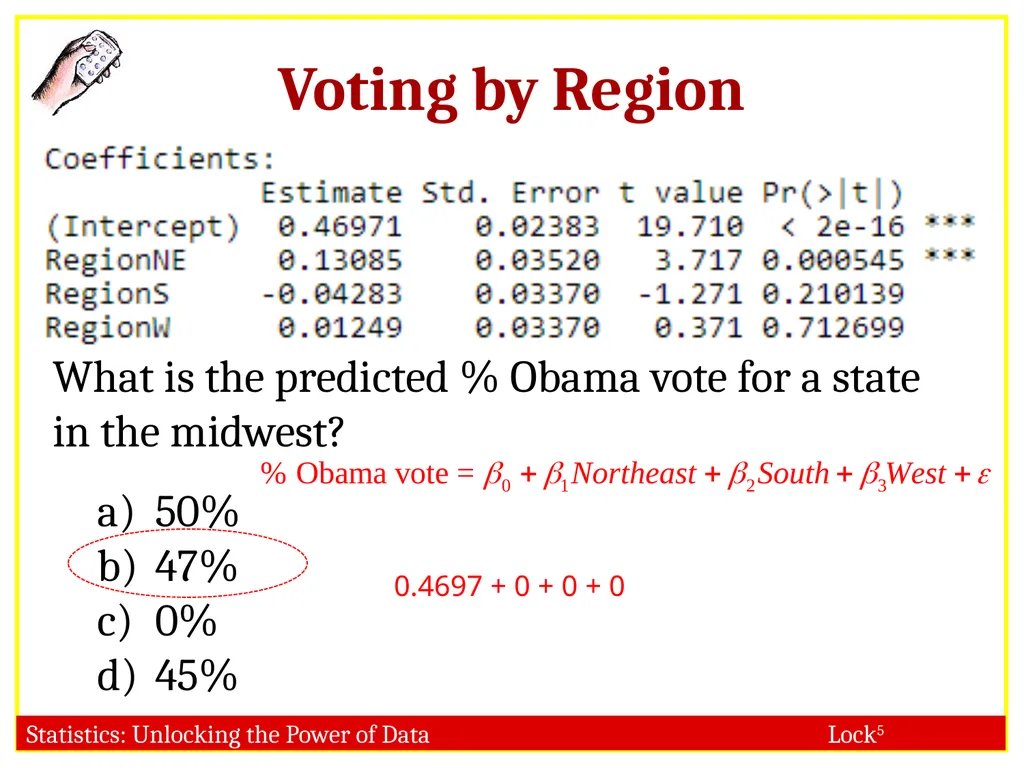
Voting by Region What is the predicted % Obama vote for a state in the midwest?
50%
47%
0%
45% 0.4697 + 0 + 0 + 0<br>
11
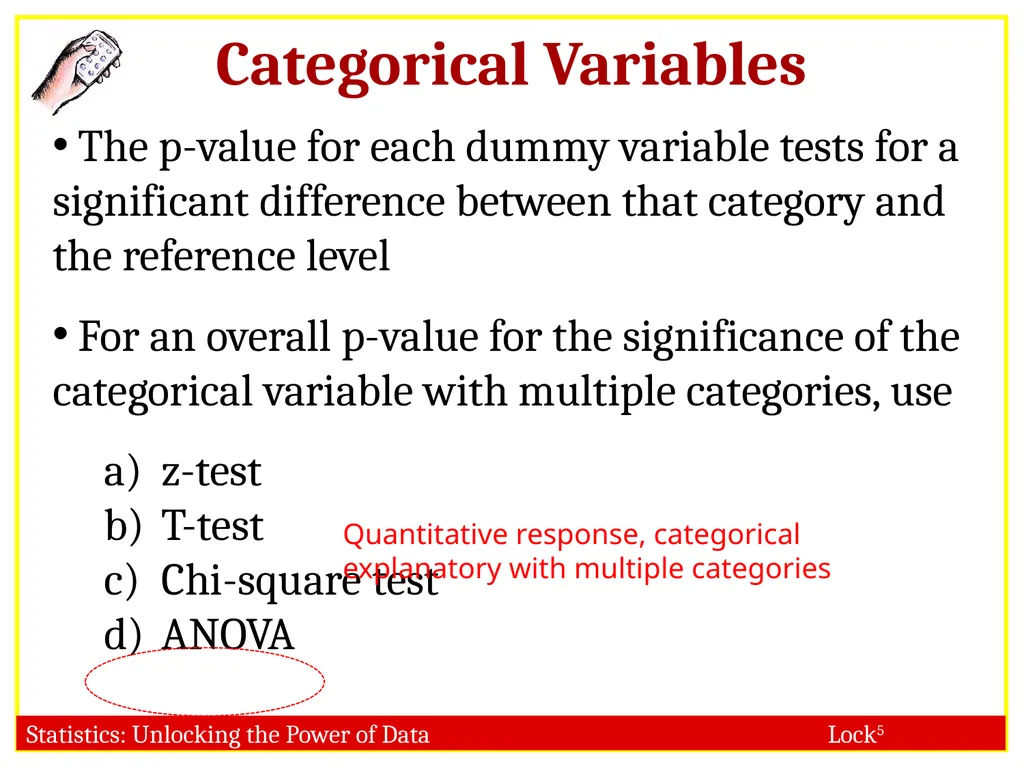
Categorical Variables The p-value for each dummy variable tests for a significant difference between that category and the reference level
For an overall p-value for the significance of the categorical variable with multiple categories, use
z-test
T-test
Chi-square test
ANOVA Quantitative response, categorical explanatory with multiple categories<br>
12
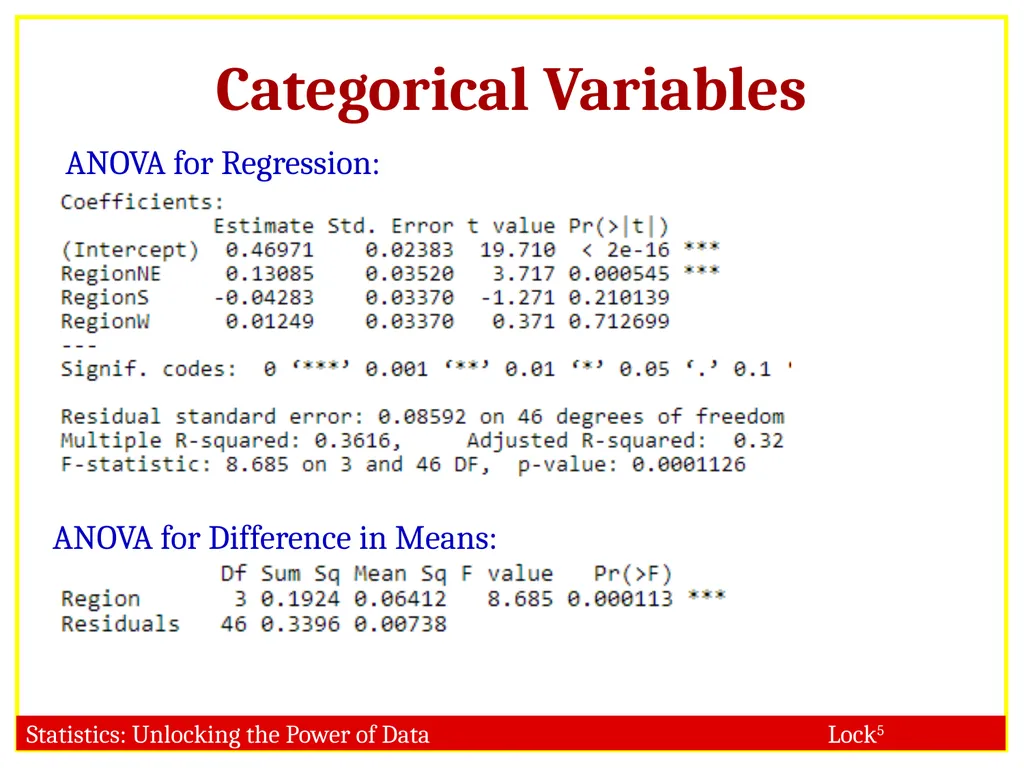
Categorical Variables ANOVA for Regression: ANOVA for Difference in Means:<br>
13
Categorical Variables in R R automatically creates dummy variables for you if you include a categorical explanatory variable
The first level alphabetically is usually the reference level
If you want to change the reference level, see me<br>
14
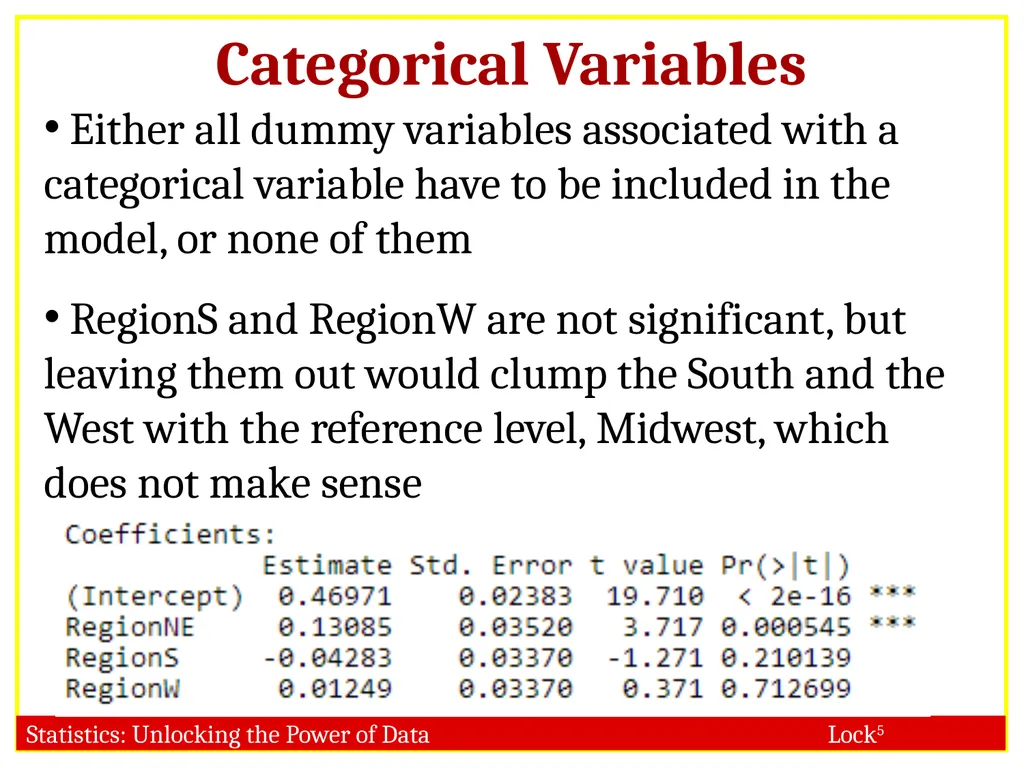
Categorical Variables Either all dummy variables associated with a categorical variable have to be included in the model, or none of them
RegionS and RegionW are not significant, but leaving them out would clump the South and the West with the reference level, Midwest, which does not make sense<br>
16
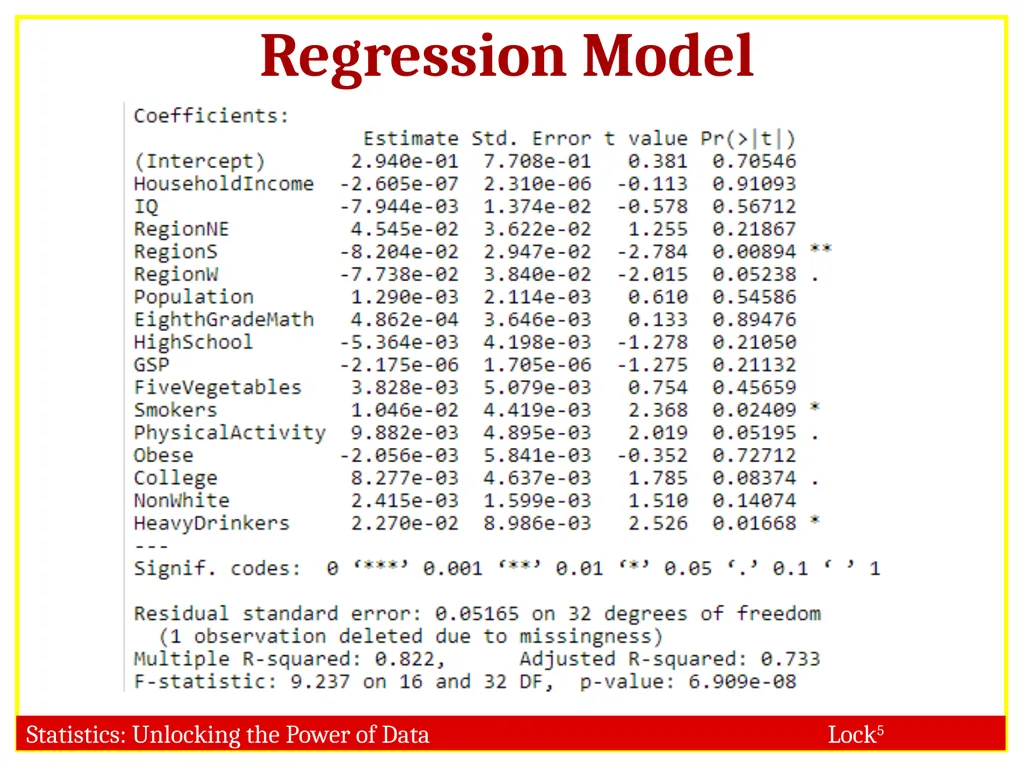
West Region With only region as an explanatory variable, interpret the positive coefficient of RegionW.
With all the other explanatory variables included, interpret the negative coefficient of RegionW. In this data set, states in the West voted more for Obama than states in the Midwest. States in the West voted less for Obama than would be expected based on the other variables in the model, as compared to states in the Midwest.<br>
17
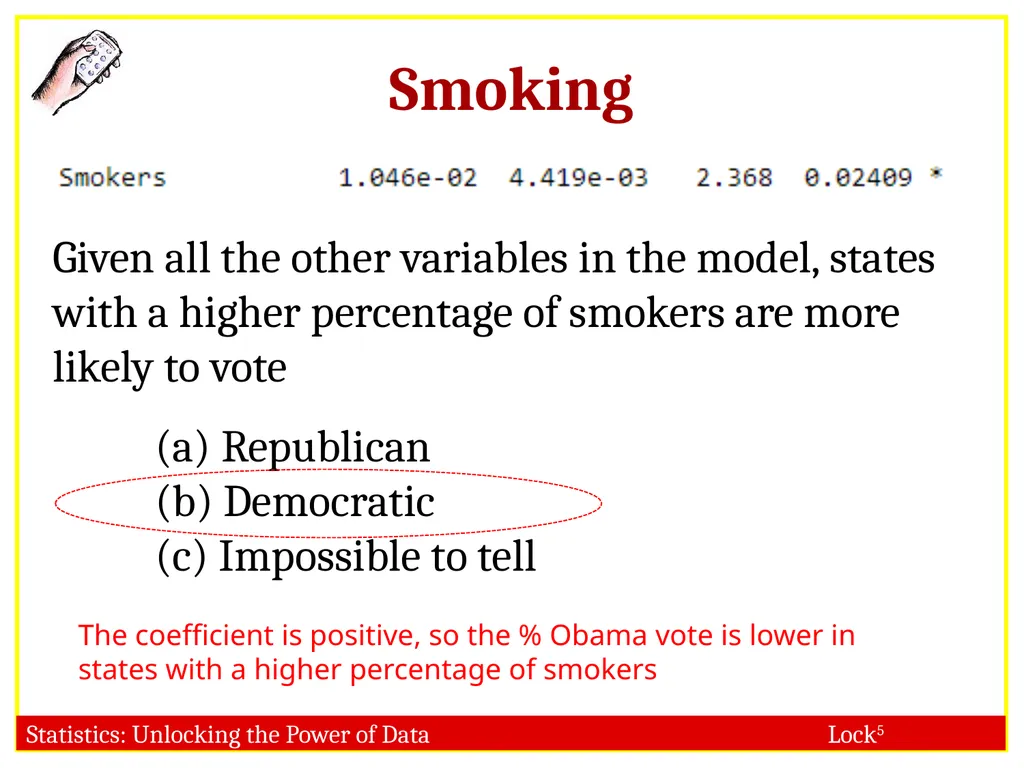
Smoking Given all the other variables in the model, states with a higher percentage of smokers are more likely to vote
(a) Republican
(b) Democratic
(c) Impossible to tell The coefficient is positive, so the % Obama vote is lower in states with a higher percentage of smokers<br>
18
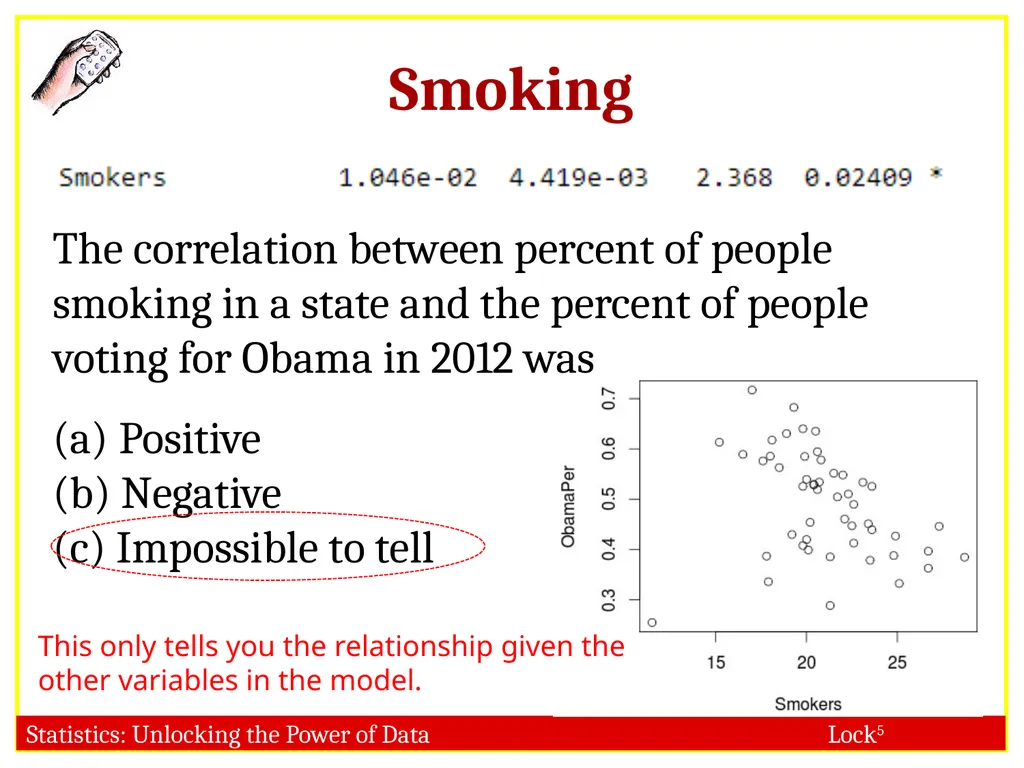
Smoking The correlation between percent of people smoking in a state and the percent of people voting for Obama in 2012 was
(a) Positive
(b) Negative
(c) Impossible to tell This only tells you the relationship given the other variables in the model.<br>
19
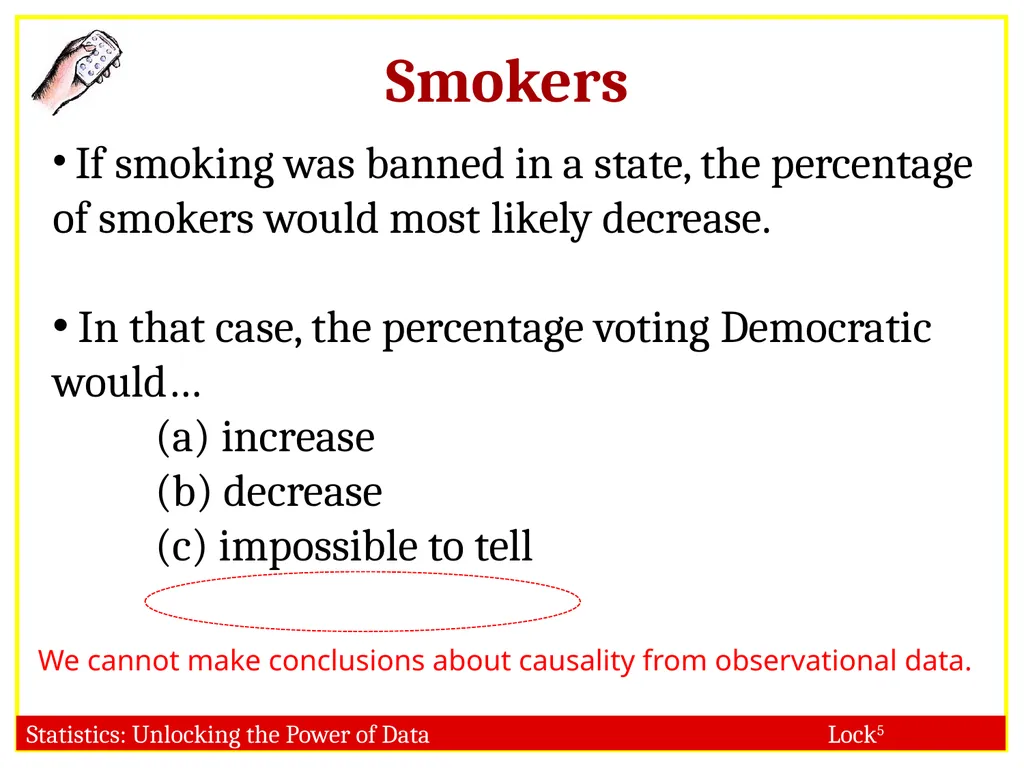
Smokers If smoking was banned in a state, the percentage of smokers would most likely decrease.
In that case, the percentage voting Democratic would…
(a) increase
(b) decrease
(c) impossible to tell We cannot make conclusions about causality from observational data.<br>
20
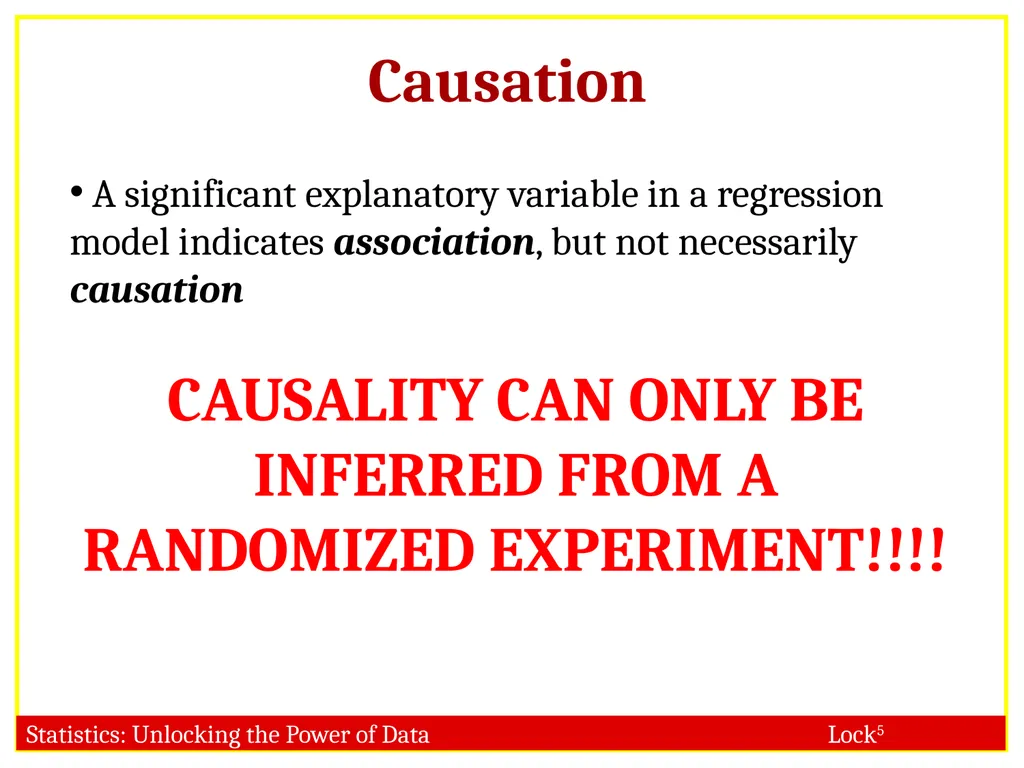
Causation A significant explanatory variable in a regression model indicates association, but not necessarily causation
CAUSALITY CAN ONLY BE INFERRED FROM A RANDOMIZED EXPERIMENT!!!!<br>
21
Goal of the Model? If the goal of the model is to see what and how each variable is associated with a state’s voting patterns, given all the other variables in the model, then we are done
If the goal is to predict the % of the vote that will be for the democrat, say in the 2016 election, we want to prune out insignificant variables to improve the model<br>
22
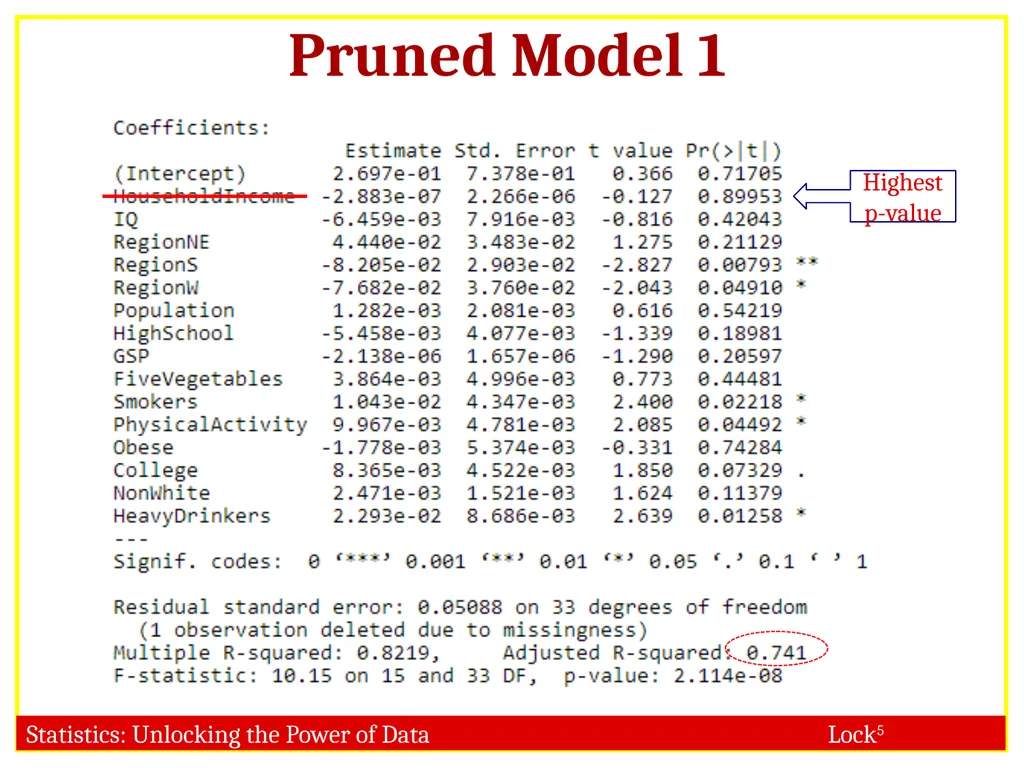
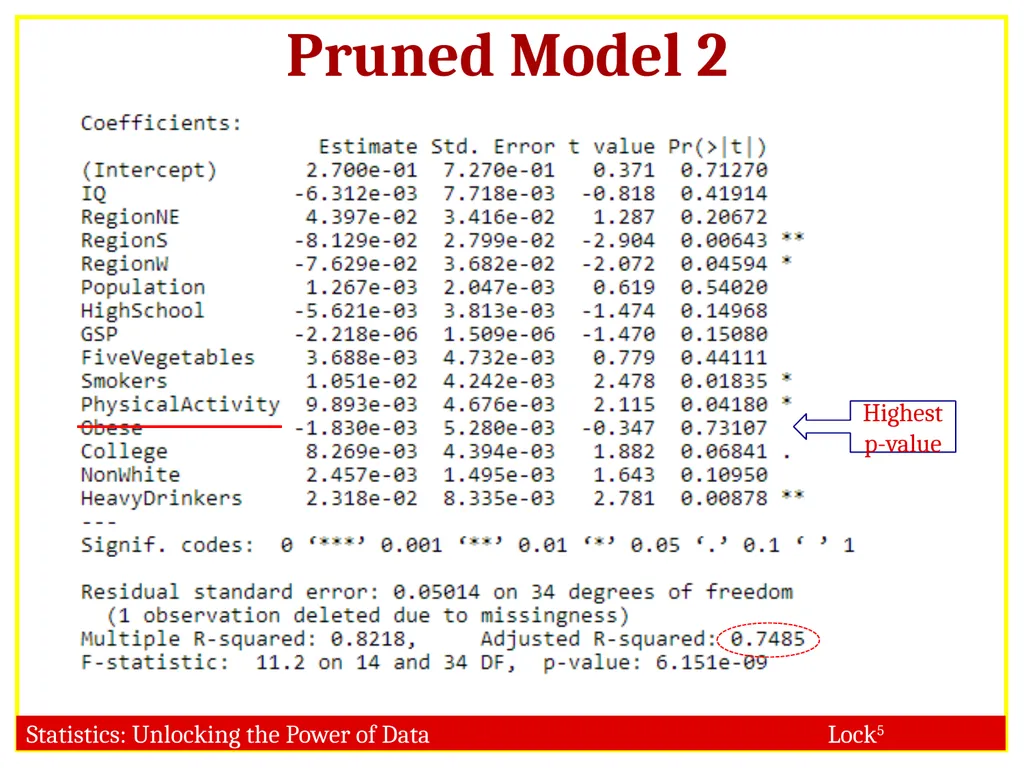
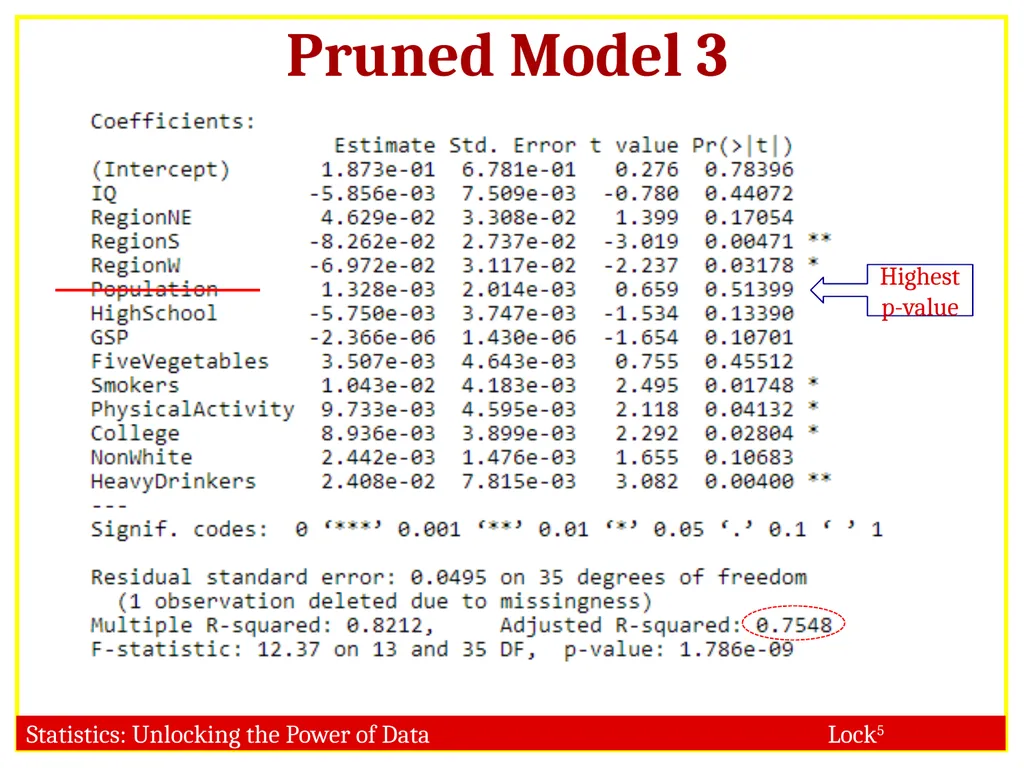
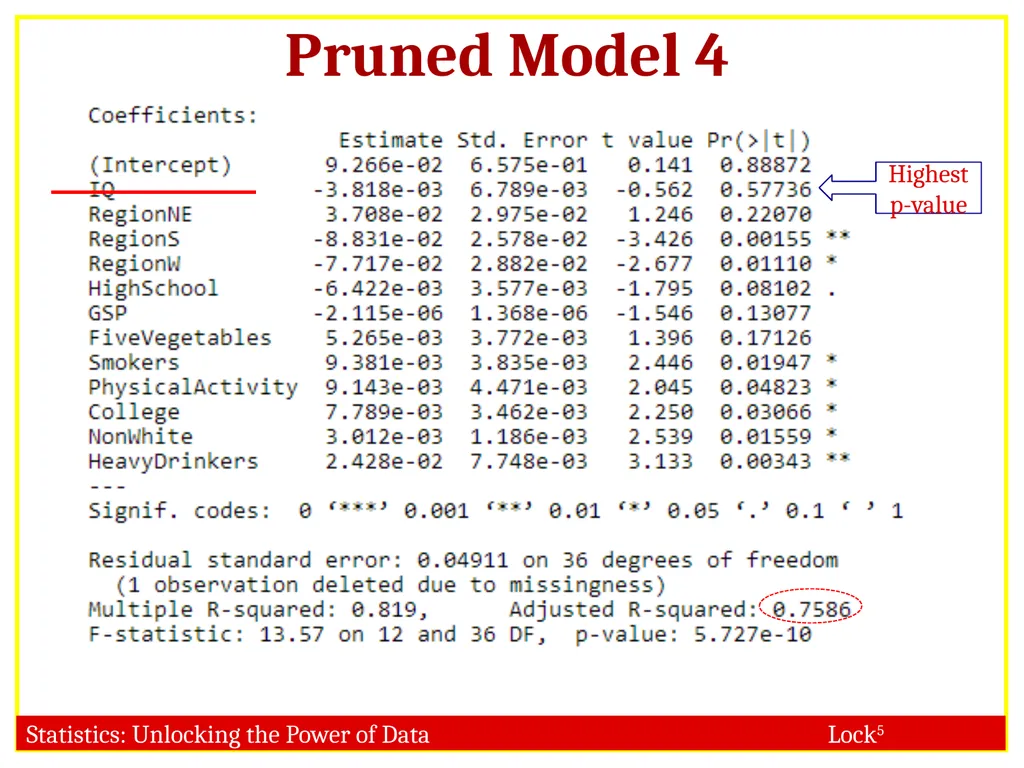
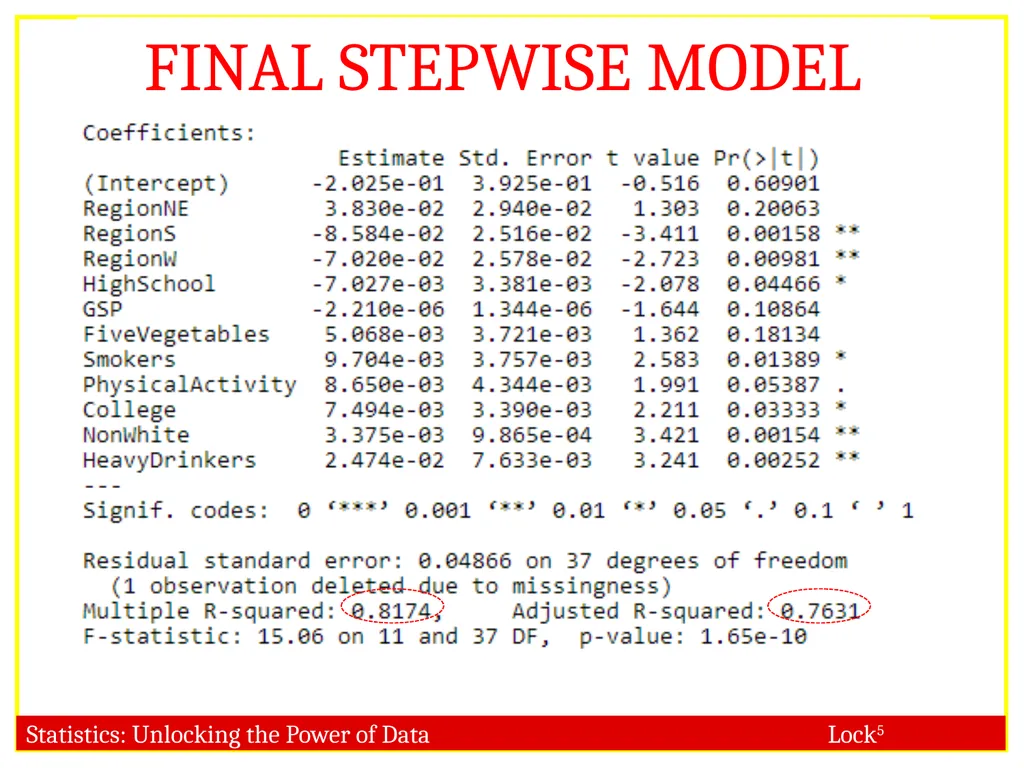
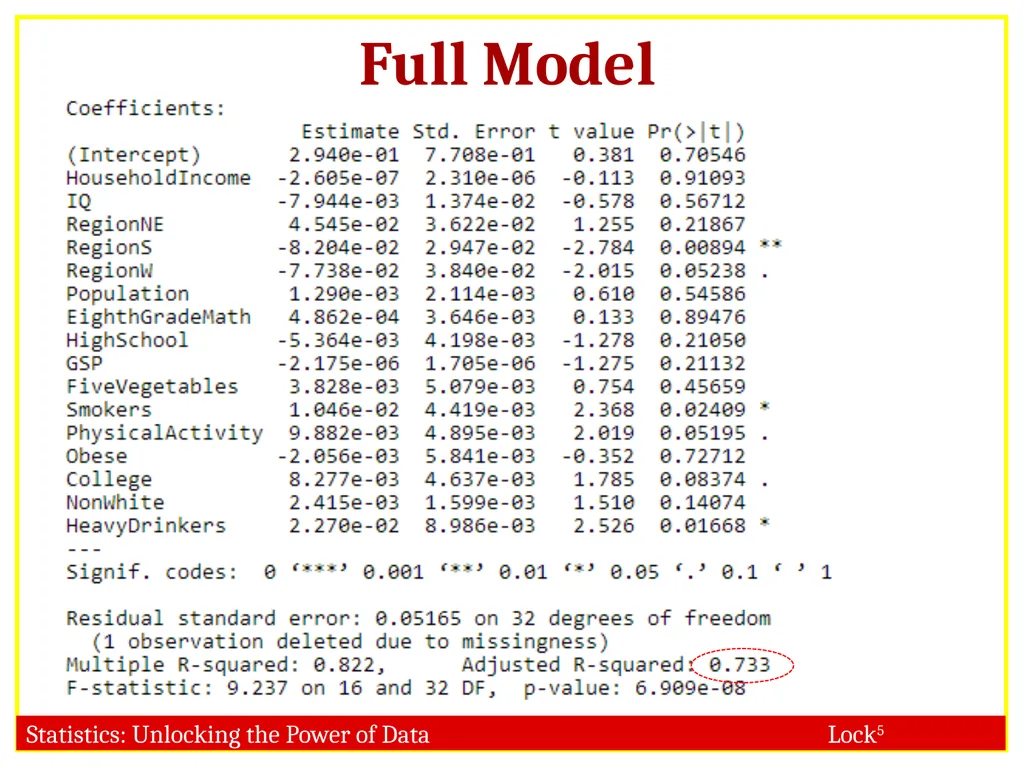
Variable Selection The p-value for an explanatory variable can be taken as a rough measure for how helpful that explanatory variable is to the model
Insignificant variables may be pruned from the model, as long as adjusted R2 doesn’t go down too much
You can also look at relationships between explanatory variables; if two are strongly associated, perhaps both are not necessary<br>
23
Variable Selection (Some) ways of deciding whether a variable should be included in the model or not:
Does it improve adjusted R2?
Does it have a low p-value?
Is it associated with the response by itself?
Is it strongly associated with another explanatory variables? (If yes, then including both may be redundant)
Does common sense say it should contribute to the model?<br>
24
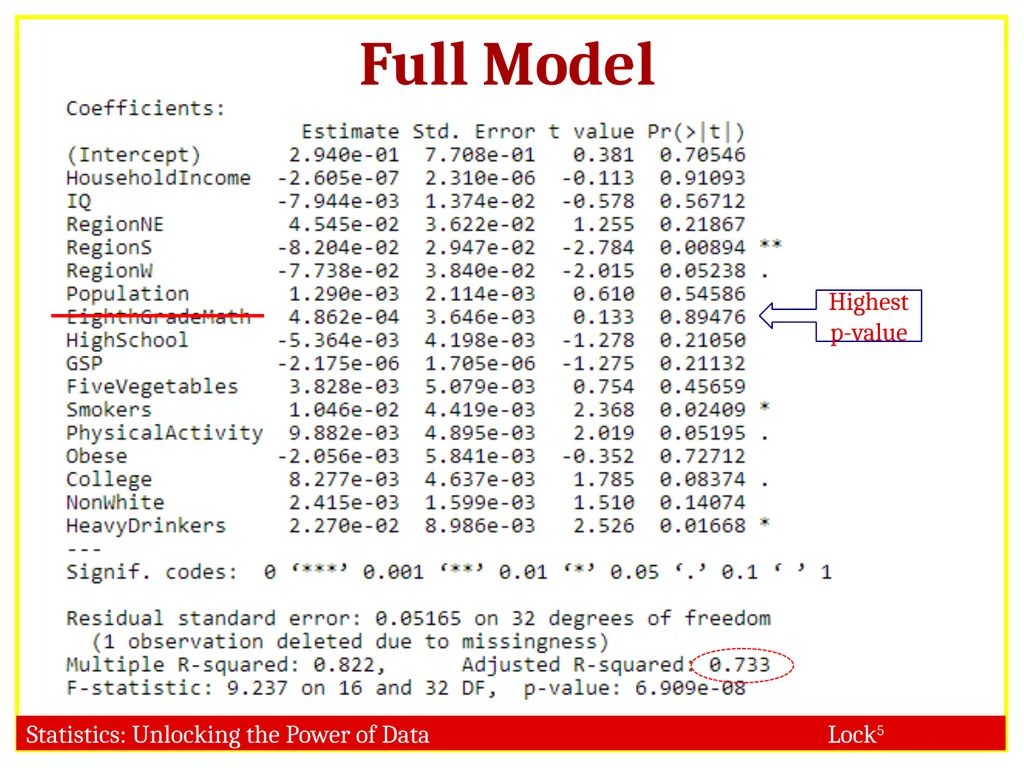
Full Model Highest p-value<br>
25
Pruned Model 1 Highest p-value<br>
26
Pruned Model 2 Highest p-value<br>
27
Pruned Model 3 Highest p-value<br>
28
Pruned Model 4 Highest p-value<br>
29
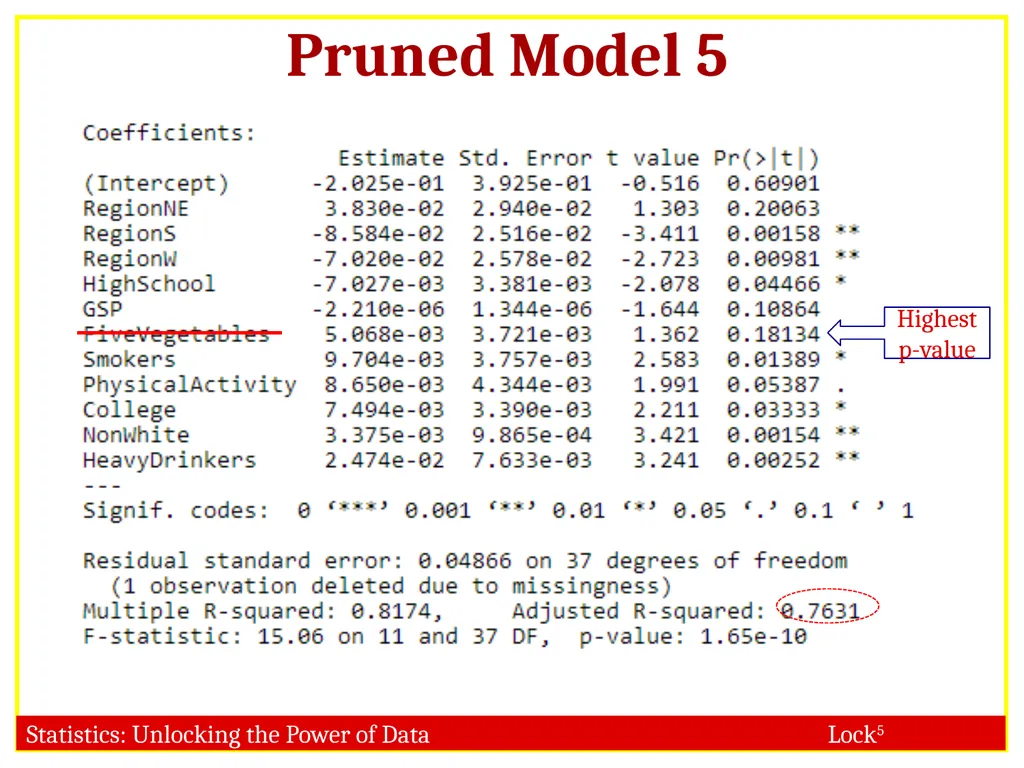
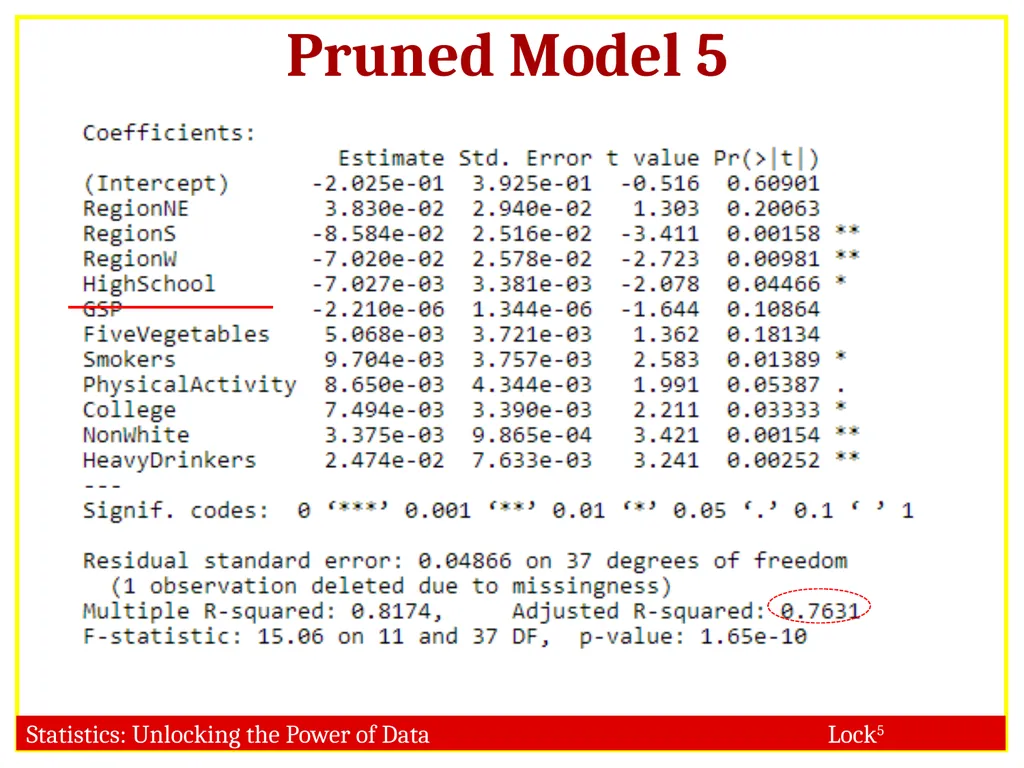
Pruned Model 5 Highest p-value<br>
33
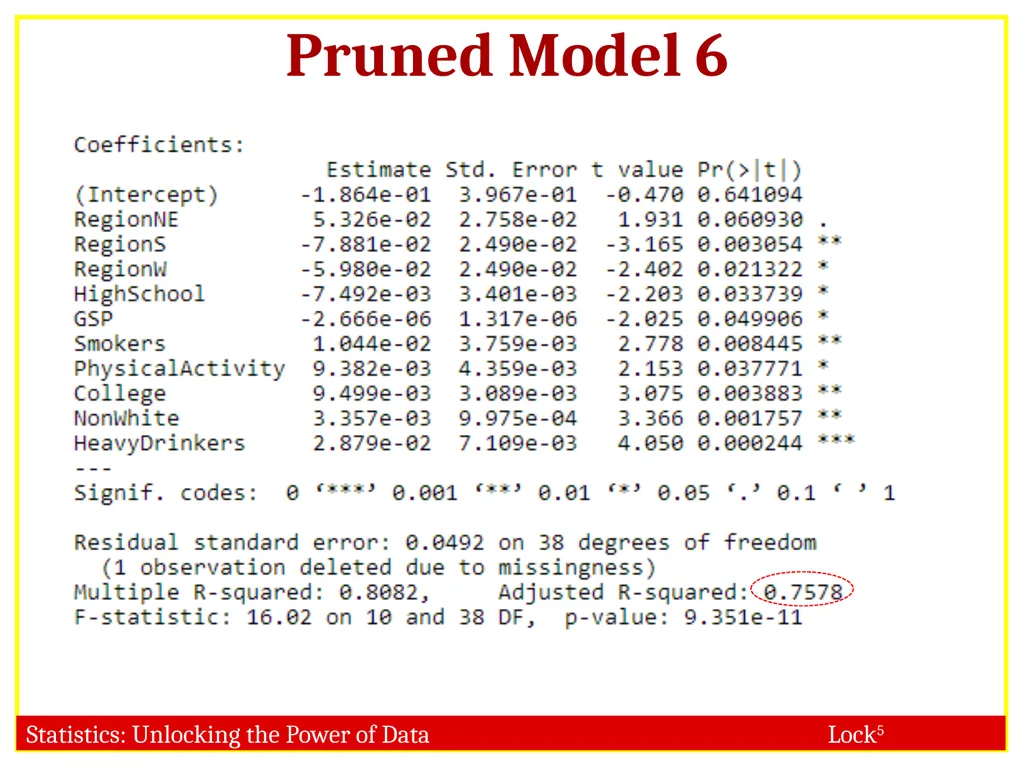
Pruned Model 5 FINAL STEPWISE MODEL<br>
35
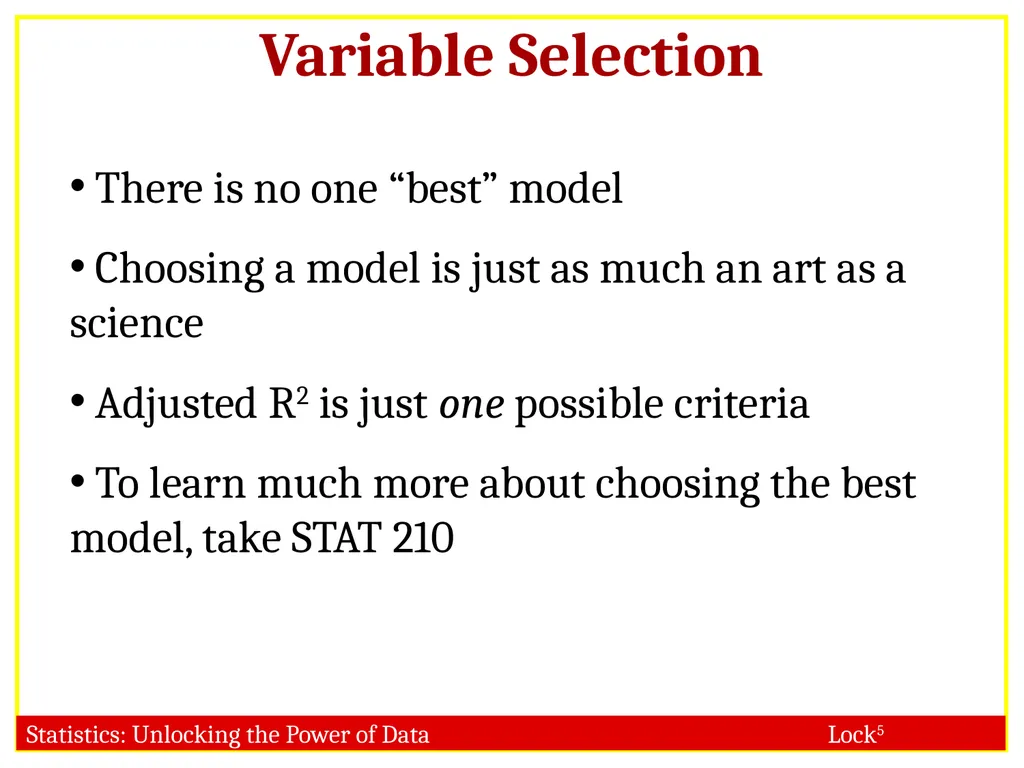
Variable Selection There is no one “best” model
Choosing a model is just as much an art as a science
Adjusted R2 is just one possible criteria
To learn much more about choosing the best model, take STAT 210<br>
36
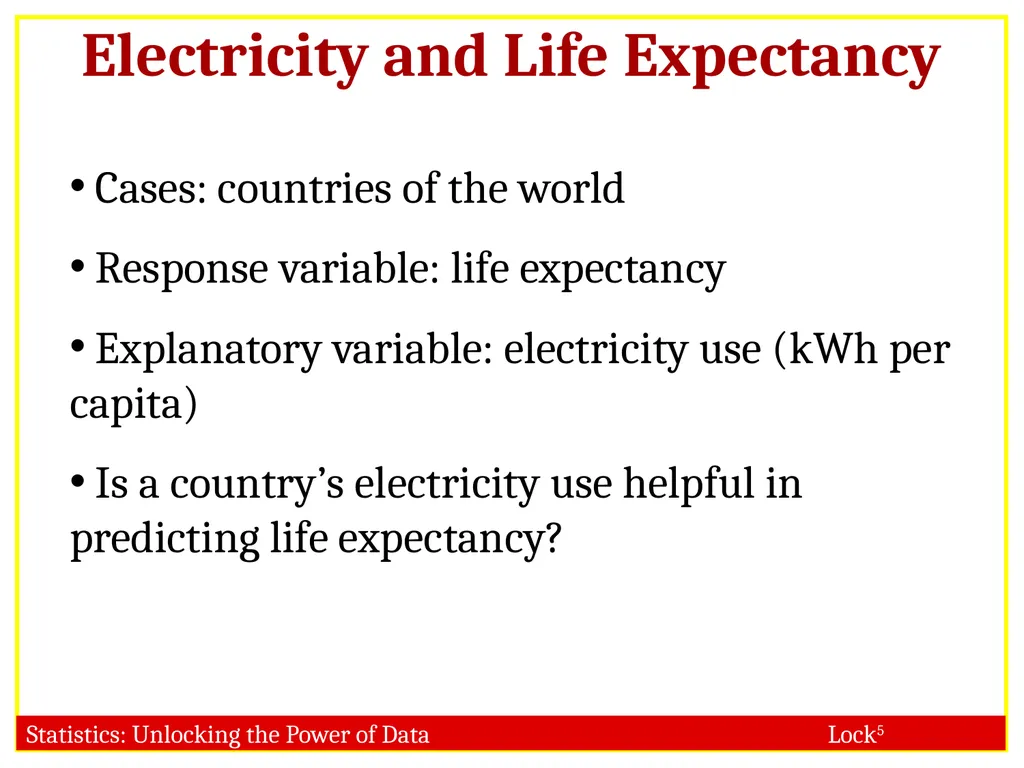
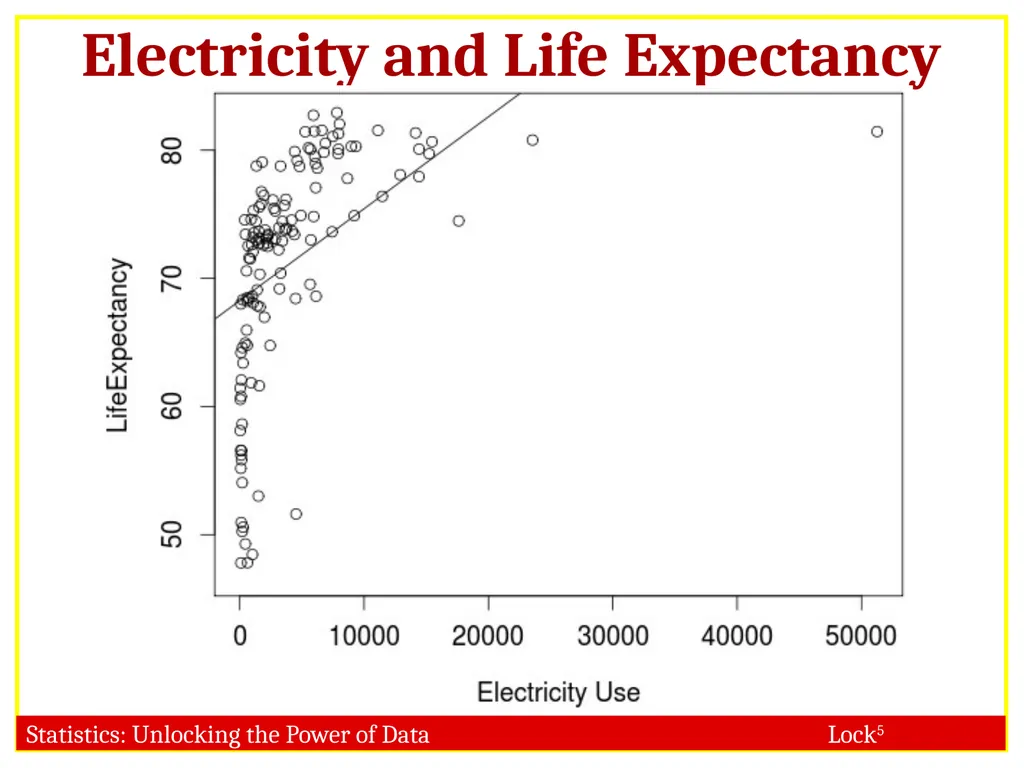
Electricity and Life Expectancy Cases: countries of the world
Response variable: life expectancy
Explanatory variable: electricity use (kWh per capita)
Is a country’s electricity use helpful in predicting life expectancy?<br>
37
Electricity and Life Expectancy<br>
38
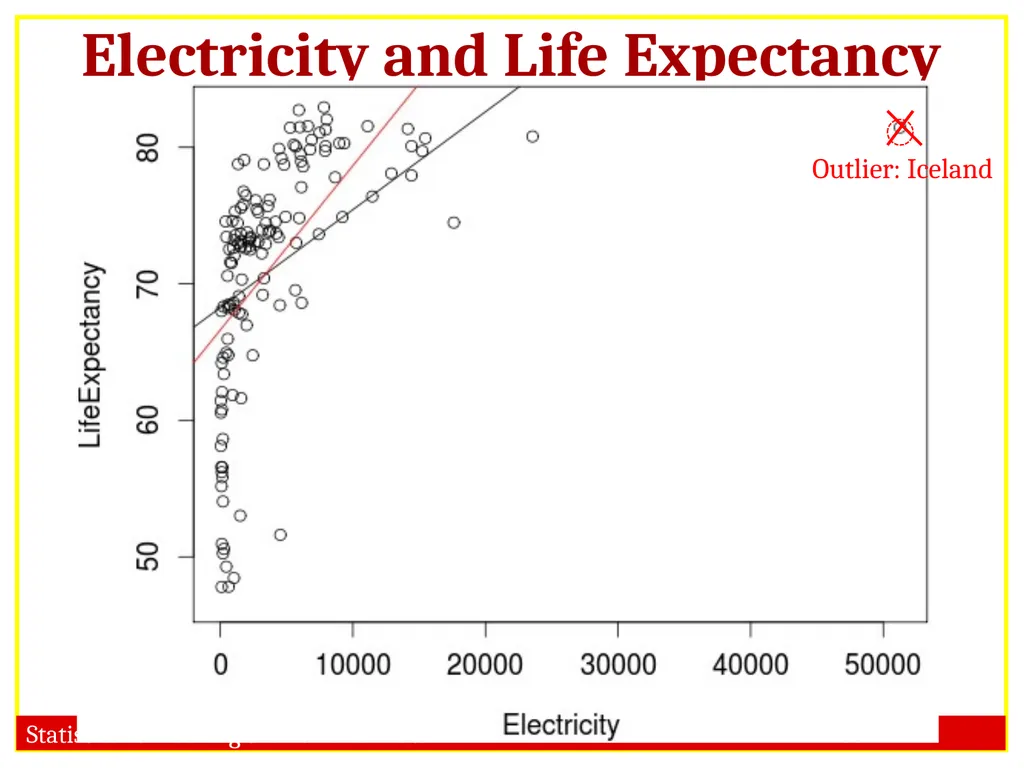
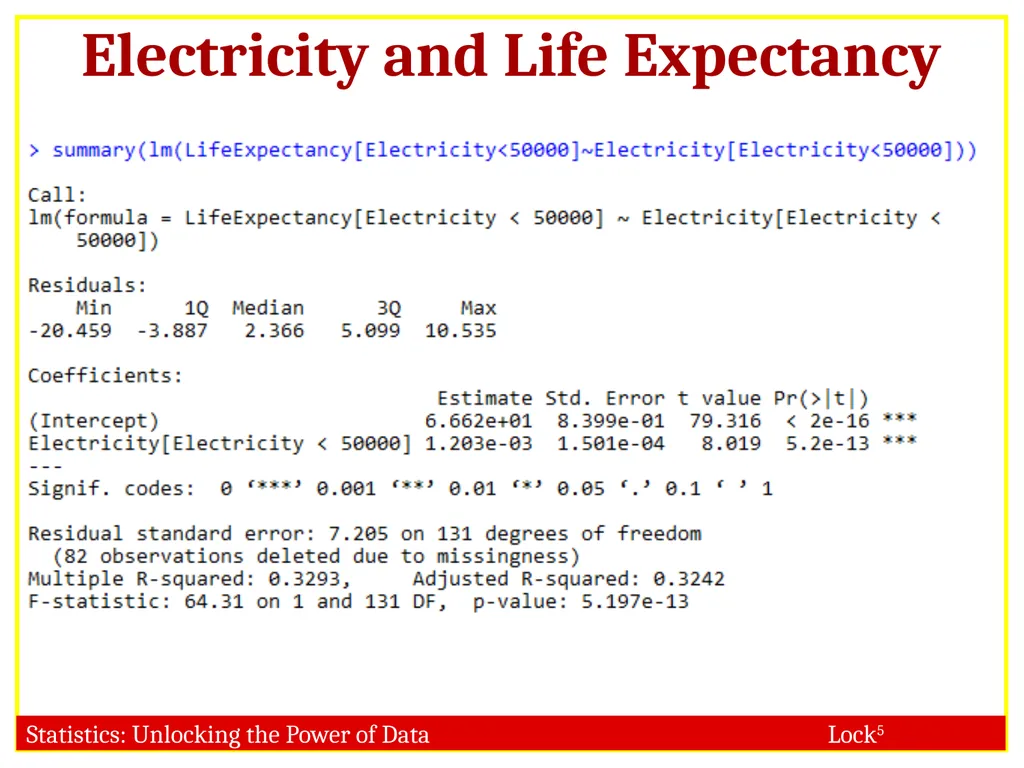
Electricity and Life Expectancy Outlier: Iceland<br>
39
Electricity and Life Expectancy<br>
40
Electricity and Life Expectancy<br>
41
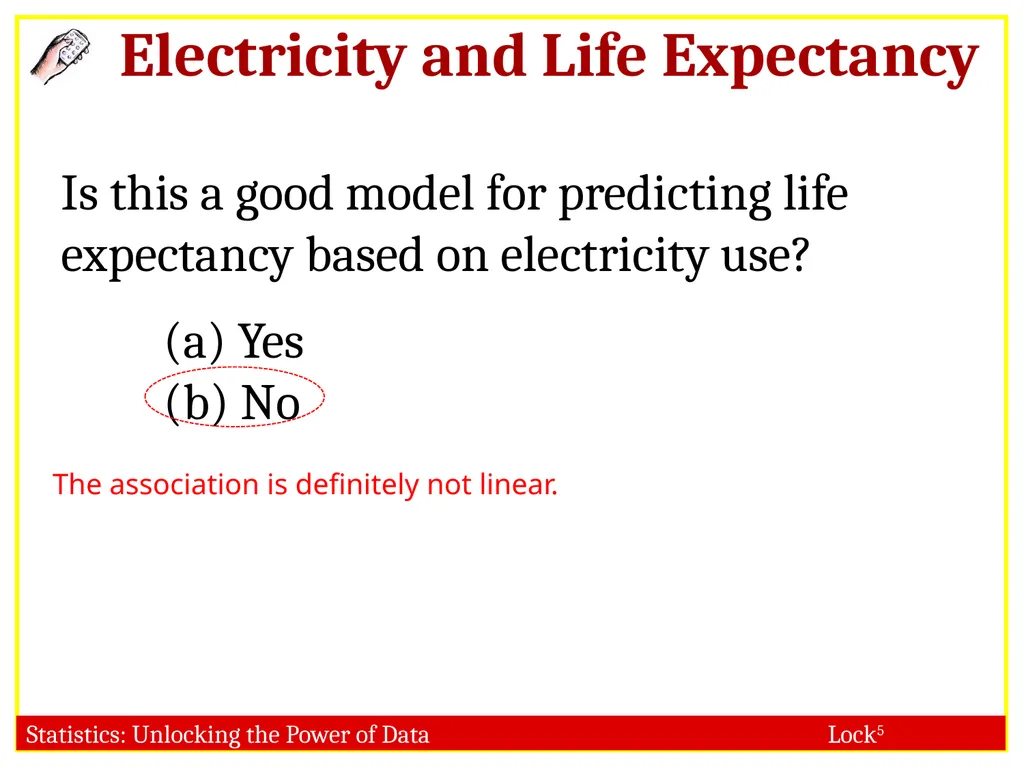
Electricity and Life Expectancy Is this a good model for predicting life expectancy based on electricity use?
(a) Yes
(b) No The association is definitely not linear.<br>
42
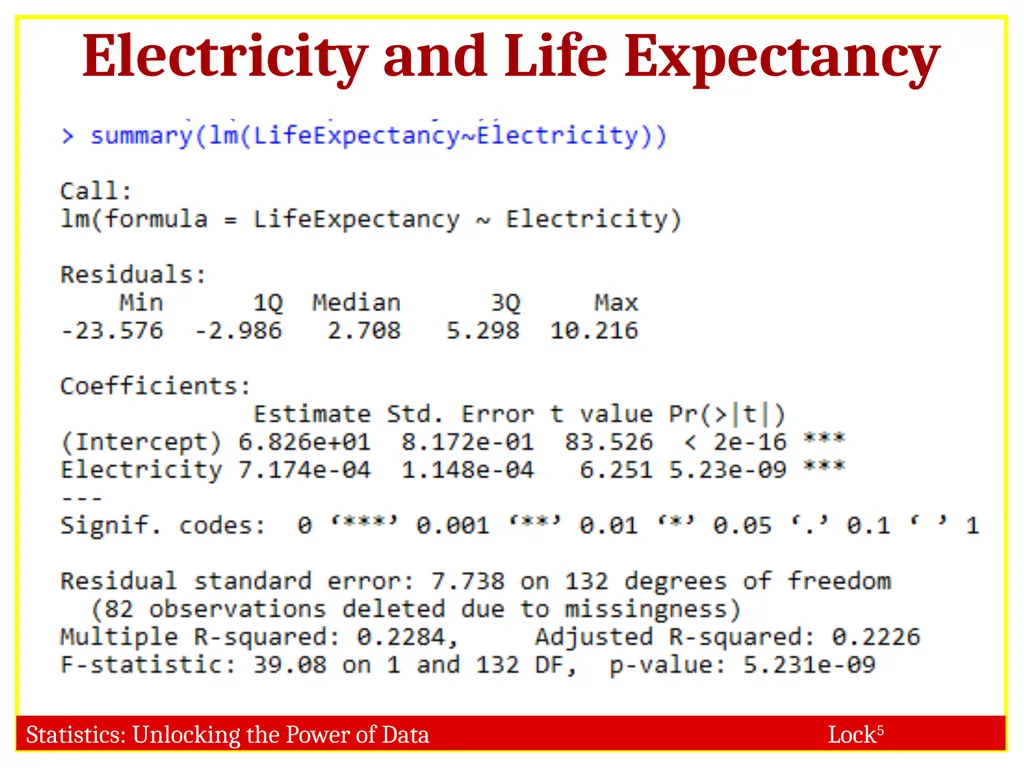
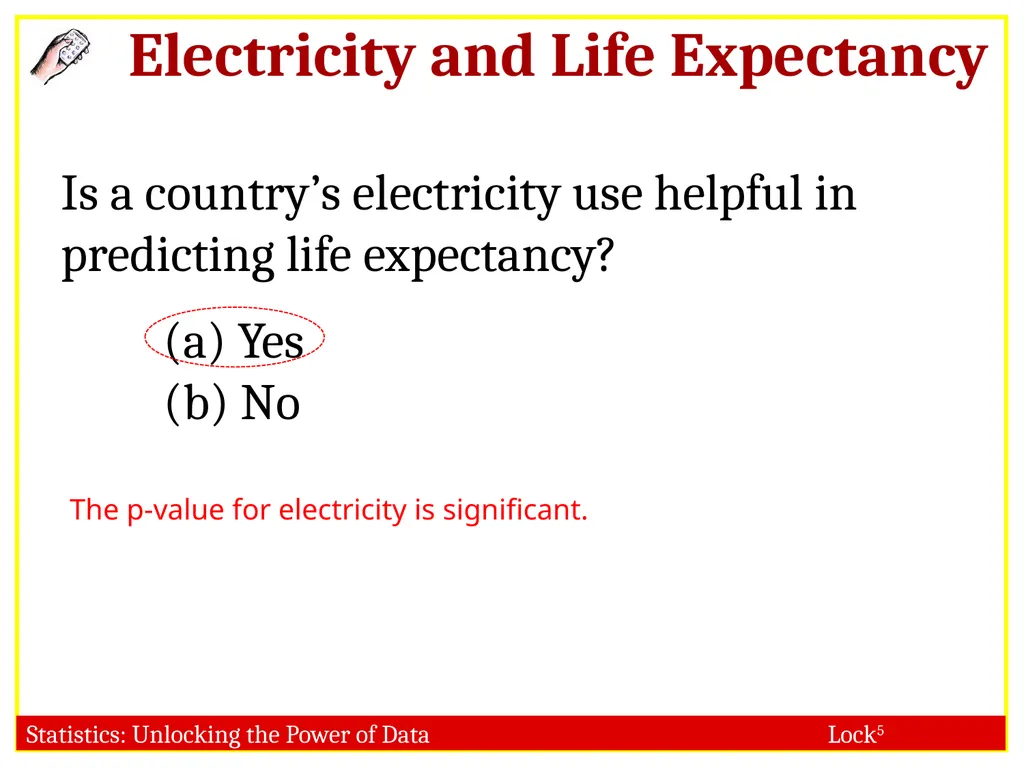
Electricity and Life Expectancy Is a country’s electricity use helpful in predicting life expectancy?
(a) Yes
(b) No The p-value for electricity is significant.<br>
43
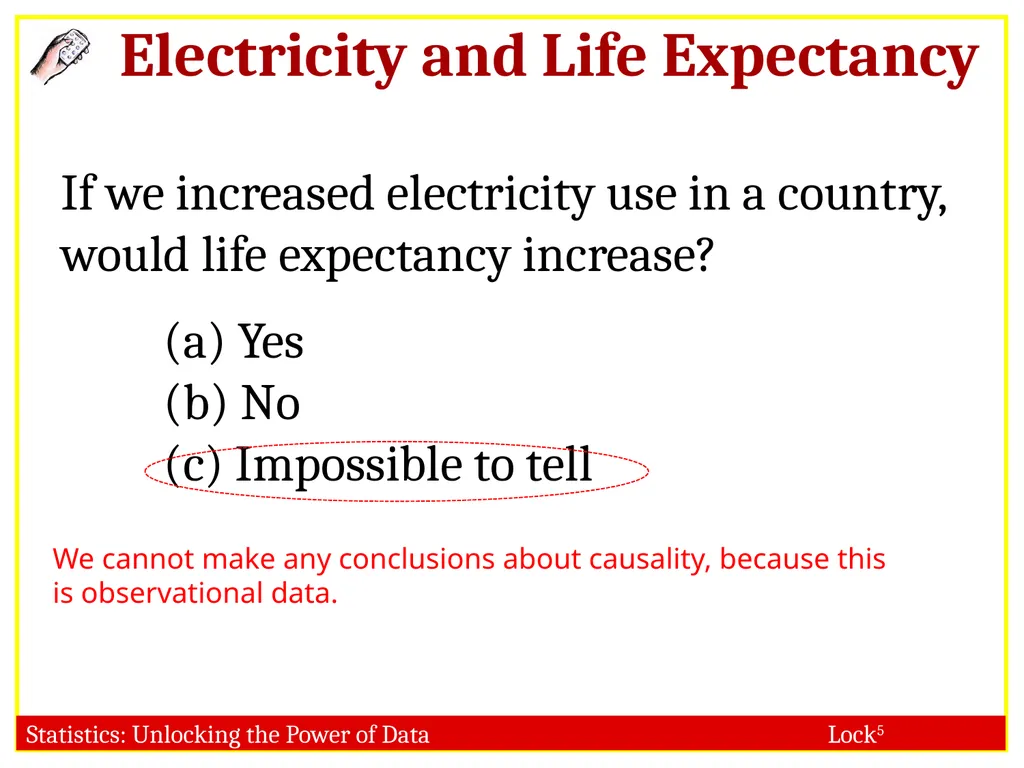
Electricity and Life Expectancy If we increased electricity use in a country, would life expectancy increase?
(a) Yes
(b) No
(c) Impossible to tell We cannot make any conclusions about causality, because this is observational data.<br>
44
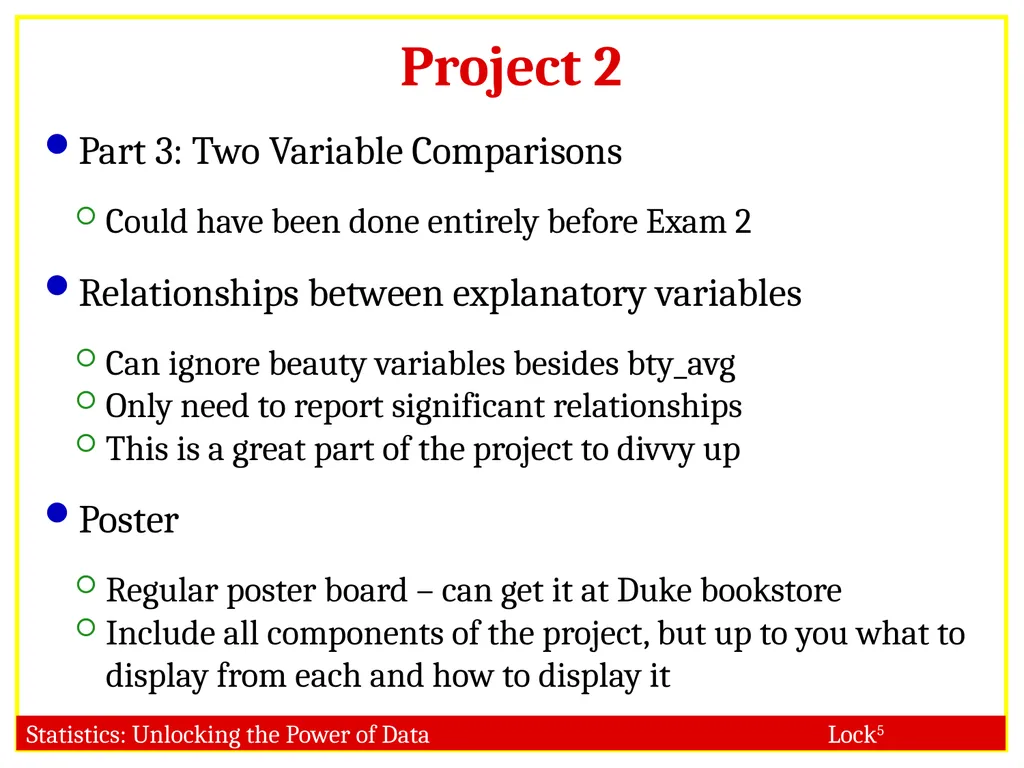
Project 2 Part 3: Two Variable Comparisons
Could have been done entirely before Exam 2
Relationships between explanatory variables
Can ignore beauty variables besides bty_avg
Only need to report significant relationships
This is a great part of the project to divvy up
Poster
Regular poster board – can get it at Duke bookstore
Include all components of the project, but up to you what to display from each and how to display it<br>
45
To Do Read 10.3
Do Homework 8 (due Thursday, 11/29)
Do Project 2 (poster due Monday, 12/3, paper due 12/6)<br>