
Strategy for Increasing India’s Share in Global



Description: Strategy for Increasing Indias Share in Global Exports of Made-ups Welspun Group Textiles April 7, 2015, FICCI 1 Significance of 2015 for Global Textile Industry Emergence of Quota Free World 1st January, 2005 Its a decade of Quota
Related Topics
Download Presentation
"Strategy for Increasing India’s Share in Global" is the property of its rightful owner. Permission is granted to download and print the materials on this website for personal, non-commercial use only, and to display it on your personal computer provided you do not modify the materials and that you retain all copyright notices contained in the materials. By downloading content from our website, you accept the terms of this agreement.
Presentation Transcript
slide1. Strategy for Increasing India’s Share in Global Exports of Made-ups Welspun Group | Textiles April 7, 2015, FICCI 1<br>
slide2. Significance of 2015 for Global Textile Industry Emergence of Quota Free World – 1st January, 2005
It’s a decade of Quota Free World. 2<br>
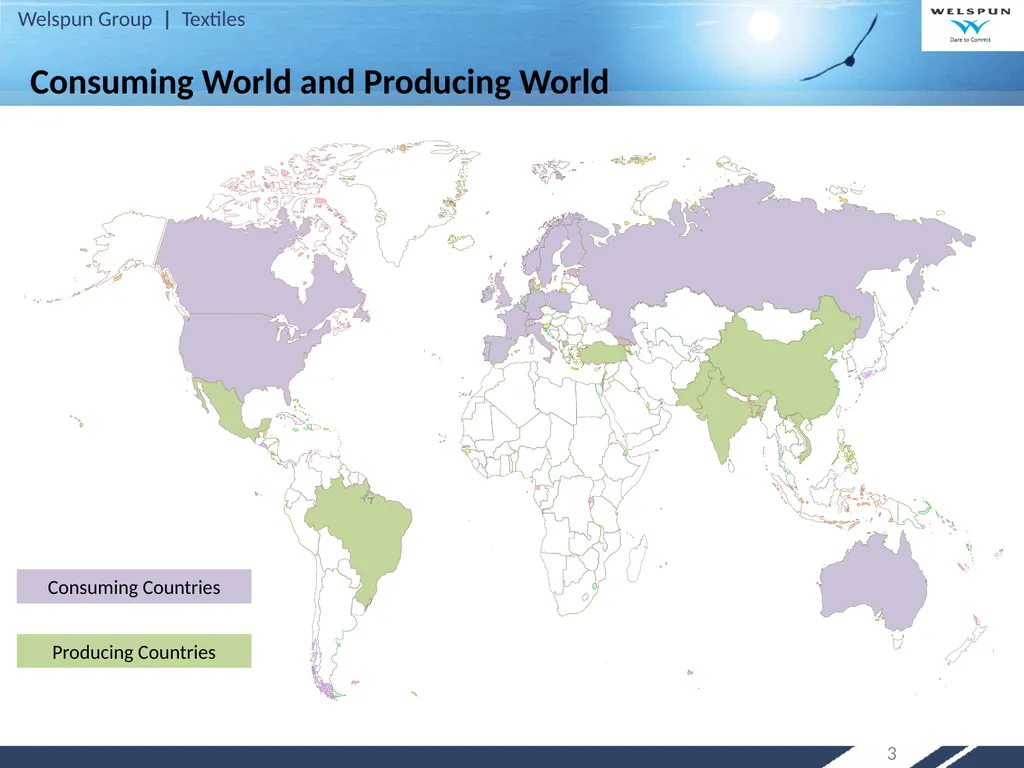
slide3. 3 Consuming World and Producing World Consuming Countries Producing Countries<br>
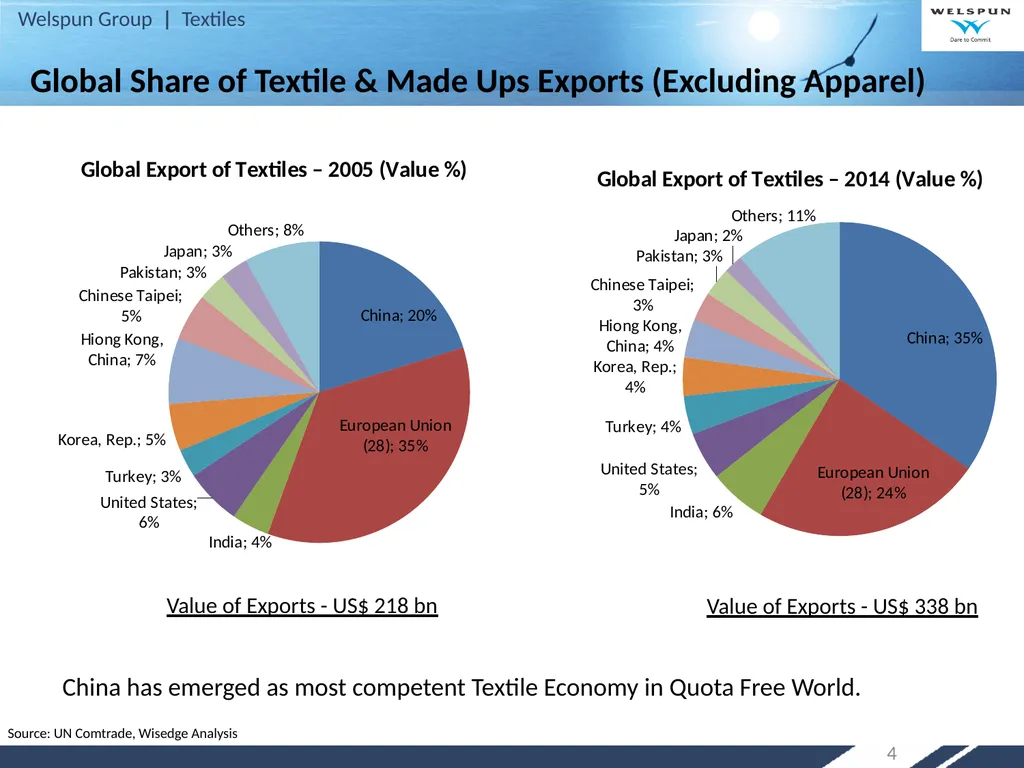
slide4. 4 Global Share of Textile & Made Ups Exports (Excluding Apparel) China has emerged as most competent Textile Economy in Quota Free World. Value of Exports - US$ 218 bn Value of Exports - US$ 338 bn Source: UN Comtrade, Wisedge Analysis<br>
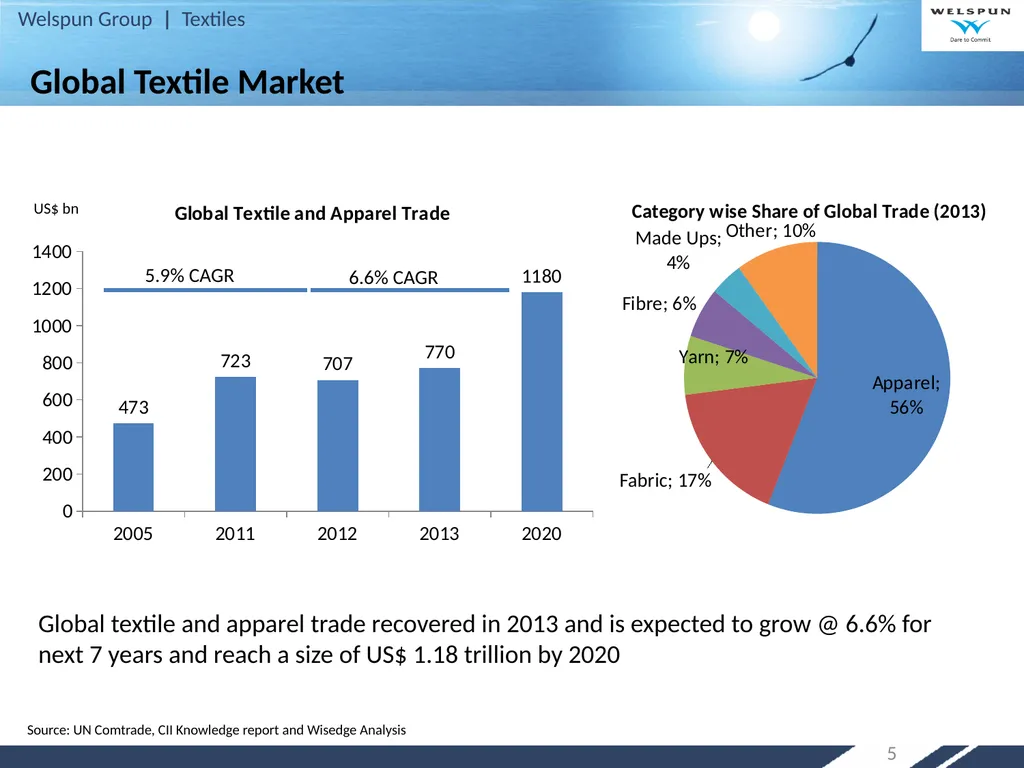
slide5. 5 6.6% CAGR 5.9% CAGR US$ bn Global Textile Market Global textile and apparel trade recovered in 2013 and is expected to grow @ 6.6% for next 7 years and reach a size of US$ 1.18 trillion by 2020 Source: UN Comtrade, CII Knowledge report and Wisedge Analysis<br>
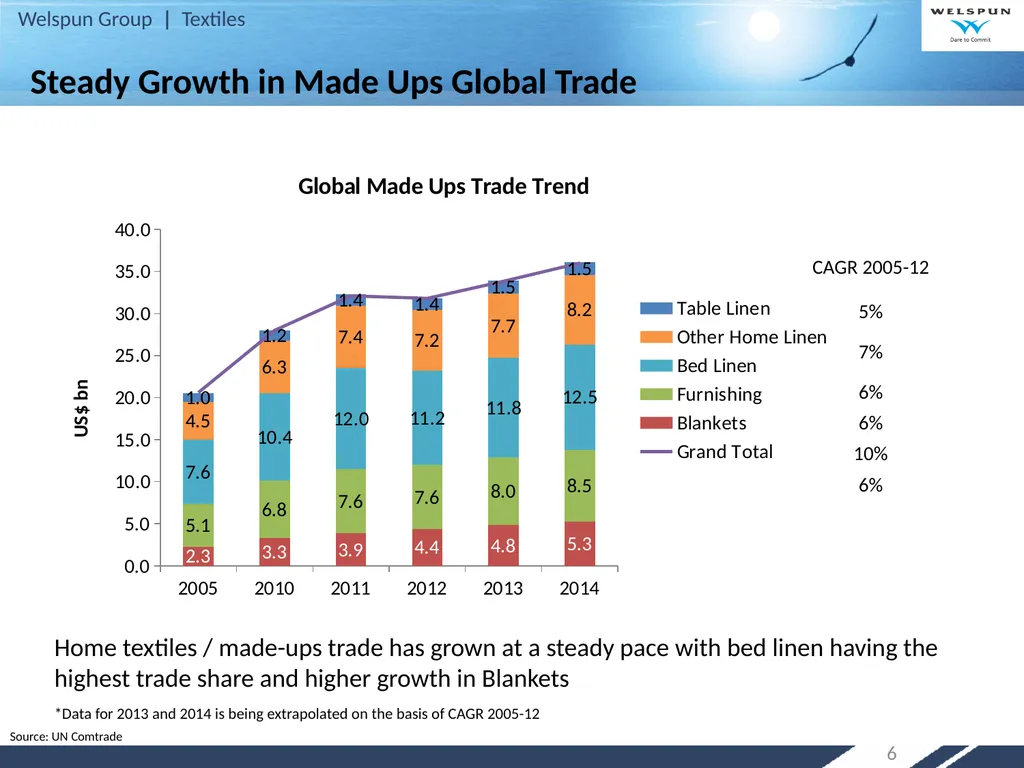
slide6. 6 Home textiles / made-ups trade has grown at a steady pace with bed linen having the highest trade share and higher growth in Blankets Steady Growth in Made Ups Global Trade Source: UN Comtrade *Data for 2013 and 2014 is being extrapolated on the basis of CAGR 2005-12<br>
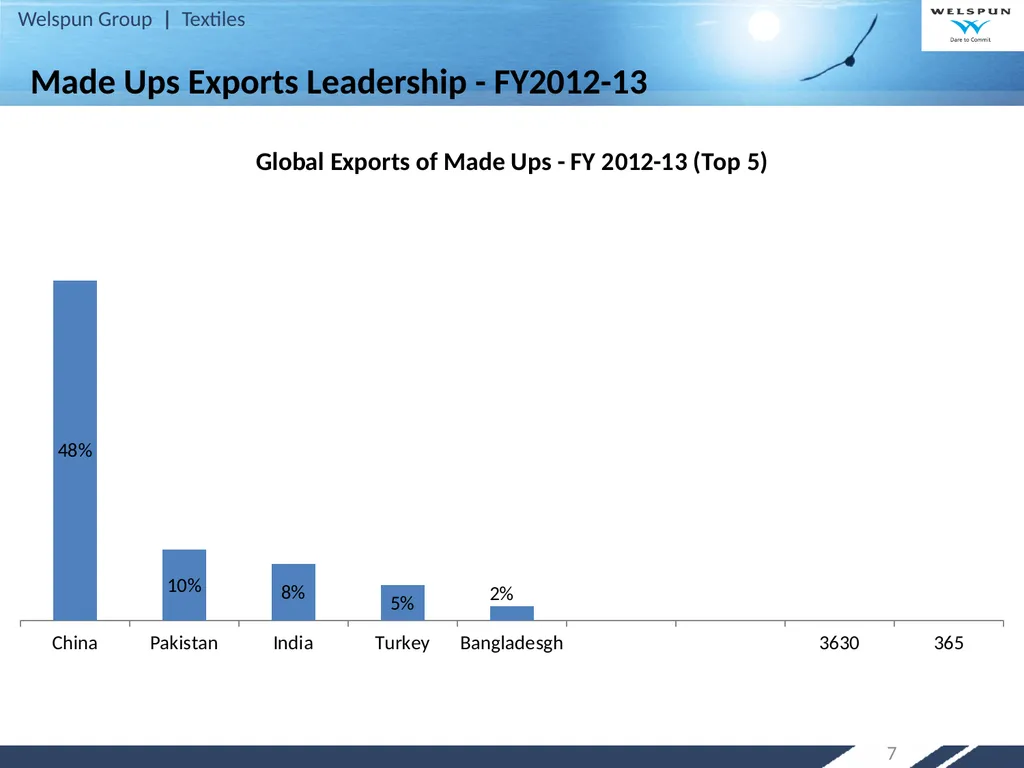
slide7. 7 Made Ups Exports Leadership - FY2012-13<br>
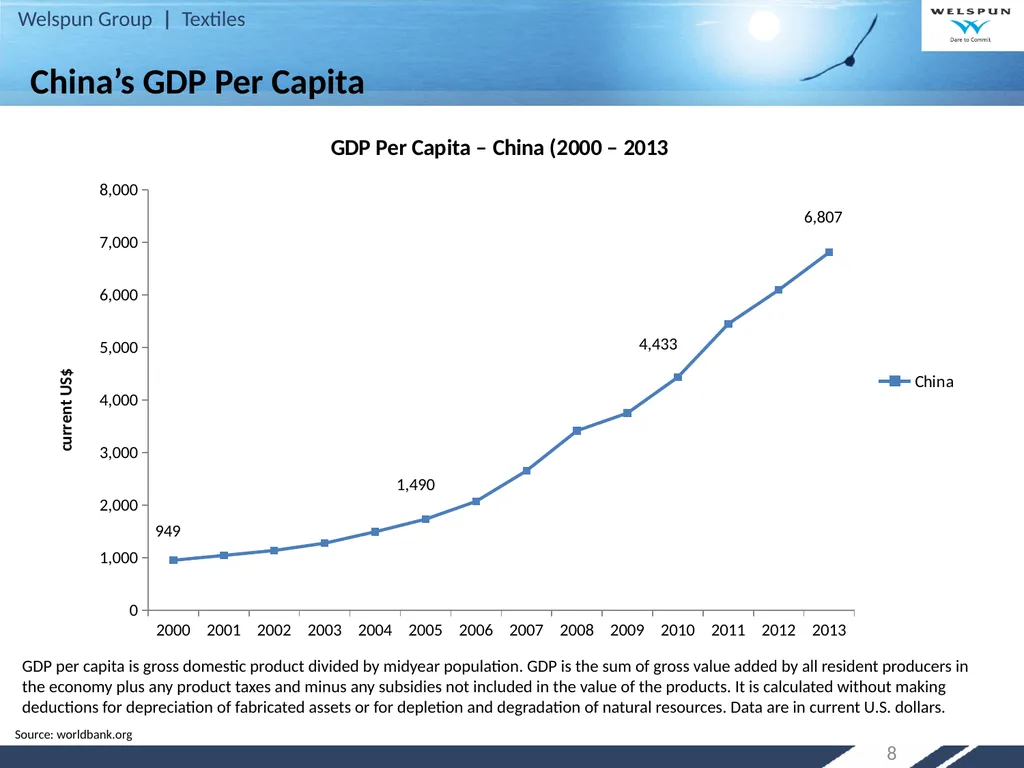
slide8. 8 China’s GDP Per Capita GDP per capita is gross domestic product divided by midyear population. GDP is the sum of gross value added by all resident producers in the economy plus any product taxes and minus any subsidies not included in the value of the products. It is calculated without making deductions for depreciation of fabricated assets or for depletion and degradation of natural resources. Data are in current U.S. dollars. Source: worldbank.org<br>
slide9. Agenda Learning from China’s Strategy
Shifting International Trade Pattern
India’s Strategy 9<br>
slide10. Agenda Learning from China’s Strategy
Shifting International Trade Pattern
India’s Strategy 10<br>
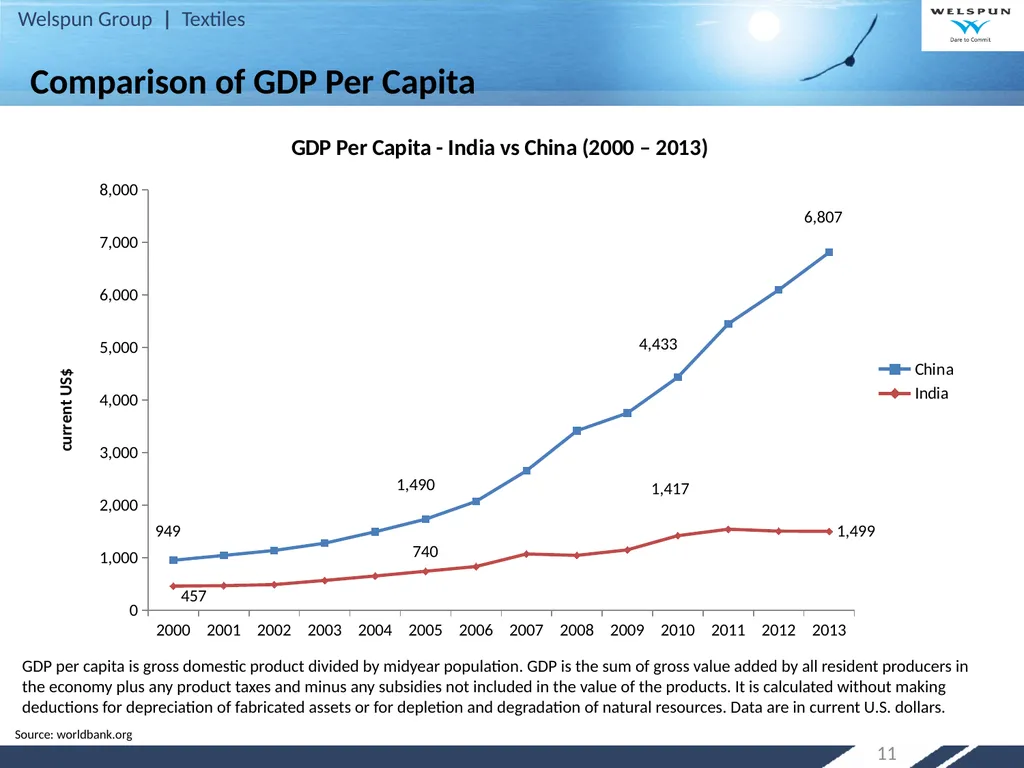
slide11. 11 Comparison of GDP Per Capita GDP per capita is gross domestic product divided by midyear population. GDP is the sum of gross value added by all resident producers in the economy plus any product taxes and minus any subsidies not included in the value of the products. It is calculated without making deductions for depreciation of fabricated assets or for depletion and degradation of natural resources. Data are in current U.S. dollars. Source: worldbank.org<br>
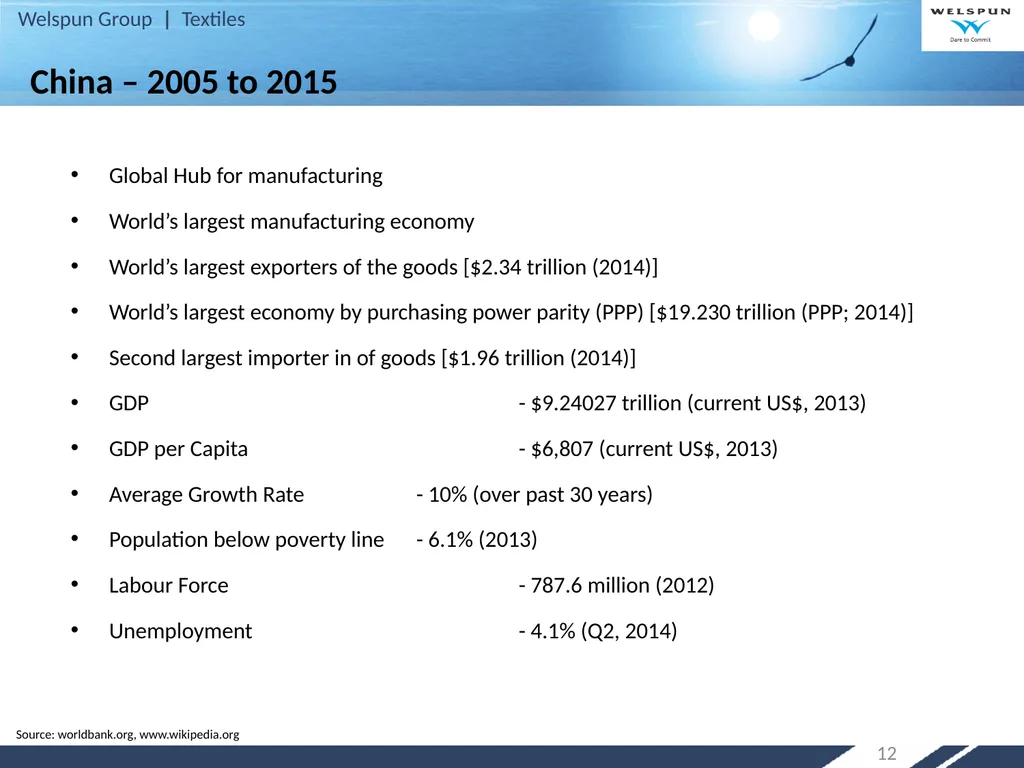
slide12. China – 2005 to 2015 Global Hub for manufacturing
World’s largest manufacturing economy
World’s largest exporters of the goods [$2.34 trillion (2014)]
World’s largest economy by purchasing power parity (PPP) [$19.230 trillion (PPP; 2014)]
Second largest importer in of goods [$1.96 trillion (2014)]
GDP - $9.24027 trillion (current US$, 2013)
GDP per Capita - $6,807 (current US$, 2013)
Average Growth Rate - 10% (over past 30 years)
Population below poverty line - 6.1% (2013)
Labour Force - 787.6 million (2012)
Unemployment - 4.1% (Q2, 2014) 12 Source: worldbank.org, www.wikipedia.org<br>
slide13. To build-on the strength of the large population, a low skill industry to alleviate poverty and to build infrastructure for future value added high-tech manufacturing. 13 China’s Game Plan<br>
slide14. China’s Strategy Aggressively Adjusting Industry Structure
China government made some aggressive decisions and executed them in disciplined way.
Artificially Undervalued Currency
In 2005, China held Renminbi (Yuan) at undervalued rate by pegging it to USD.
This led to improve competitiveness of Chinese textile exporters.
FDI
Increased flow of Foreign Direct Investment by foreign companies established through Joint Ventures employed investments on machines, plant, technology and skills.
Location of parks near Coast Line
Textile parks are located near coast line to strengthen supply chain
Economies of Scale
Large scale manufacturing unit to gain economies of scale 14<br>
slide15. China’s Strategy Improve Competence by Shifting Focus from Pricing to Costing
Low price points to gain market share
Focus on Total Costs Superiority
Efforts was made to reduce all the cost elements such as labour cost, cost of materials etc.
Compliance of Social and Labour Standards
Adherence to compliances like social responsibility, child labour, health and safety,
e.g. SA 8000 widely adopted by Industry.
Strengthen Supply Chain
Focus on making an efficient system and optimum resource allocation
Enlarge market, build up more marketing channels and gain controlling right in global supply chain.
Development of Industrial Parks near coastal area. 15<br>
slide16. Aggressive Skill Development Programme
Vocational and Education training integration with Schooling.
Stipend programme for Secondary School Education in rural areas
Regulations in Law such as “Citizens shall have the right to receive vocational education.” 16 China’s Strategy<br>
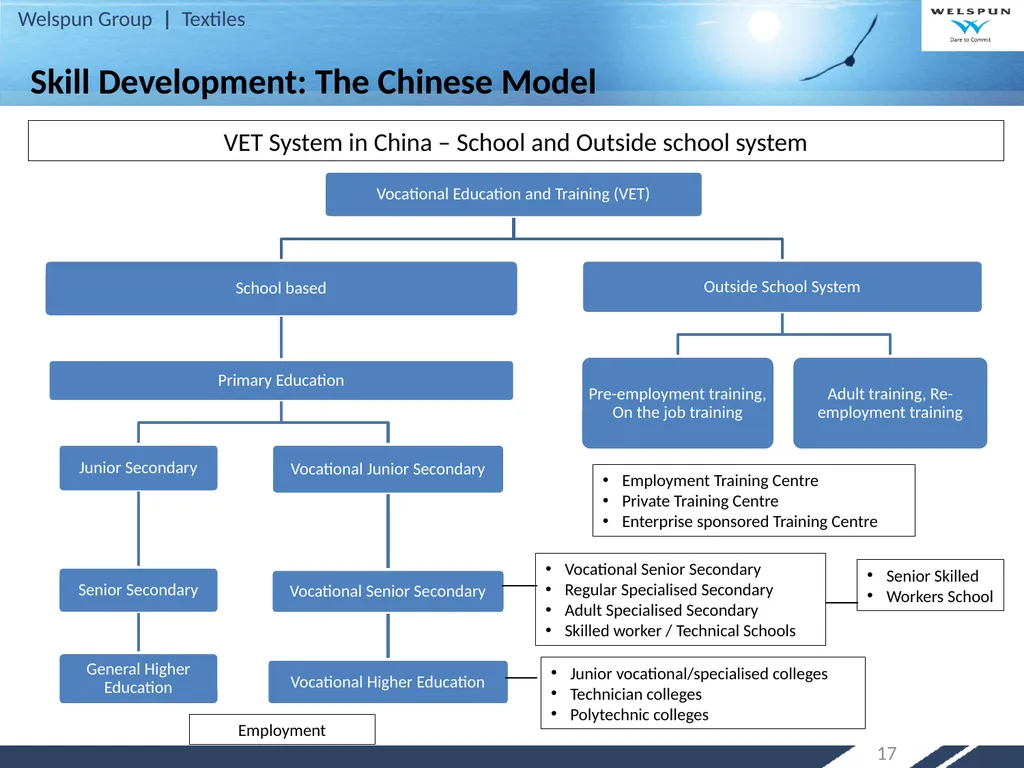
slide17. 17 VET System in China – School and Outside school system Employment Training Centre
Private Training Centre
Enterprise sponsored Training Centre Vocational Senior Secondary
Regular Specialised Secondary
Adult Specialised Secondary
Skilled worker / Technical Schools Junior vocational/specialised colleges
Technician colleges
Polytechnic colleges Senior Skilled
Workers School Employment Skill Development: The Chinese Model<br>
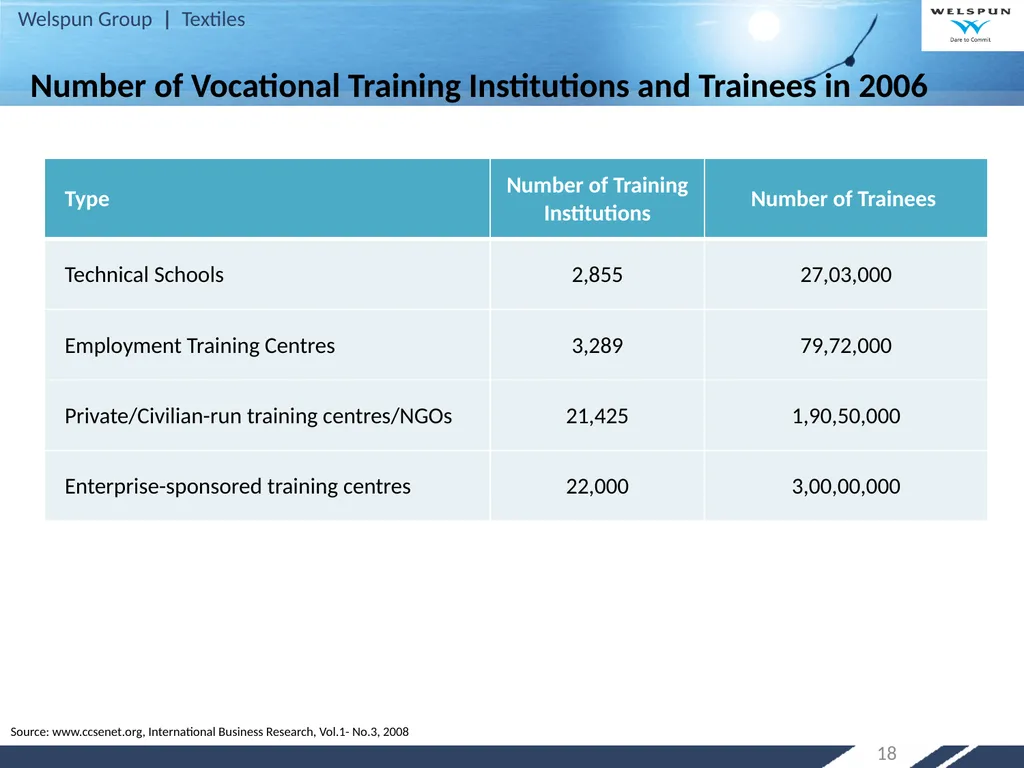
slide18. 18 Number of Vocational Training Institutions and Trainees in 2006 Source: www.ccsenet.org, International Business Research, Vol.1- No.3, 2008<br>
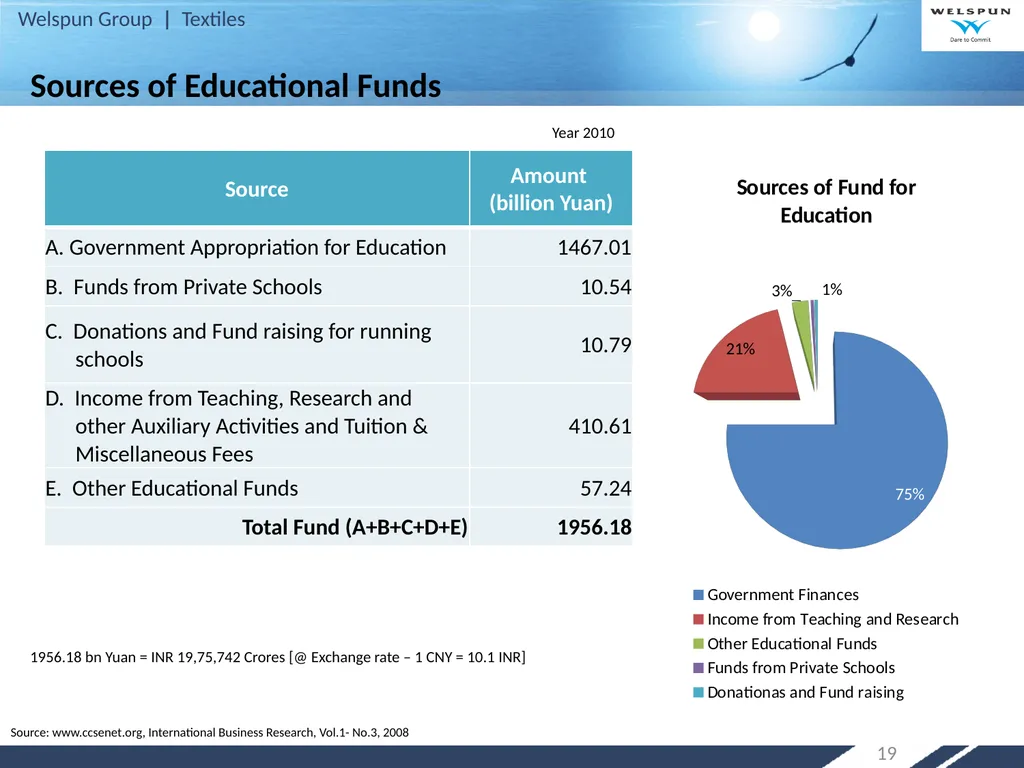
slide19. 19 Sources of Educational Funds 1956.18 bn Yuan = INR 19,75,742 Crores [@ Exchange rate – 1 CNY = 10.1 INR] Source: www.ccsenet.org, International Business Research, Vol.1- No.3, 2008 Year 2010<br>
slide20. Agenda Learning from China’s Strategy
Shifting International Trade Pattern
India’s Strategy 20<br>
slide21. Shifting International Trade Pattern After setting the trade free from quantitative (quota) restrictions, USA and EU have tried to influence the trade by creating trade blocks and preferential access by means import duties.
USA, EU and Japan traditionally had threat perception about each other ……. For the first time these three are joining hands for trade.
TPP (Trans Pacific Partnership) (12 Countries)
Australia, Brunei, Canada, Chile, Japan, Malaysia, Mexico, New Zealand, Peru, Singapore, USA and Vietnam
TPP covers product standards and …..
Intellectual Property rights, FDI, Competition policy, Environment, Labour, State owned Enterprise policies, E-commerce, Govt. Procurement, Technical Barriers to trade, transparency in Health care technologies and pharmaceuticals regulatory coherence. 21<br>
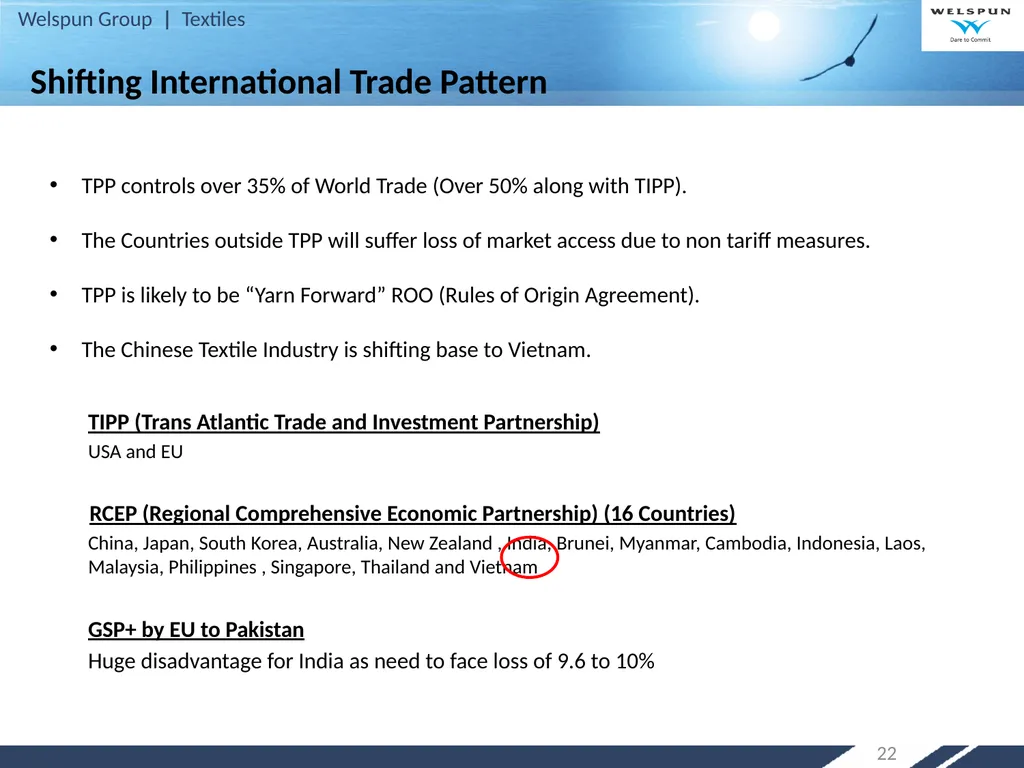
slide22. 22 TPP controls over 35% of World Trade (Over 50% along with TIPP).
The Countries outside TPP will suffer loss of market access due to non tariff measures.
TPP is likely to be “Yarn Forward” ROO (Rules of Origin Agreement).
The Chinese Textile Industry is shifting base to Vietnam.
TIPP (Trans Atlantic Trade and Investment Partnership)
USA and EU
RCEP (Regional Comprehensive Economic Partnership) (16 Countries)
China, Japan, South Korea, Australia, New Zealand , India, Brunei, Myanmar, Cambodia, Indonesia, Laos, Malaysia, Philippines , Singapore, Thailand and Vietnam
GSP+ by EU to Pakistan
Huge disadvantage for India as need to face loss of 9.6 to 10% Shifting International Trade Pattern<br>
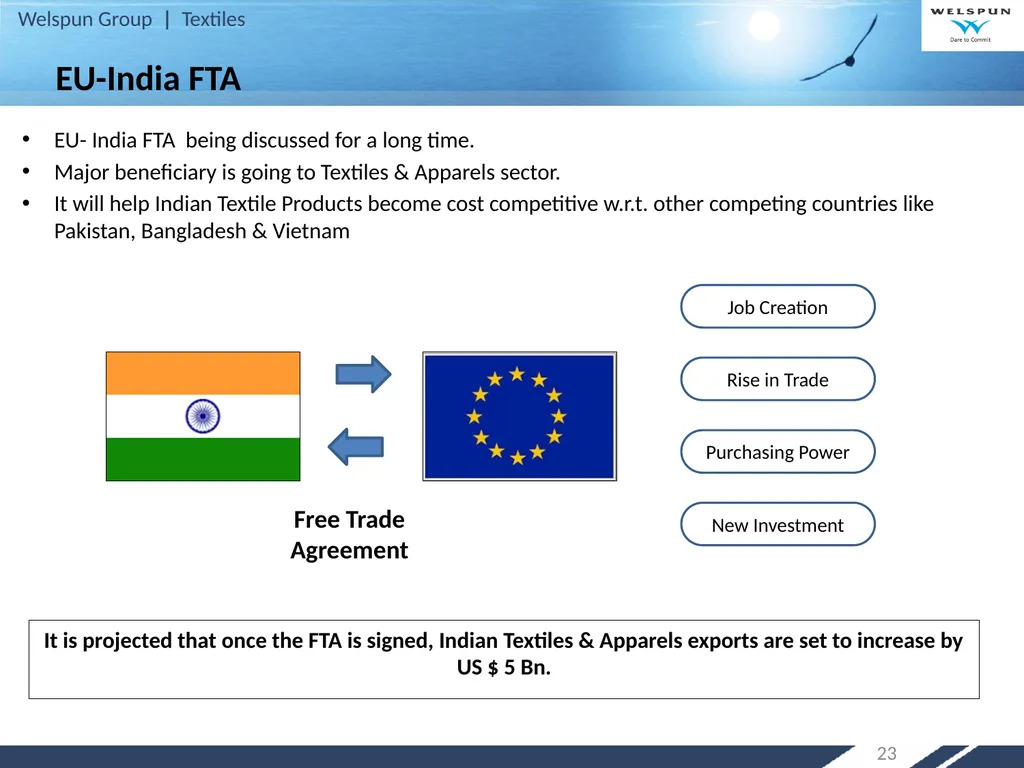
slide23. 23 EU- India FTA being discussed for a long time.
Major beneficiary is going to Textiles & Apparels sector.
It will help Indian Textile Products become cost competitive w.r.t. other competing countries like Pakistan, Bangladesh & Vietnam Job Creation Rise in Trade Purchasing Power New Investment It is projected that once the FTA is signed, Indian Textiles & Apparels exports are set to increase by US $ 5 Bn. Free Trade Agreement EU-India FTA<br>
slide24. Brunei
Malaysia
Singapore
Vietnam Indonesia,
Philippines, India
Thailand, Laos
Myanmar
Cambodia TPP
Canada
Chile
Mexico
Peru RCEP
China USA Various FTAs Vietnam is the only Garment Producing country.
If TPP comes into force then Vietnam will have a preferred access to US market.
China is likely to use this opportunity by migrating
textile industry to Vietnam Vietnam India Australia
Japan
New Zealand
Malaysia TPP – Trans Pacific Agreement
TIPP – Trans Atlantic Trade and Investment Partnership
RCEP - Regional Comprehensive Economic Partnership
AIFTA – ASEAN – India Free Trade Area<br>
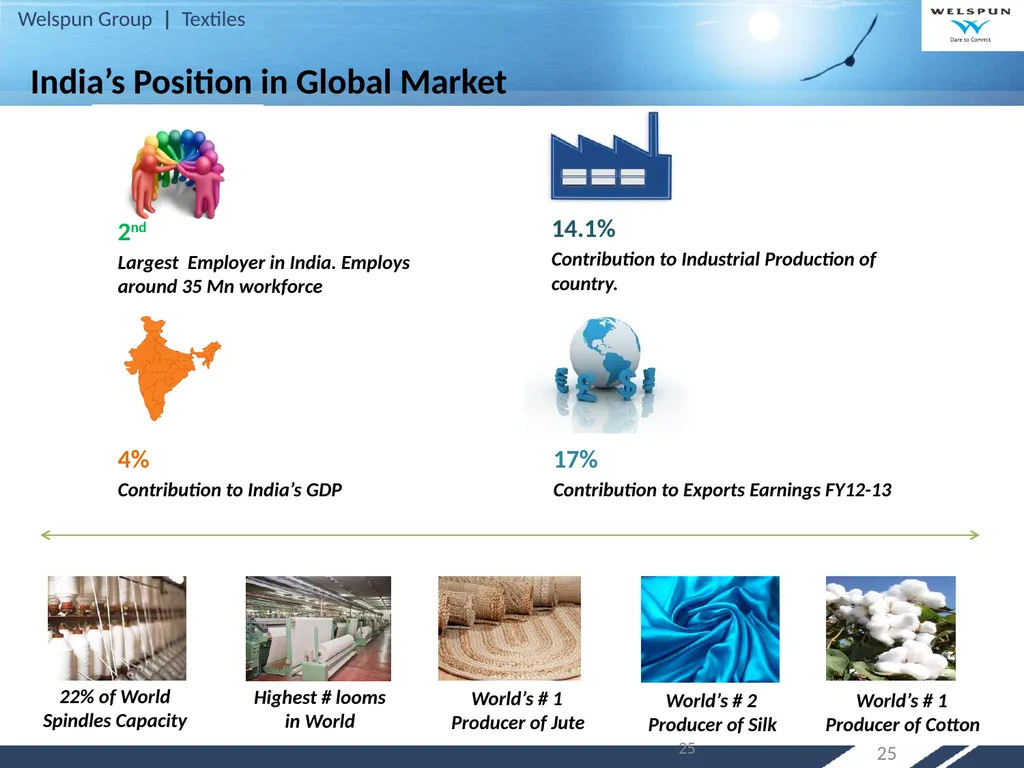
slide25. 25 India’s Position in Global Market 2nd
Largest Employer in India. Employs around 35 Mn workforce 14.1%
Contribution to Industrial Production of country. 4%
Contribution to India’s GDP 17%
Contribution to Exports Earnings FY12-13 22% of World Spindles Capacity Highest # looms in World World’s # 1 Producer of Jute World’s # 2 Producer of Silk World’s # 1 Producer of Cotton 25<br>
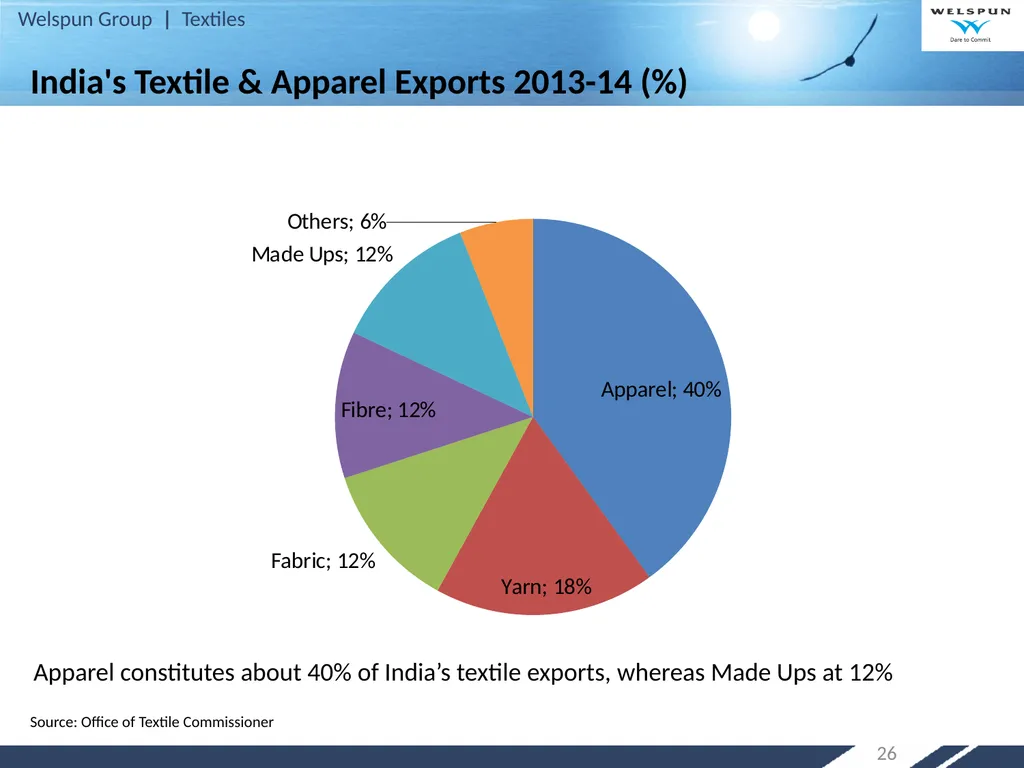
slide26. 26 India's Textile & Apparel Exports 2013-14 (%) Source: Office of Textile Commissioner Apparel constitutes about 40% of India’s textile exports, whereas Made Ups at 12%<br>
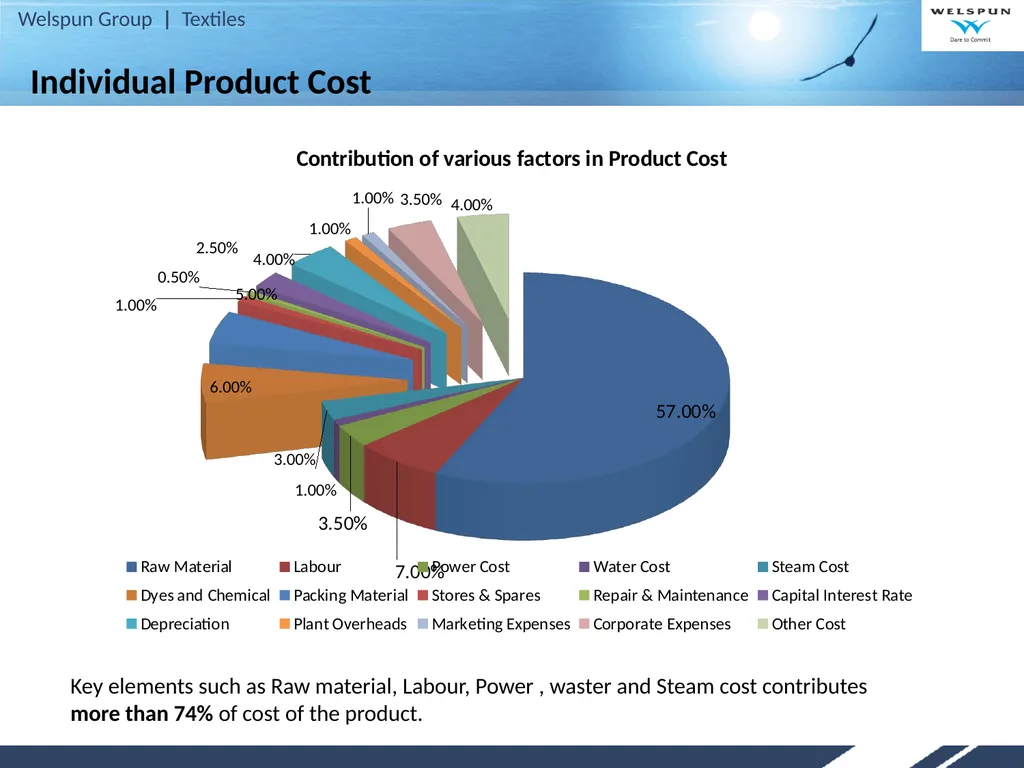
slide27. Individual Product Cost Key elements such as Raw material, Labour, Power , waster and Steam cost contributes more than 74% of cost of the product.<br>
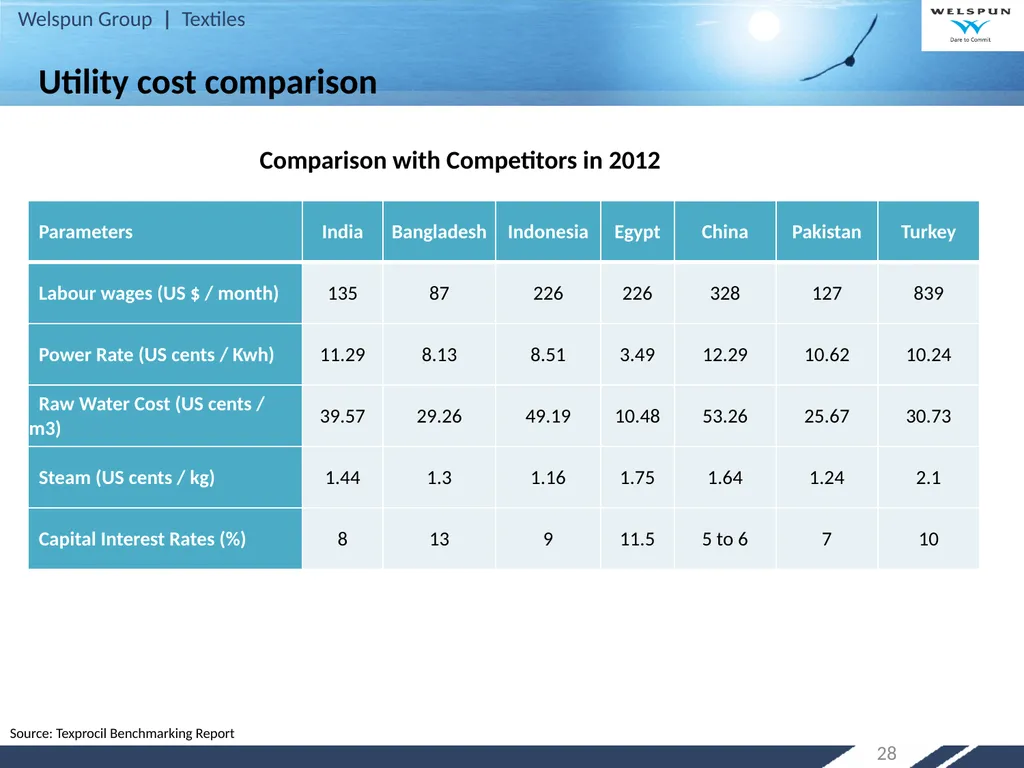
slide28. 28 Source: Texprocil Benchmarking Report Utility cost comparison Comparison with Competitors in 2012<br>
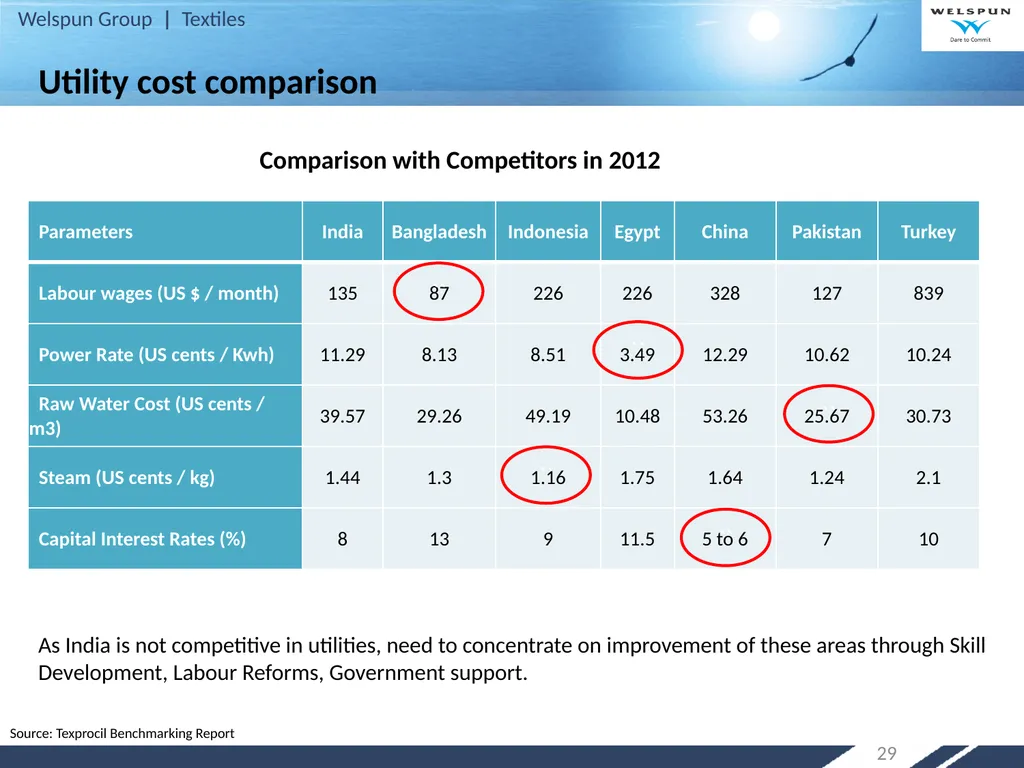
slide29. 29 `` `` `` `` `` Source: Texprocil Benchmarking Report As India is not competitive in utilities, need to concentrate on improvement of these areas through Skill Development, Labour Reforms, Government support. Utility cost comparison Comparison with Competitors in 2012<br>
slide30. Agenda Learning from China’s Strategy
Shifting International Trade Pattern
India’s Strategy 30<br>
slide31. India’s Strategy India need to build a strategy to capture maximum share in consuming world i. e. US and Europe.
India needs to take cognizance of shifting global trade patterns
due to various FTAs 31<br>
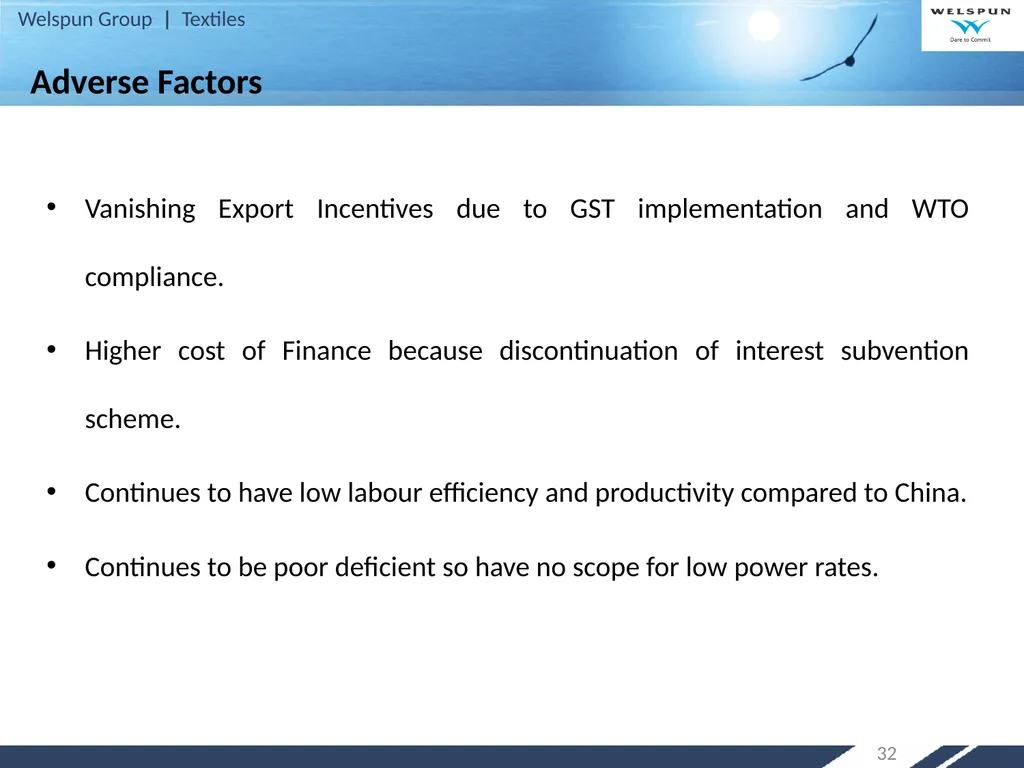
slide32. Adverse Factors Vanishing Export Incentives due to GST implementation and WTO compliance.
Higher cost of Finance because discontinuation of interest subvention scheme.
Continues to have low labour efficiency and productivity compared to China.
Continues to be poor deficient so have no scope for low power rates. 32<br>
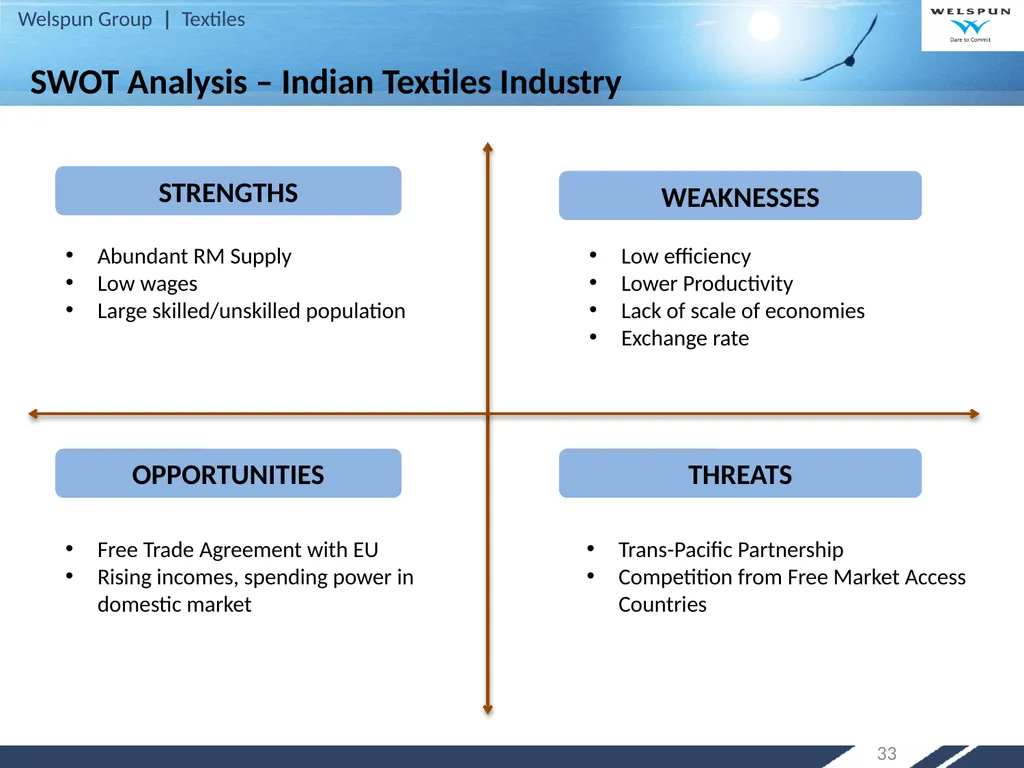
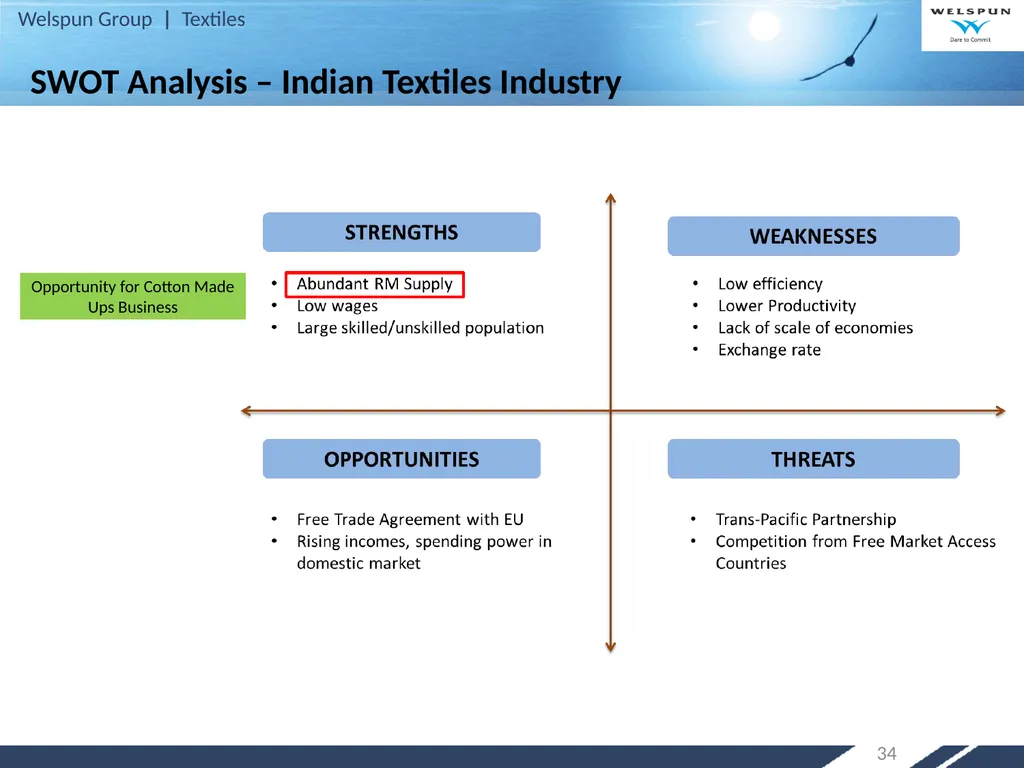
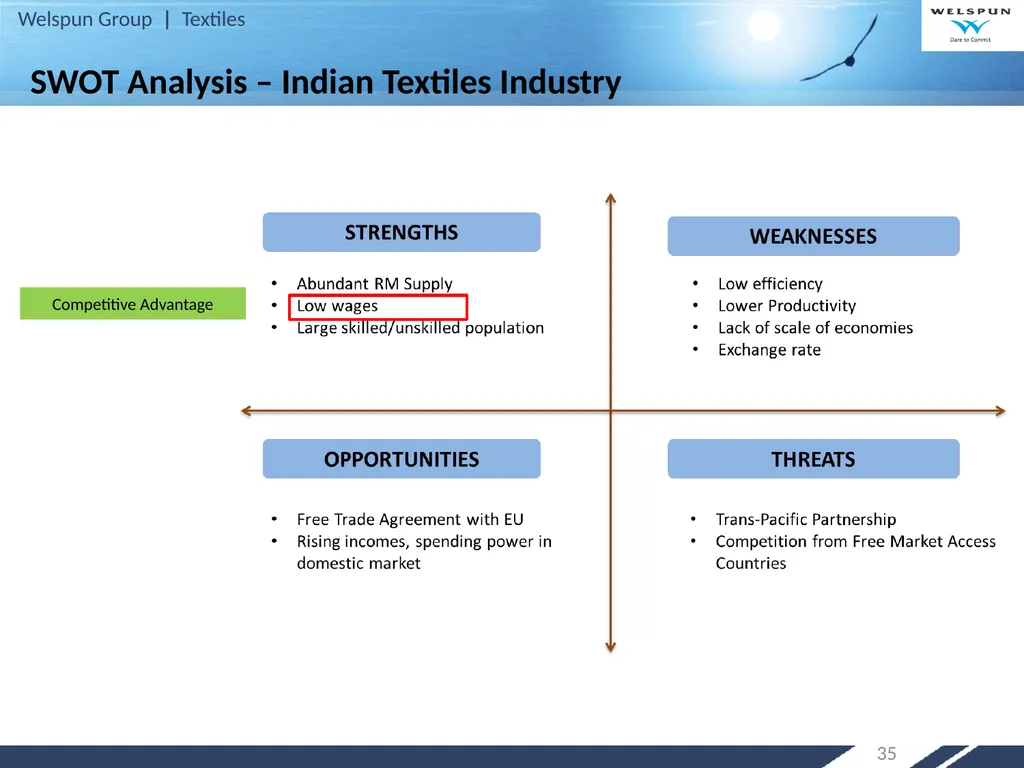
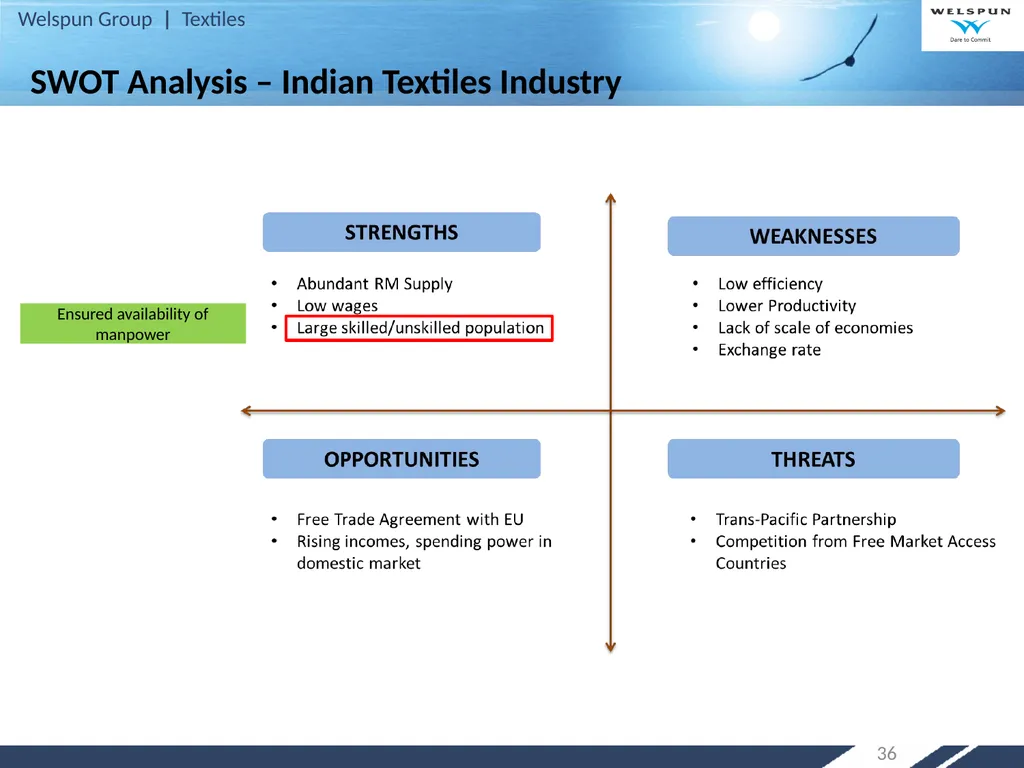
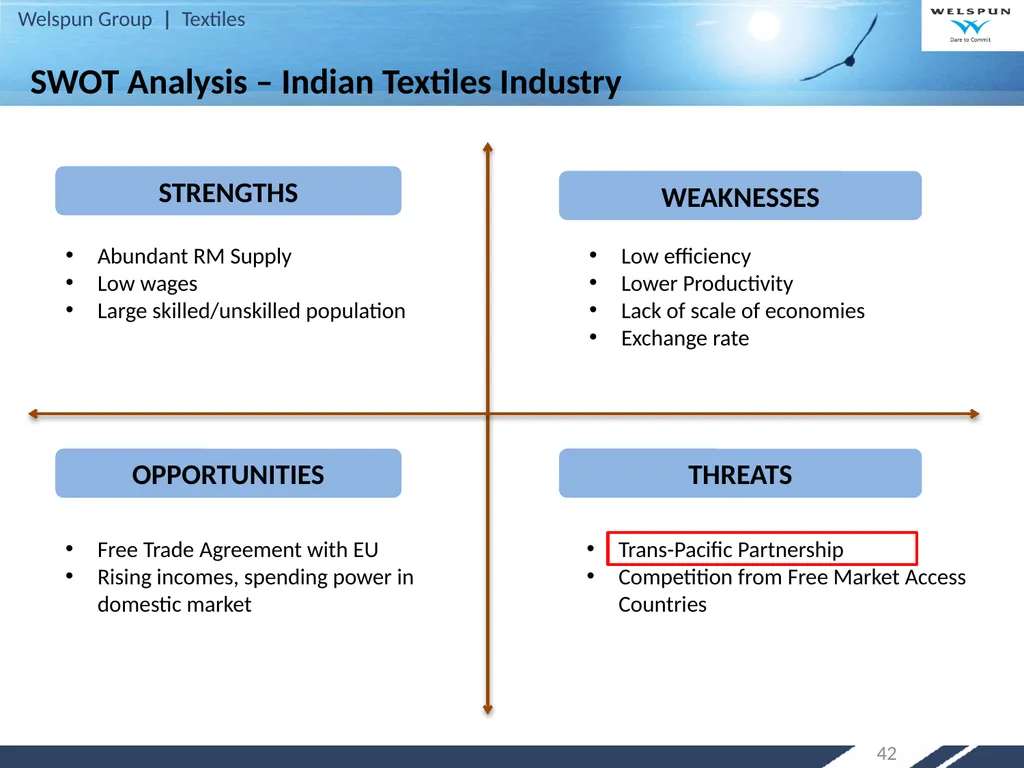
slide33. 33 SWOT Analysis – Indian Textiles Industry Abundant RM Supply
Low wages
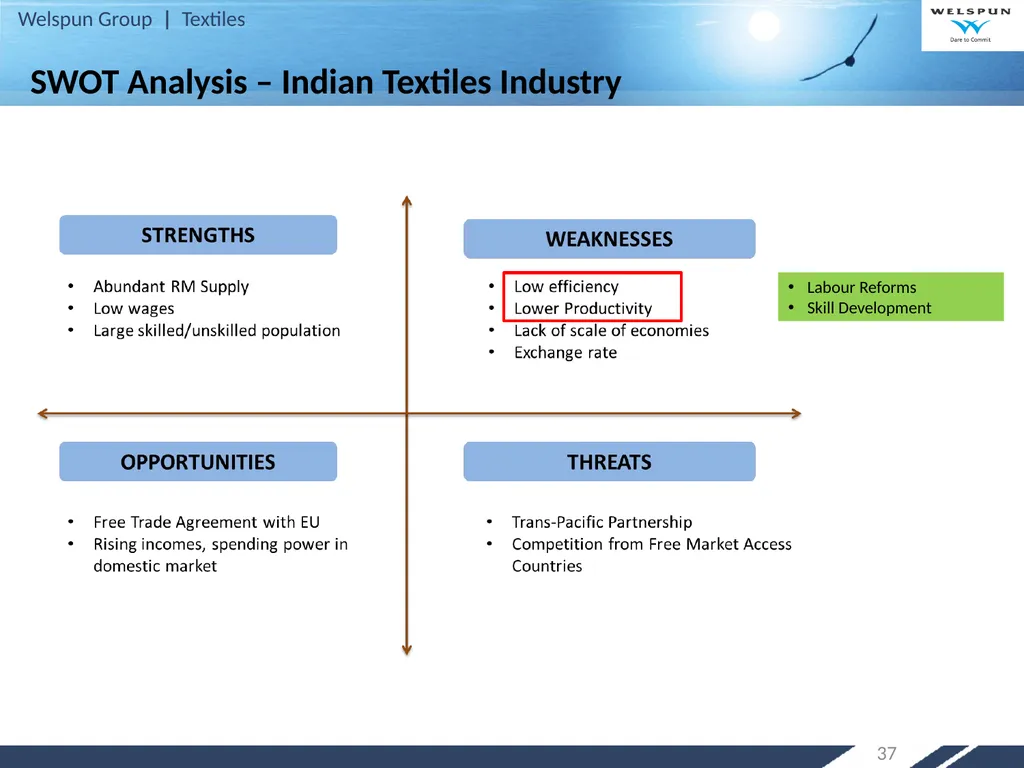
Large skilled/unskilled population STRENGTHS THREATS OPPORTUNITIES WEAKNESSES Low efficiency
Lower Productivity
Lack of scale of economies
Exchange rate Trans-Pacific Partnership
Competition from Free Market Access Countries Free Trade Agreement with EU
Rising incomes, spending power in domestic market<br>
slide34. 34 Opportunity for Cotton Made Ups Business SWOT Analysis – Indian Textiles Industry<br>
slide35. 35 Competitive Advantage SWOT Analysis – Indian Textiles Industry<br>
slide36. 36 Ensured availability of manpower SWOT Analysis – Indian Textiles Industry<br>
slide37. 37 Labour Reforms
Skill Development SWOT Analysis – Indian Textiles Industry<br>
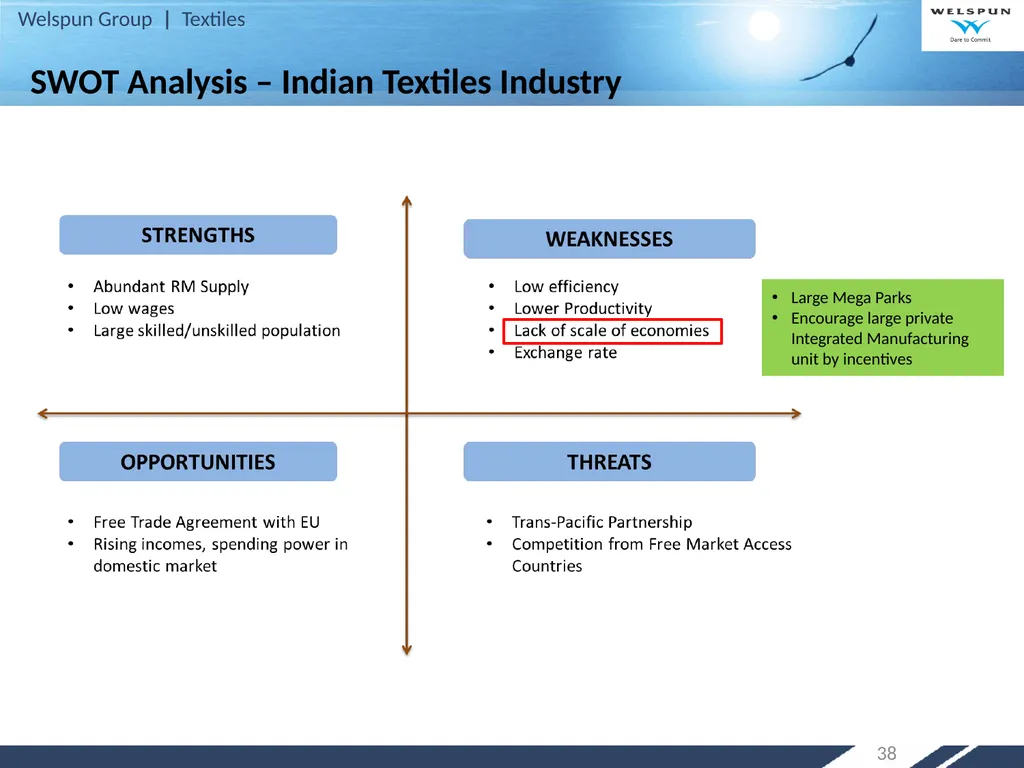
slide38. 38 Large Mega Parks
Encourage large private Integrated Manufacturing unit by incentives SWOT Analysis – Indian Textiles Industry<br>
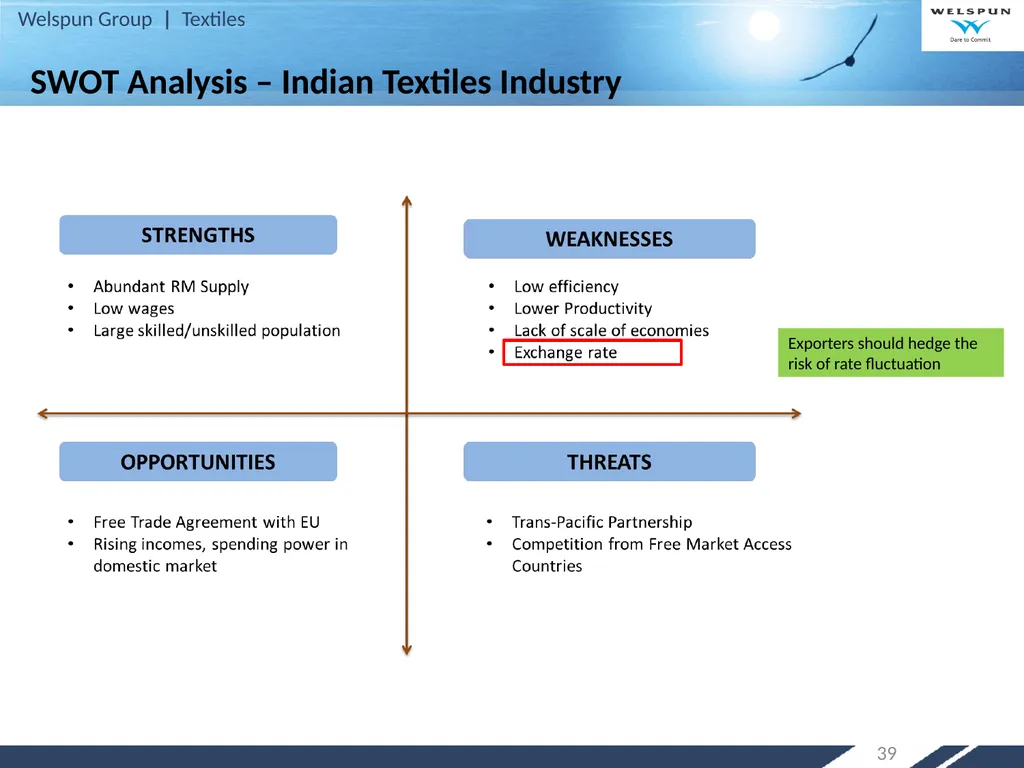
slide39. 39 Exporters should hedge the risk of rate fluctuation SWOT Analysis – Indian Textiles Industry<br>
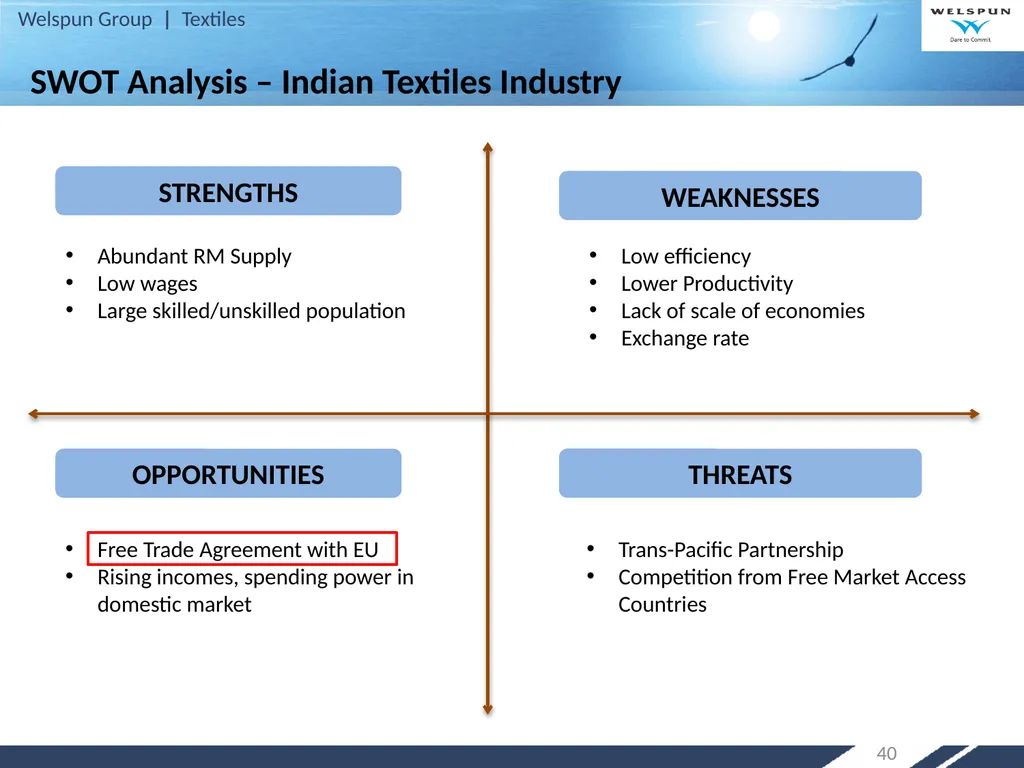
slide40. 40 SWOT Analysis – Indian Textiles Industry Abundant RM Supply
Low wages
Large skilled/unskilled population STRENGTHS THREATS OPPORTUNITIES WEAKNESSES Low efficiency
Lower Productivity
Lack of scale of economies
Exchange rate Trans-Pacific Partnership
Competition from Free Market Access Countries Free Trade Agreement with EU
Rising incomes, spending power in domestic market<br>
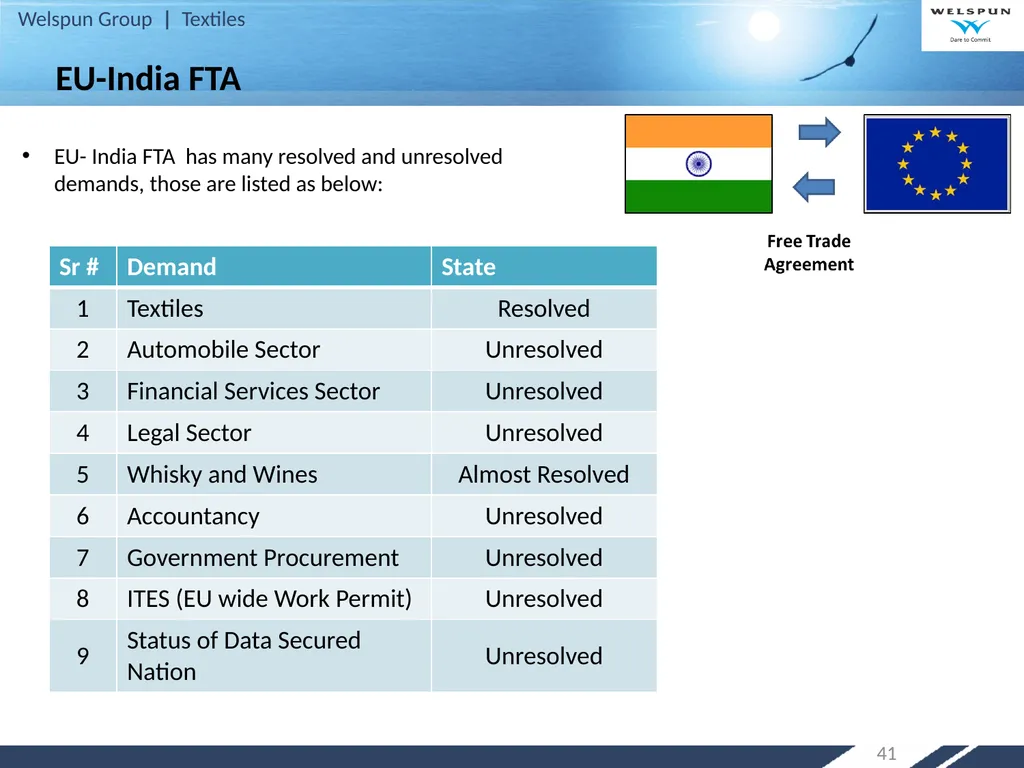
slide41. 41 EU- India FTA has many resolved and unresolved demands, those are listed as below: EU-India FTA<br>
slide42. 42 SWOT Analysis – Indian Textiles Industry Abundant RM Supply
Low wages
Large skilled/unskilled population STRENGTHS THREATS OPPORTUNITIES WEAKNESSES Low efficiency
Lower Productivity
Lack of scale of economies
Exchange rate Trans-Pacific Partnership
Competition from Free Market Access Countries Free Trade Agreement with EU
Rising incomes, spending power in domestic market<br>
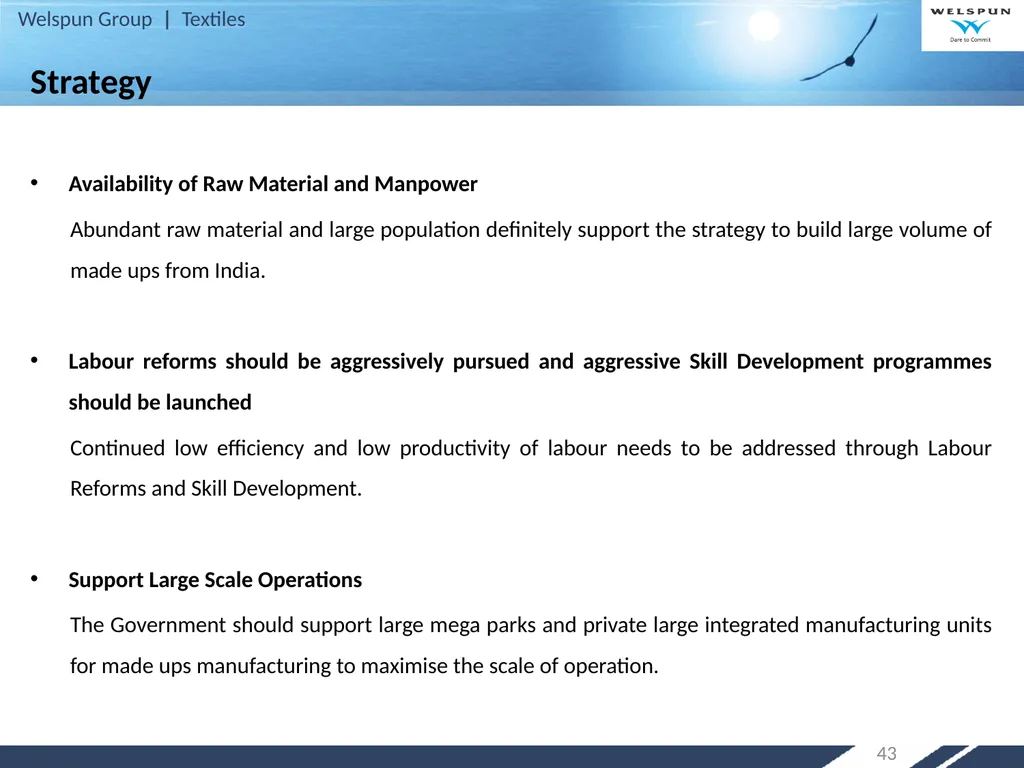
slide43. Strategy Availability of Raw Material and Manpower
Abundant raw material and large population definitely support the strategy to build large volume of made ups from India.
Labour reforms should be aggressively pursued and aggressive Skill Development programmes should be launched
Continued low efficiency and low productivity of labour needs to be addressed through Labour Reforms and Skill Development.
Support Large Scale Operations
The Government should support large mega parks and private large integrated manufacturing units for made ups manufacturing to maximise the scale of operation. 43<br>
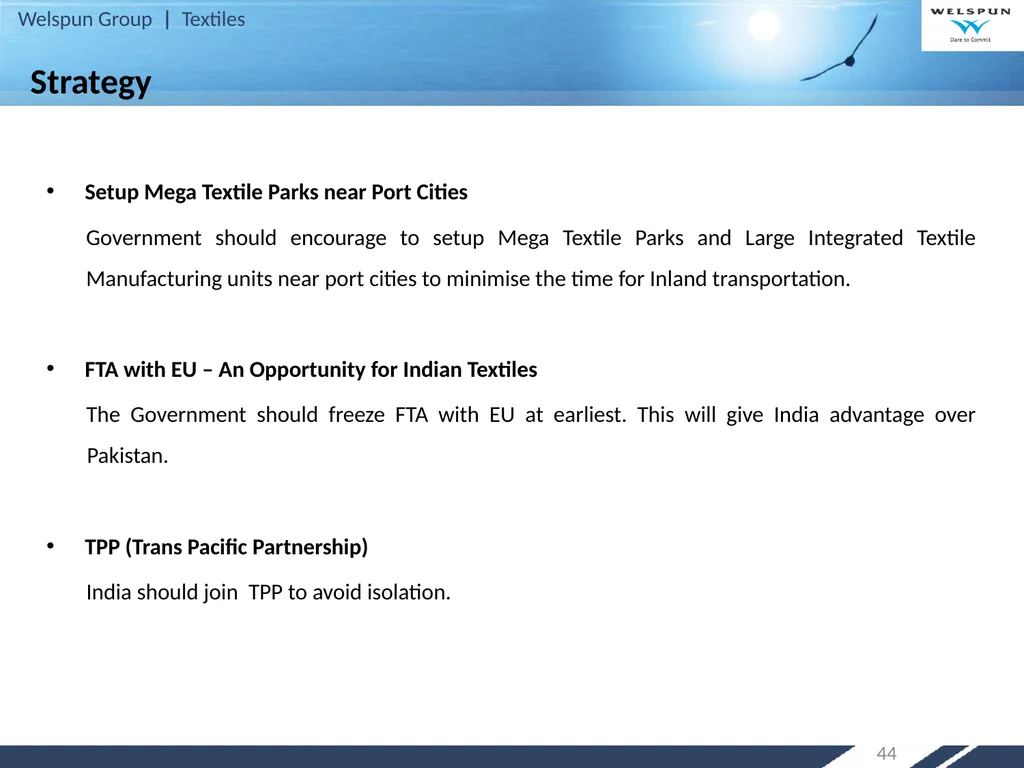
slide44. 44 Setup Mega Textile Parks near Port Cities
Government should encourage to setup Mega Textile Parks and Large Integrated Textile Manufacturing units near port cities to minimise the time for Inland transportation.
FTA with EU – An Opportunity for Indian Textiles
The Government should freeze FTA with EU at earliest. This will give India advantage over Pakistan.
TPP (Trans Pacific Partnership)
India should join TPP to avoid isolation. Strategy<br>
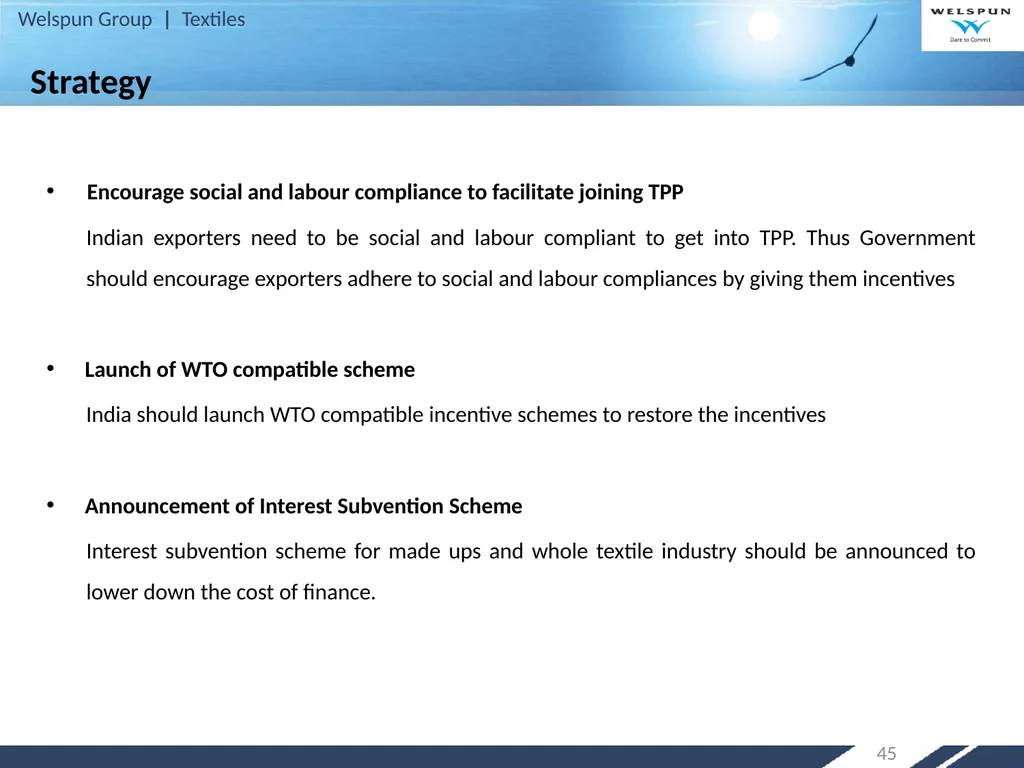
slide45. 45 Encourage social and labour compliance to facilitate joining TPP
Indian exporters need to be social and labour compliant to get into TPP. Thus Government should encourage exporters adhere to social and labour compliances by giving them incentives
Launch of WTO compatible scheme
India should launch WTO compatible incentive schemes to restore the incentives
Announcement of Interest Subvention Scheme
Interest subvention scheme for made ups and whole textile industry should be announced to lower down the cost of finance. Strategy<br>
slide46. Thank you !! 46<br>
slide2. Significance of 2015 for Global Textile Industry Emergence of Quota Free World – 1st January, 2005
It’s a decade of Quota Free World. 2<br>
slide3. 3 Consuming World and Producing World Consuming Countries Producing Countries<br>
slide4. 4 Global Share of Textile & Made Ups Exports (Excluding Apparel) China has emerged as most competent Textile Economy in Quota Free World. Value of Exports - US$ 218 bn Value of Exports - US$ 338 bn Source: UN Comtrade, Wisedge Analysis<br>
slide5. 5 6.6% CAGR 5.9% CAGR US$ bn Global Textile Market Global textile and apparel trade recovered in 2013 and is expected to grow @ 6.6% for next 7 years and reach a size of US$ 1.18 trillion by 2020 Source: UN Comtrade, CII Knowledge report and Wisedge Analysis<br>
slide6. 6 Home textiles / made-ups trade has grown at a steady pace with bed linen having the highest trade share and higher growth in Blankets Steady Growth in Made Ups Global Trade Source: UN Comtrade *Data for 2013 and 2014 is being extrapolated on the basis of CAGR 2005-12<br>
slide7. 7 Made Ups Exports Leadership - FY2012-13<br>
slide8. 8 China’s GDP Per Capita GDP per capita is gross domestic product divided by midyear population. GDP is the sum of gross value added by all resident producers in the economy plus any product taxes and minus any subsidies not included in the value of the products. It is calculated without making deductions for depreciation of fabricated assets or for depletion and degradation of natural resources. Data are in current U.S. dollars. Source: worldbank.org<br>
slide9. Agenda Learning from China’s Strategy
Shifting International Trade Pattern
India’s Strategy 9<br>
slide10. Agenda Learning from China’s Strategy
Shifting International Trade Pattern
India’s Strategy 10<br>
slide11. 11 Comparison of GDP Per Capita GDP per capita is gross domestic product divided by midyear population. GDP is the sum of gross value added by all resident producers in the economy plus any product taxes and minus any subsidies not included in the value of the products. It is calculated without making deductions for depreciation of fabricated assets or for depletion and degradation of natural resources. Data are in current U.S. dollars. Source: worldbank.org<br>
slide12. China – 2005 to 2015 Global Hub for manufacturing
World’s largest manufacturing economy
World’s largest exporters of the goods [$2.34 trillion (2014)]
World’s largest economy by purchasing power parity (PPP) [$19.230 trillion (PPP; 2014)]
Second largest importer in of goods [$1.96 trillion (2014)]
GDP - $9.24027 trillion (current US$, 2013)
GDP per Capita - $6,807 (current US$, 2013)
Average Growth Rate - 10% (over past 30 years)
Population below poverty line - 6.1% (2013)
Labour Force - 787.6 million (2012)
Unemployment - 4.1% (Q2, 2014) 12 Source: worldbank.org, www.wikipedia.org<br>
slide13. To build-on the strength of the large population, a low skill industry to alleviate poverty and to build infrastructure for future value added high-tech manufacturing. 13 China’s Game Plan<br>
slide14. China’s Strategy Aggressively Adjusting Industry Structure
China government made some aggressive decisions and executed them in disciplined way.
Artificially Undervalued Currency
In 2005, China held Renminbi (Yuan) at undervalued rate by pegging it to USD.
This led to improve competitiveness of Chinese textile exporters.
FDI
Increased flow of Foreign Direct Investment by foreign companies established through Joint Ventures employed investments on machines, plant, technology and skills.
Location of parks near Coast Line
Textile parks are located near coast line to strengthen supply chain
Economies of Scale
Large scale manufacturing unit to gain economies of scale 14<br>
slide15. China’s Strategy Improve Competence by Shifting Focus from Pricing to Costing
Low price points to gain market share
Focus on Total Costs Superiority
Efforts was made to reduce all the cost elements such as labour cost, cost of materials etc.
Compliance of Social and Labour Standards
Adherence to compliances like social responsibility, child labour, health and safety,
e.g. SA 8000 widely adopted by Industry.
Strengthen Supply Chain
Focus on making an efficient system and optimum resource allocation
Enlarge market, build up more marketing channels and gain controlling right in global supply chain.
Development of Industrial Parks near coastal area. 15<br>
slide16. Aggressive Skill Development Programme
Vocational and Education training integration with Schooling.
Stipend programme for Secondary School Education in rural areas
Regulations in Law such as “Citizens shall have the right to receive vocational education.” 16 China’s Strategy<br>
slide17. 17 VET System in China – School and Outside school system Employment Training Centre
Private Training Centre
Enterprise sponsored Training Centre Vocational Senior Secondary
Regular Specialised Secondary
Adult Specialised Secondary
Skilled worker / Technical Schools Junior vocational/specialised colleges
Technician colleges
Polytechnic colleges Senior Skilled
Workers School Employment Skill Development: The Chinese Model<br>
slide18. 18 Number of Vocational Training Institutions and Trainees in 2006 Source: www.ccsenet.org, International Business Research, Vol.1- No.3, 2008<br>
slide19. 19 Sources of Educational Funds 1956.18 bn Yuan = INR 19,75,742 Crores [@ Exchange rate – 1 CNY = 10.1 INR] Source: www.ccsenet.org, International Business Research, Vol.1- No.3, 2008 Year 2010<br>
slide20. Agenda Learning from China’s Strategy
Shifting International Trade Pattern
India’s Strategy 20<br>
slide21. Shifting International Trade Pattern After setting the trade free from quantitative (quota) restrictions, USA and EU have tried to influence the trade by creating trade blocks and preferential access by means import duties.
USA, EU and Japan traditionally had threat perception about each other ……. For the first time these three are joining hands for trade.
TPP (Trans Pacific Partnership) (12 Countries)
Australia, Brunei, Canada, Chile, Japan, Malaysia, Mexico, New Zealand, Peru, Singapore, USA and Vietnam
TPP covers product standards and …..
Intellectual Property rights, FDI, Competition policy, Environment, Labour, State owned Enterprise policies, E-commerce, Govt. Procurement, Technical Barriers to trade, transparency in Health care technologies and pharmaceuticals regulatory coherence. 21<br>
slide22. 22 TPP controls over 35% of World Trade (Over 50% along with TIPP).
The Countries outside TPP will suffer loss of market access due to non tariff measures.
TPP is likely to be “Yarn Forward” ROO (Rules of Origin Agreement).
The Chinese Textile Industry is shifting base to Vietnam.
TIPP (Trans Atlantic Trade and Investment Partnership)
USA and EU
RCEP (Regional Comprehensive Economic Partnership) (16 Countries)
China, Japan, South Korea, Australia, New Zealand , India, Brunei, Myanmar, Cambodia, Indonesia, Laos, Malaysia, Philippines , Singapore, Thailand and Vietnam
GSP+ by EU to Pakistan
Huge disadvantage for India as need to face loss of 9.6 to 10% Shifting International Trade Pattern<br>
slide23. 23 EU- India FTA being discussed for a long time.
Major beneficiary is going to Textiles & Apparels sector.
It will help Indian Textile Products become cost competitive w.r.t. other competing countries like Pakistan, Bangladesh & Vietnam Job Creation Rise in Trade Purchasing Power New Investment It is projected that once the FTA is signed, Indian Textiles & Apparels exports are set to increase by US $ 5 Bn. Free Trade Agreement EU-India FTA<br>
slide24. Brunei
Malaysia
Singapore
Vietnam Indonesia,
Philippines, India
Thailand, Laos
Myanmar
Cambodia TPP
Canada
Chile
Mexico
Peru RCEP
China USA Various FTAs Vietnam is the only Garment Producing country.
If TPP comes into force then Vietnam will have a preferred access to US market.
China is likely to use this opportunity by migrating
textile industry to Vietnam Vietnam India Australia
Japan
New Zealand
Malaysia TPP – Trans Pacific Agreement
TIPP – Trans Atlantic Trade and Investment Partnership
RCEP - Regional Comprehensive Economic Partnership
AIFTA – ASEAN – India Free Trade Area<br>
slide25. 25 India’s Position in Global Market 2nd
Largest Employer in India. Employs around 35 Mn workforce 14.1%
Contribution to Industrial Production of country. 4%
Contribution to India’s GDP 17%
Contribution to Exports Earnings FY12-13 22% of World Spindles Capacity Highest # looms in World World’s # 1 Producer of Jute World’s # 2 Producer of Silk World’s # 1 Producer of Cotton 25<br>
slide26. 26 India's Textile & Apparel Exports 2013-14 (%) Source: Office of Textile Commissioner Apparel constitutes about 40% of India’s textile exports, whereas Made Ups at 12%<br>
slide27. Individual Product Cost Key elements such as Raw material, Labour, Power , waster and Steam cost contributes more than 74% of cost of the product.<br>
slide28. 28 Source: Texprocil Benchmarking Report Utility cost comparison Comparison with Competitors in 2012<br>
slide29. 29 `` `` `` `` `` Source: Texprocil Benchmarking Report As India is not competitive in utilities, need to concentrate on improvement of these areas through Skill Development, Labour Reforms, Government support. Utility cost comparison Comparison with Competitors in 2012<br>
slide30. Agenda Learning from China’s Strategy
Shifting International Trade Pattern
India’s Strategy 30<br>
slide31. India’s Strategy India need to build a strategy to capture maximum share in consuming world i. e. US and Europe.
India needs to take cognizance of shifting global trade patterns
due to various FTAs 31<br>
slide32. Adverse Factors Vanishing Export Incentives due to GST implementation and WTO compliance.
Higher cost of Finance because discontinuation of interest subvention scheme.
Continues to have low labour efficiency and productivity compared to China.
Continues to be poor deficient so have no scope for low power rates. 32<br>
slide33. 33 SWOT Analysis – Indian Textiles Industry Abundant RM Supply
Low wages
Large skilled/unskilled population STRENGTHS THREATS OPPORTUNITIES WEAKNESSES Low efficiency
Lower Productivity
Lack of scale of economies
Exchange rate Trans-Pacific Partnership
Competition from Free Market Access Countries Free Trade Agreement with EU
Rising incomes, spending power in domestic market<br>
slide34. 34 Opportunity for Cotton Made Ups Business SWOT Analysis – Indian Textiles Industry<br>
slide35. 35 Competitive Advantage SWOT Analysis – Indian Textiles Industry<br>
slide36. 36 Ensured availability of manpower SWOT Analysis – Indian Textiles Industry<br>
slide37. 37 Labour Reforms
Skill Development SWOT Analysis – Indian Textiles Industry<br>
slide38. 38 Large Mega Parks
Encourage large private Integrated Manufacturing unit by incentives SWOT Analysis – Indian Textiles Industry<br>
slide39. 39 Exporters should hedge the risk of rate fluctuation SWOT Analysis – Indian Textiles Industry<br>
slide40. 40 SWOT Analysis – Indian Textiles Industry Abundant RM Supply
Low wages
Large skilled/unskilled population STRENGTHS THREATS OPPORTUNITIES WEAKNESSES Low efficiency
Lower Productivity
Lack of scale of economies
Exchange rate Trans-Pacific Partnership
Competition from Free Market Access Countries Free Trade Agreement with EU
Rising incomes, spending power in domestic market<br>
slide41. 41 EU- India FTA has many resolved and unresolved demands, those are listed as below: EU-India FTA<br>
slide42. 42 SWOT Analysis – Indian Textiles Industry Abundant RM Supply
Low wages
Large skilled/unskilled population STRENGTHS THREATS OPPORTUNITIES WEAKNESSES Low efficiency
Lower Productivity
Lack of scale of economies
Exchange rate Trans-Pacific Partnership
Competition from Free Market Access Countries Free Trade Agreement with EU
Rising incomes, spending power in domestic market<br>
slide43. Strategy Availability of Raw Material and Manpower
Abundant raw material and large population definitely support the strategy to build large volume of made ups from India.
Labour reforms should be aggressively pursued and aggressive Skill Development programmes should be launched
Continued low efficiency and low productivity of labour needs to be addressed through Labour Reforms and Skill Development.
Support Large Scale Operations
The Government should support large mega parks and private large integrated manufacturing units for made ups manufacturing to maximise the scale of operation. 43<br>
slide44. 44 Setup Mega Textile Parks near Port Cities
Government should encourage to setup Mega Textile Parks and Large Integrated Textile Manufacturing units near port cities to minimise the time for Inland transportation.
FTA with EU – An Opportunity for Indian Textiles
The Government should freeze FTA with EU at earliest. This will give India advantage over Pakistan.
TPP (Trans Pacific Partnership)
India should join TPP to avoid isolation. Strategy<br>
slide45. 45 Encourage social and labour compliance to facilitate joining TPP
Indian exporters need to be social and labour compliant to get into TPP. Thus Government should encourage exporters adhere to social and labour compliances by giving them incentives
Launch of WTO compatible scheme
India should launch WTO compatible incentive schemes to restore the incentives
Announcement of Interest Subvention Scheme
Interest subvention scheme for made ups and whole textile industry should be announced to lower down the cost of finance. Strategy<br>
slide46. Thank you !! 46<br>