
Stream network analysis Wolfgang Schwanghart
Description: Stream network analysis Wolfgang Schwanghart STREAMobj Terminology Structure Constructor function Modifying streams Plotting Node attribute list Terminology channelhead confluence outlet node, vertex edge, arc tree or (strongly) connected
Related Topics
Download Presentation
"Stream network analysis Wolfgang Schwanghart" is the property of its rightful owner. Permission is granted to download and print the materials on this website for personal, non-commercial use only, and to display it on your personal computer provided you do not modify the materials and that you retain all copyright notices contained in the materials. By downloading content from our website, you accept the terms of this agreement.
Presentation Transcript
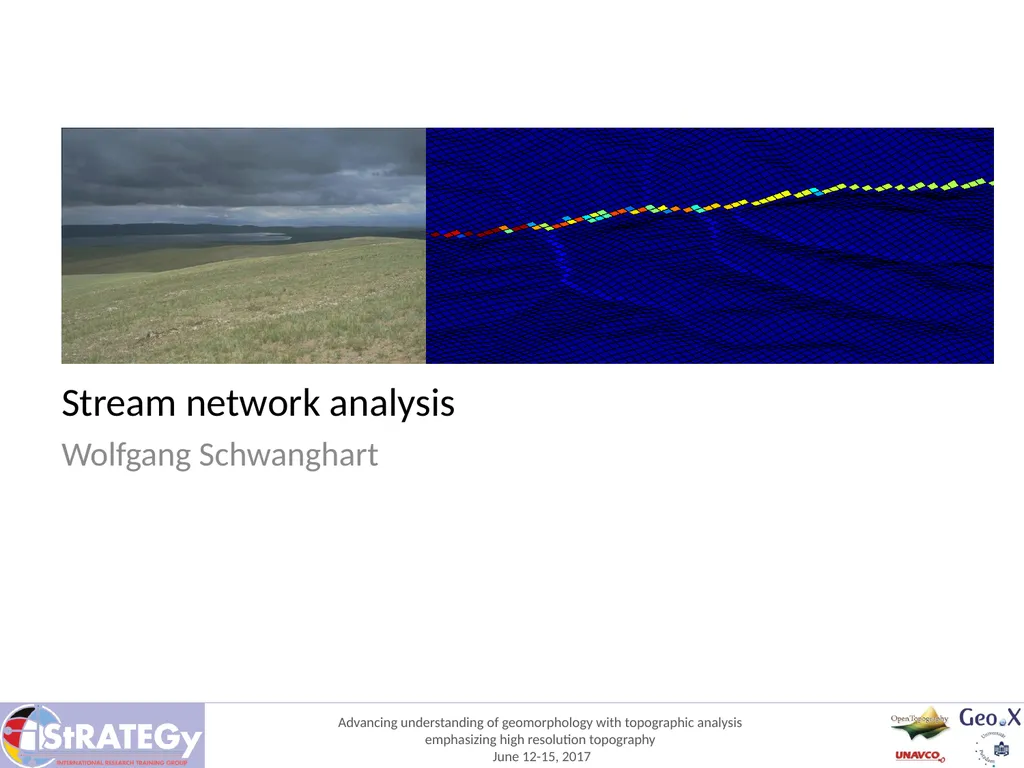
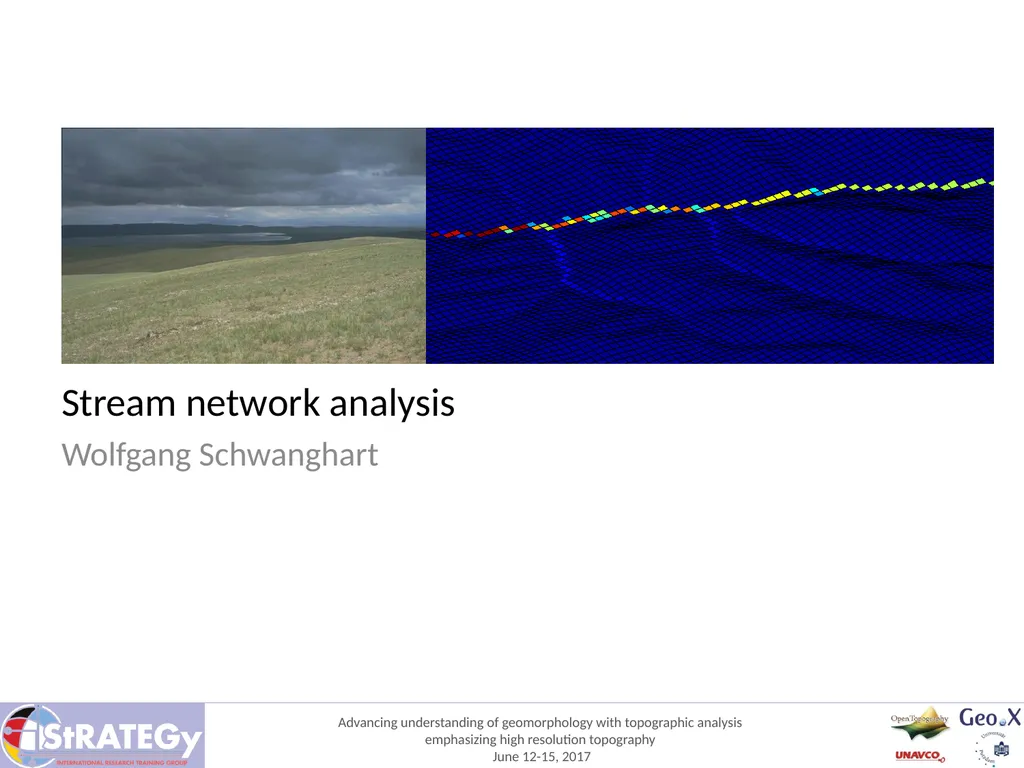
slide1. Stream network analysis Wolfgang Schwanghart<br>
slide2. STREAMobj Terminology
Structure
Constructor function
Modifying streams
Plotting
Node attribute list<br>
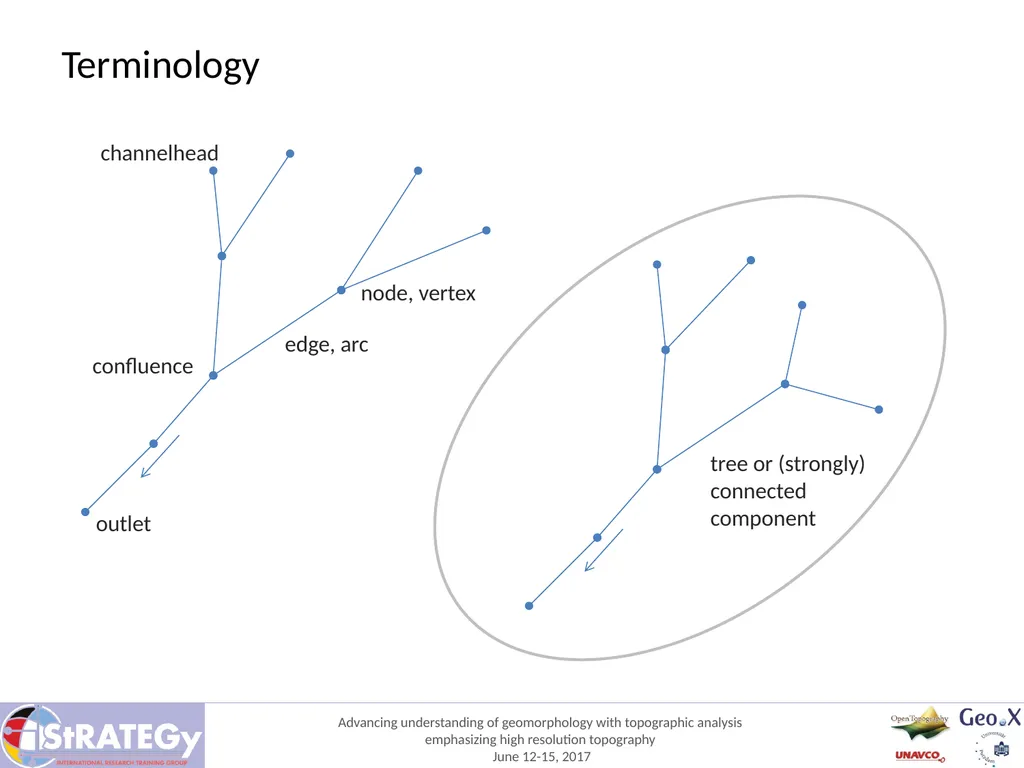
slide3. Terminology channelhead confluence outlet node, vertex edge, arc tree or (strongly) connected
component<br>
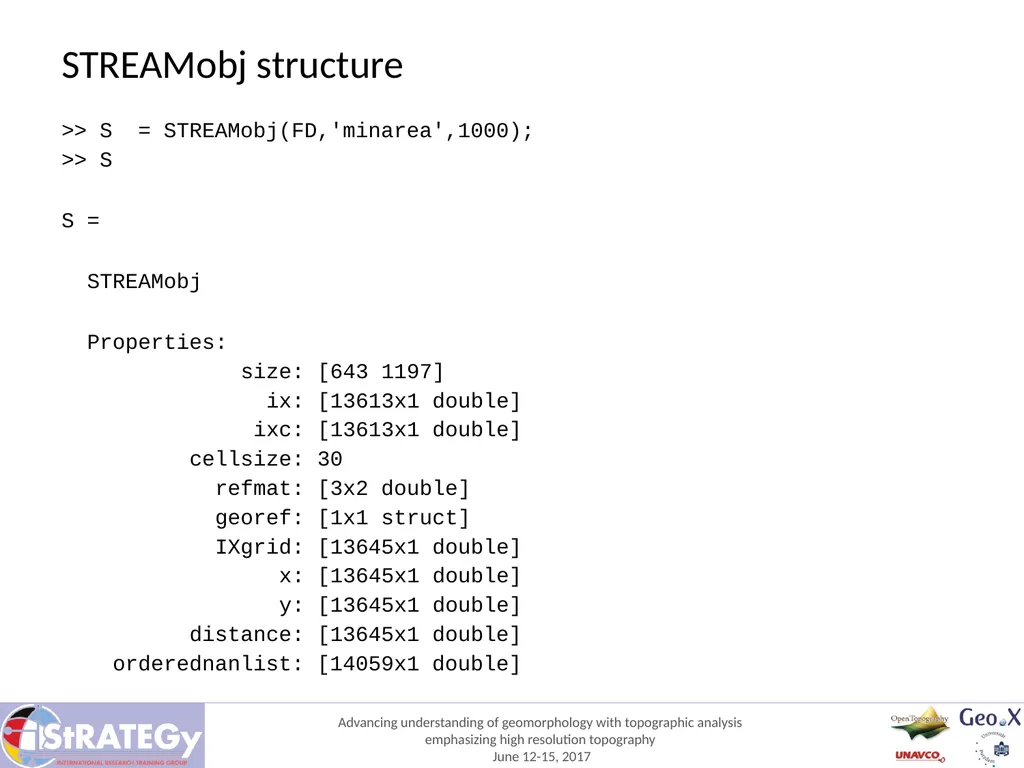
slide4. STREAMobj structure >> S = STREAMobj(FD,'minarea',1000);
>> S
S =
STREAMobj
Properties:
size: [643 1197]
ix: [13613x1 double]
ixc: [13613x1 double]
cellsize: 30
refmat: [3x2 double]
georef: [1x1 struct]
IXgrid: [13645x1 double]
x: [13645x1 double]
y: [13645x1 double]
distance: [13645x1 double]
orderednanlist: [14059x1 double]<br>
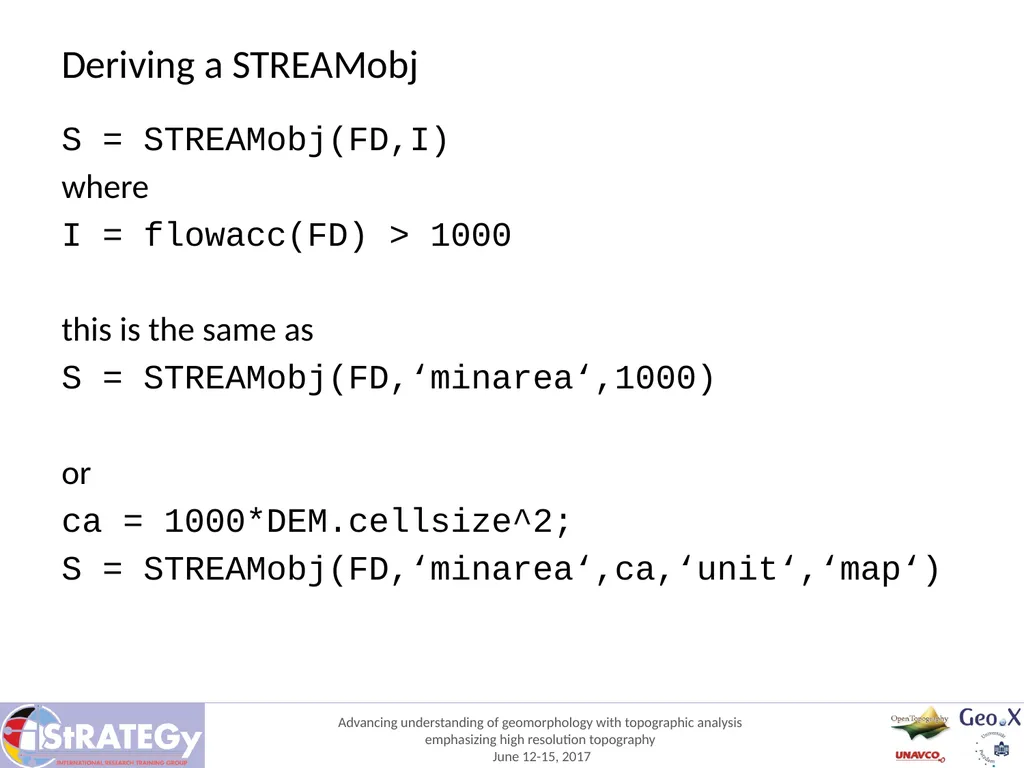
slide5. Deriving a STREAMobj S = STREAMobj(FD,I)
where
I = flowacc(FD) > 1000
this is the same as
S = STREAMobj(FD,‘minarea‘,1000)
or
ca = 1000*DEM.cellsize^2;
S = STREAMobj(FD,‘minarea‘,ca,‘unit‘,‘map‘)<br>
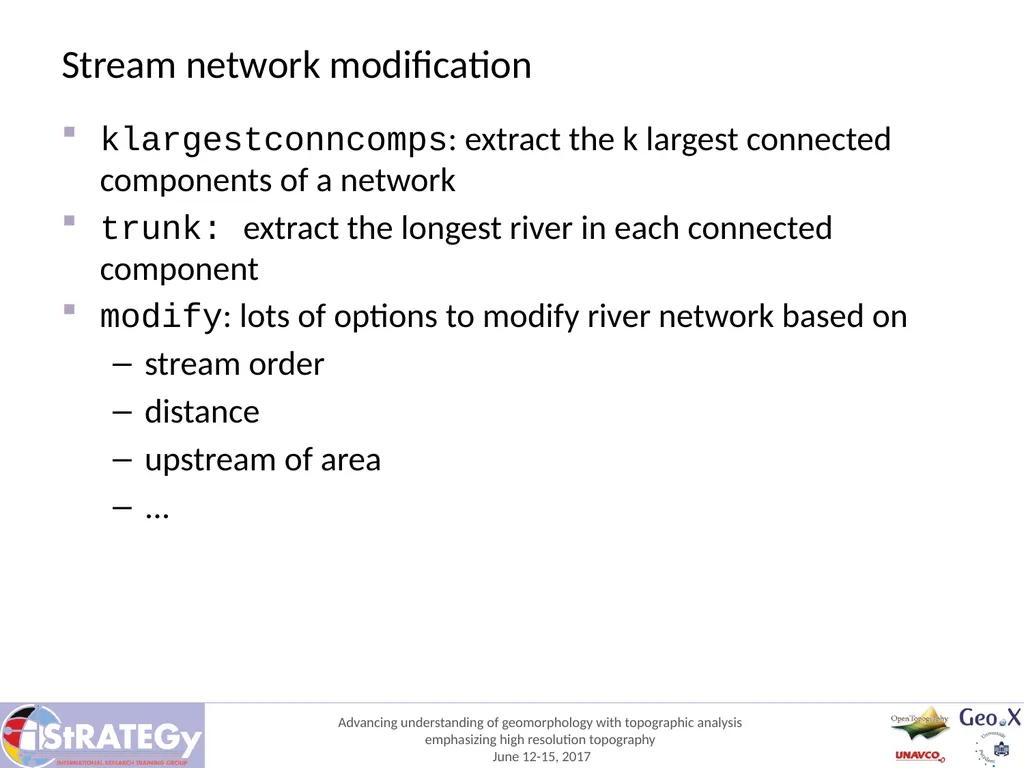
slide6. Stream network modification klargestconncomps: extract the k largest connected components of a network
trunk: extract the longest river in each connected component
modify: lots of options to modify river network based on
stream order
distance
upstream of area
...<br>
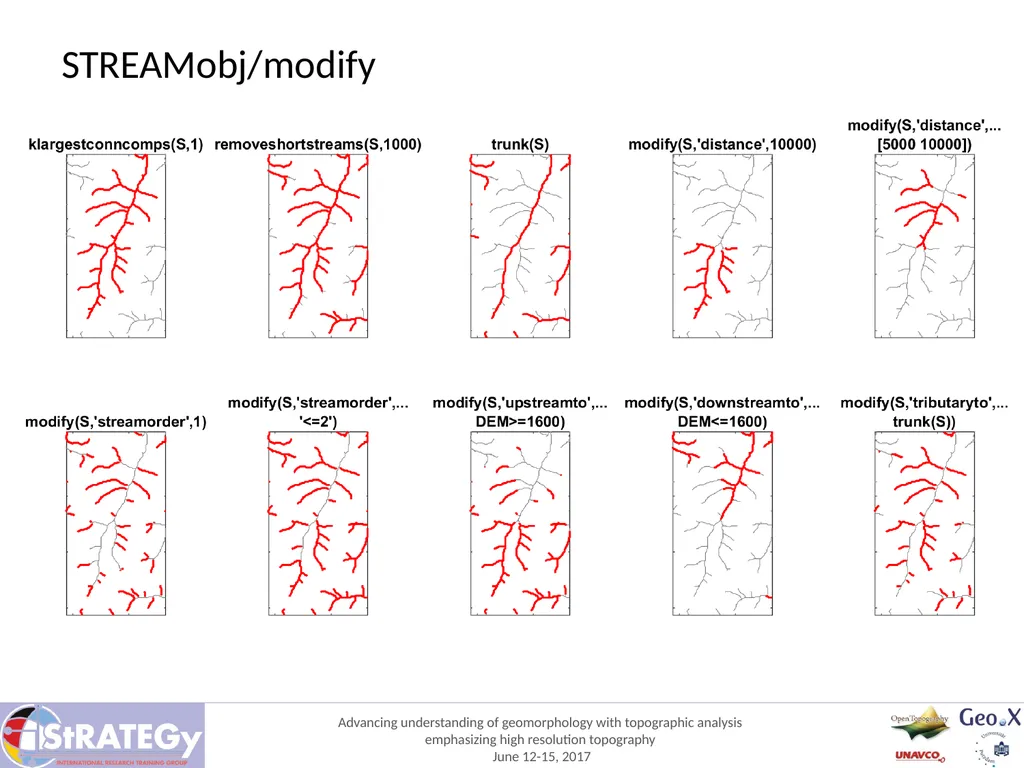
slide7. STREAMobj/modify<br>
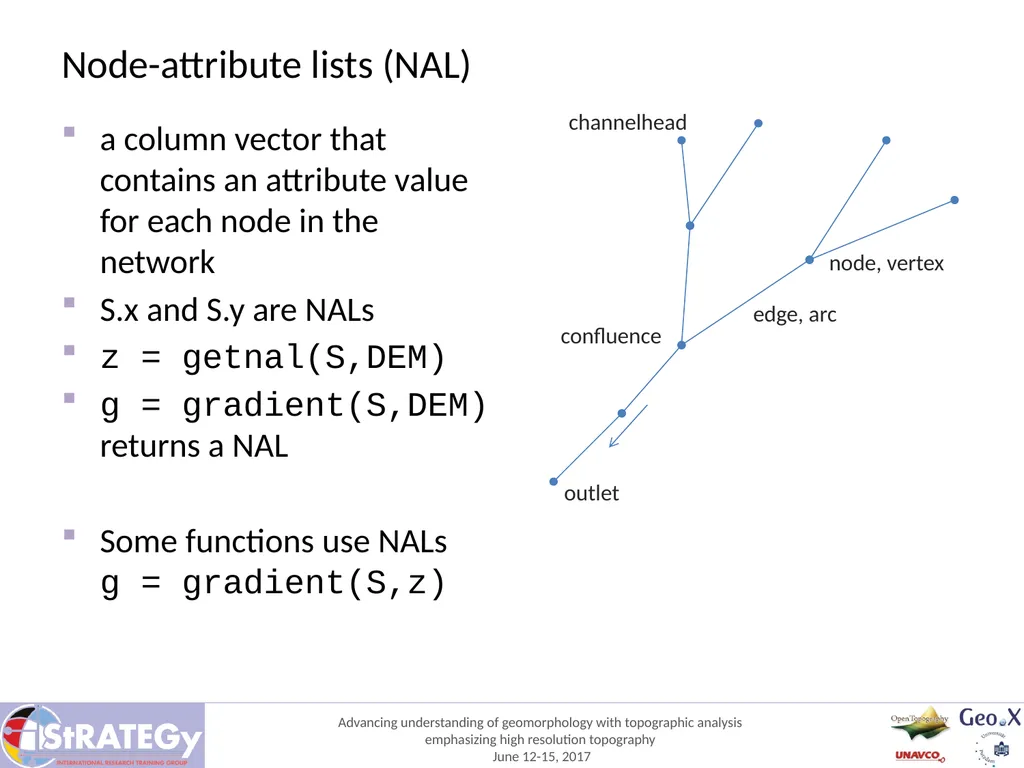
slide8. Node-attribute lists (NAL) a column vector that contains an attribute value for each node in the network
S.x and S.y are NALs
z = getnal(S,DEM)
g = gradient(S,DEM) returns a NAL
Some functions use NALs g = gradient(S,z) channelhead confluence outlet node, vertex edge, arc<br>
slide9. Plotting plot(S): show planform patterns
plotc(S,DEM): show planform patterns with coloring based on GRIDobj or node-attribute list
plot3(S,DEM): 3D plot of network
plot3d(S,DEM): another 3D plot
plotdz(S,DEM): plot of stream network distance from the outlet vs. elevation
plotstreamorder(S)<br>
slide2. STREAMobj Terminology
Structure
Constructor function
Modifying streams
Plotting
Node attribute list<br>
slide3. Terminology channelhead confluence outlet node, vertex edge, arc tree or (strongly) connected
component<br>
slide4. STREAMobj structure >> S = STREAMobj(FD,'minarea',1000);
>> S
S =
STREAMobj
Properties:
size: [643 1197]
ix: [13613x1 double]
ixc: [13613x1 double]
cellsize: 30
refmat: [3x2 double]
georef: [1x1 struct]
IXgrid: [13645x1 double]
x: [13645x1 double]
y: [13645x1 double]
distance: [13645x1 double]
orderednanlist: [14059x1 double]<br>
slide5. Deriving a STREAMobj S = STREAMobj(FD,I)
where
I = flowacc(FD) > 1000
this is the same as
S = STREAMobj(FD,‘minarea‘,1000)
or
ca = 1000*DEM.cellsize^2;
S = STREAMobj(FD,‘minarea‘,ca,‘unit‘,‘map‘)<br>
slide6. Stream network modification klargestconncomps: extract the k largest connected components of a network
trunk: extract the longest river in each connected component
modify: lots of options to modify river network based on
stream order
distance
upstream of area
...<br>
slide7. STREAMobj/modify<br>
slide8. Node-attribute lists (NAL) a column vector that contains an attribute value for each node in the network
S.x and S.y are NALs
z = getnal(S,DEM)
g = gradient(S,DEM) returns a NAL
Some functions use NALs g = gradient(S,z) channelhead confluence outlet node, vertex edge, arc<br>
slide9. Plotting plot(S): show planform patterns
plotc(S,DEM): show planform patterns with coloring based on GRIDobj or node-attribute list
plot3(S,DEM): 3D plot of network
plot3d(S,DEM): another 3D plot
plotdz(S,DEM): plot of stream network distance from the outlet vs. elevation
plotstreamorder(S)<br>