
Supply Chain Drivers and Metrics 3 Learning

Description: Supply Chain Drivers and Metrics 3 Learning Objectives Describe key financial measures of firm performance. Identify the major drivers of supply chain performance. Discuss the role of each driver in creating strategic fit between the supply
Related Topics
Download Presentation
"Supply Chain Drivers and Metrics 3 Learning" is the property of its rightful owner. Permission is granted to download and print the materials on this website for personal, non-commercial use only, and to display it on your personal computer provided you do not modify the materials and that you retain all copyright notices contained in the materials. By downloading content from our website, you accept the terms of this agreement.
Presentation Transcript
slide1. Supply Chain Drivers and Metrics 3<br>
slide2. Learning Objectives Describe key financial measures of firm performance.
Identify the major drivers of supply chain performance.
Discuss the role of each driver in creating strategic fit between the supply chain strategy and the competitive strategy.
Define the key metrics that track the performance of the supply chain in terms of each driver.<br>
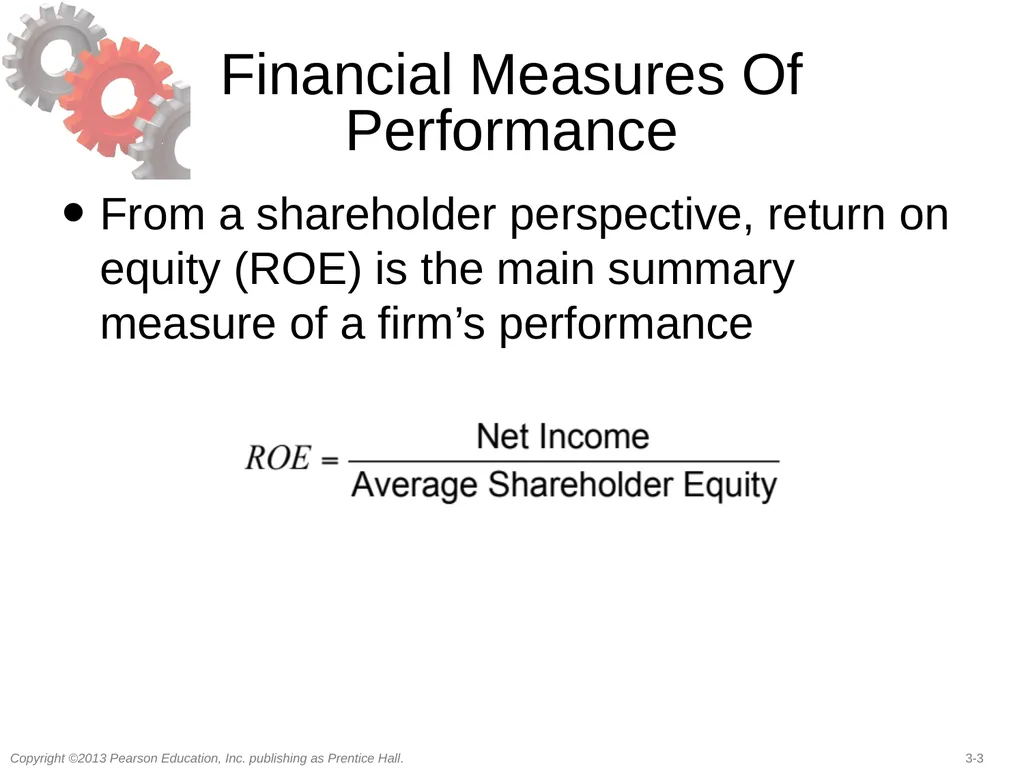
slide3. Financial Measures Of Performance From a shareholder perspective, return on equity (ROE) is the main summary measure of a firm’s performance<br>
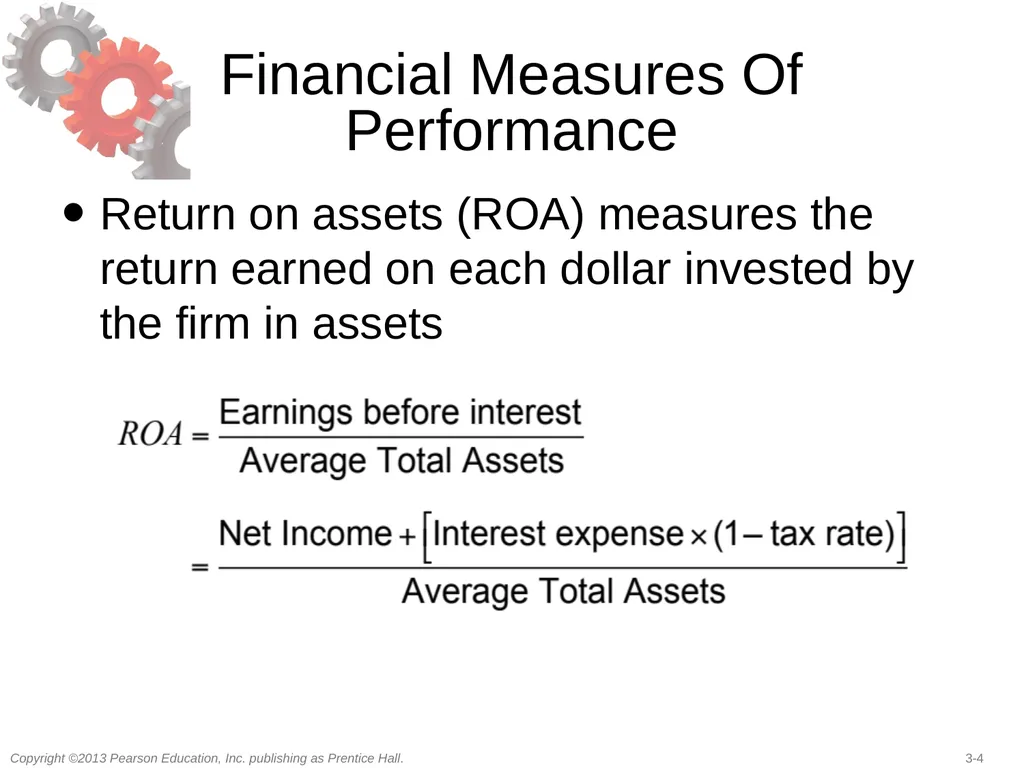
slide4. Financial Measures Of Performance Return on assets (ROA) measures the return earned on each dollar invested by the firm in assets<br>
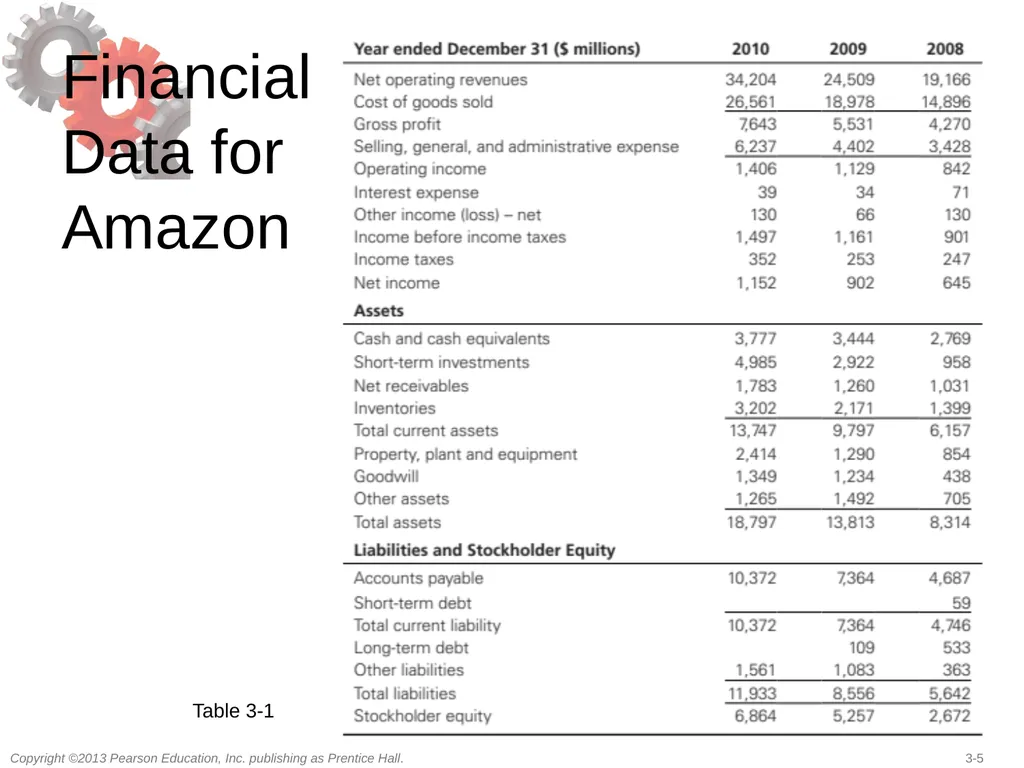
slide5. Financial Data for Amazon Table 3-1<br>
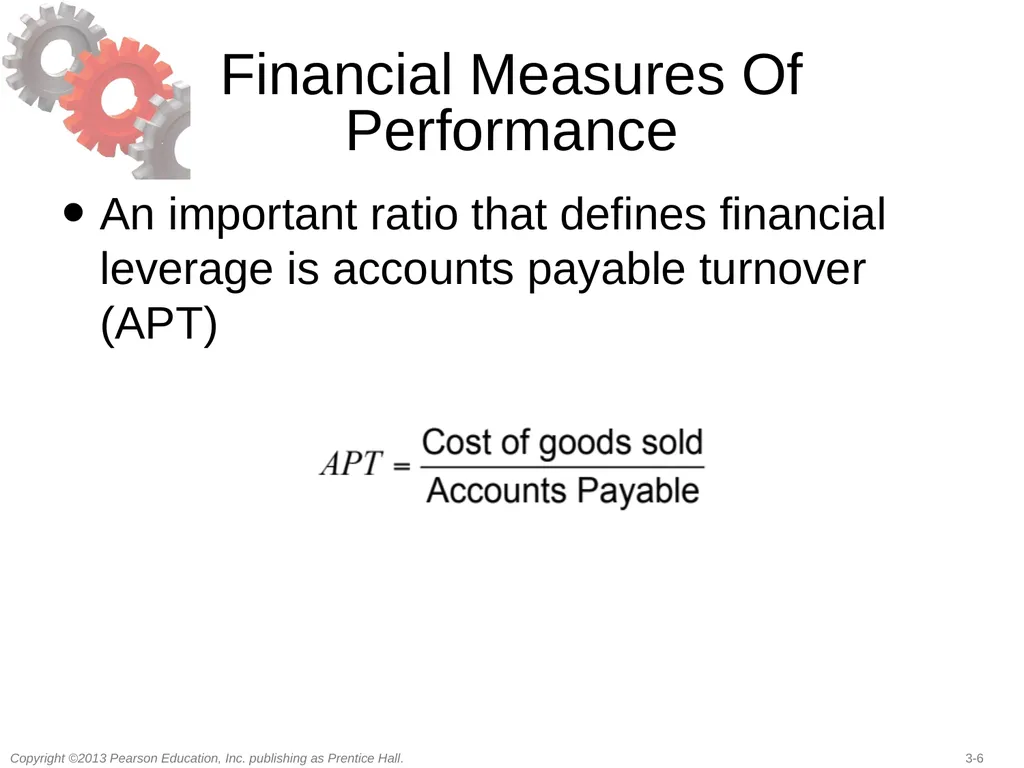
slide6. Financial Measures Of Performance An important ratio that defines financial leverage is accounts payable turnover (APT)<br>
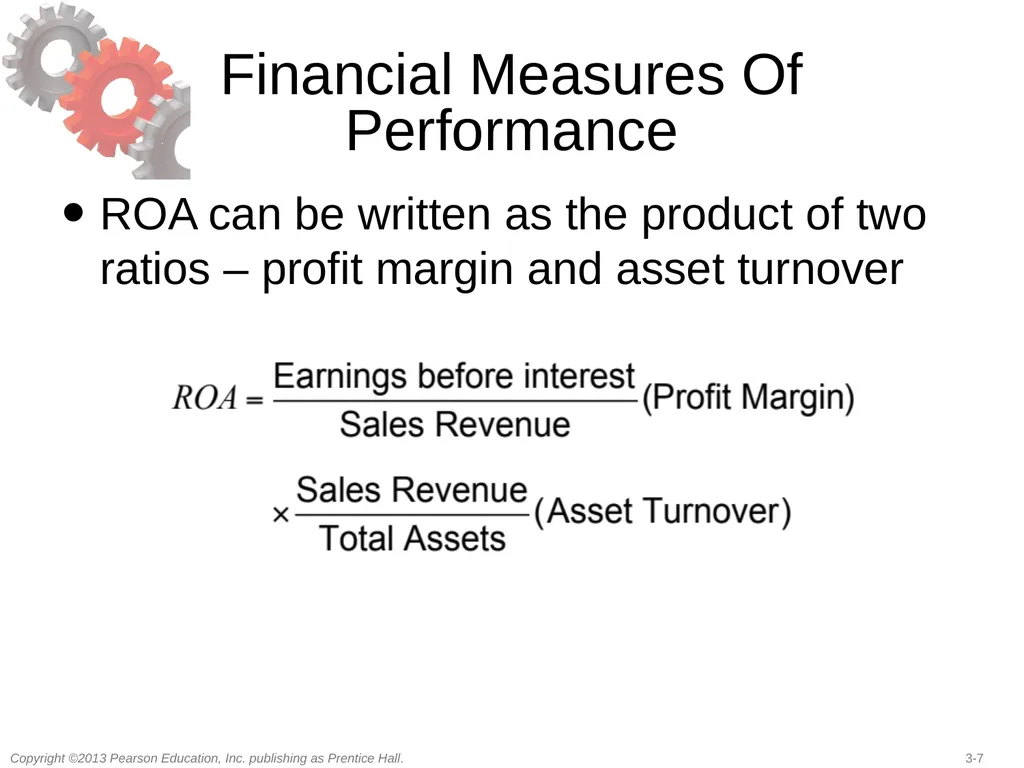
slide7. Financial Measures Of Performance ROA can be written as the product of two ratios – profit margin and asset turnover<br>
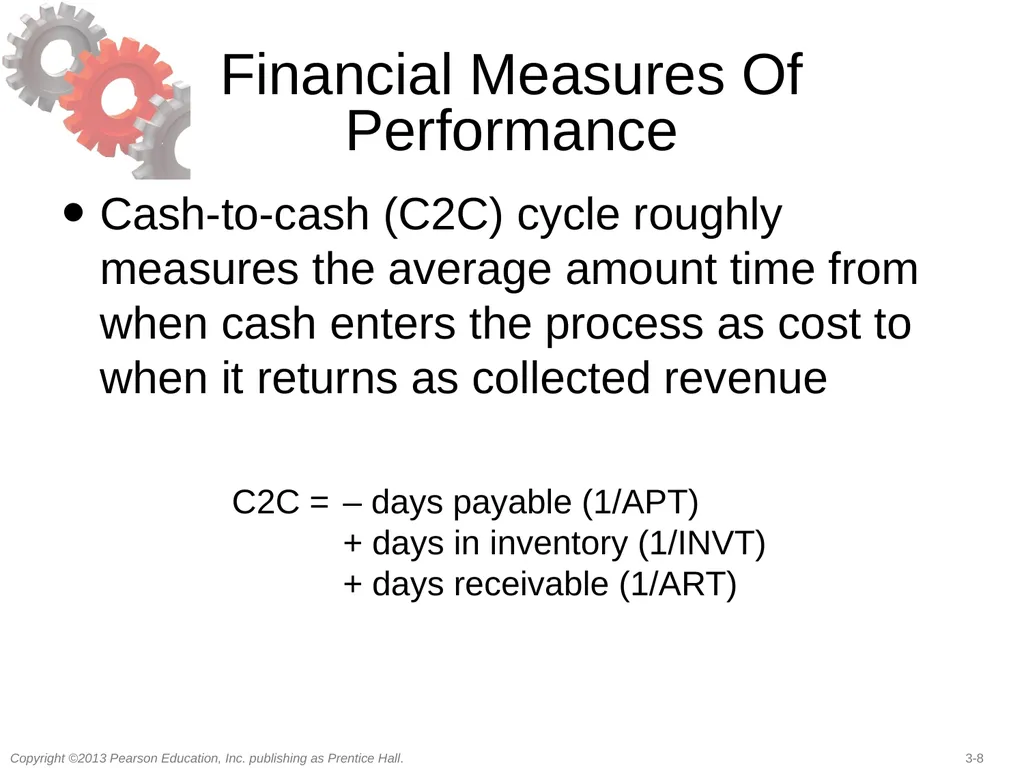
slide8. Financial Measures Of Performance Cash-to-cash (C2C) cycle roughly measures the average amount time from when cash enters the process as cost to when it returns as collected revenue C2C = – days payable (1/APT) + days in inventory (1/INVT) + days receivable (1/ART)<br>
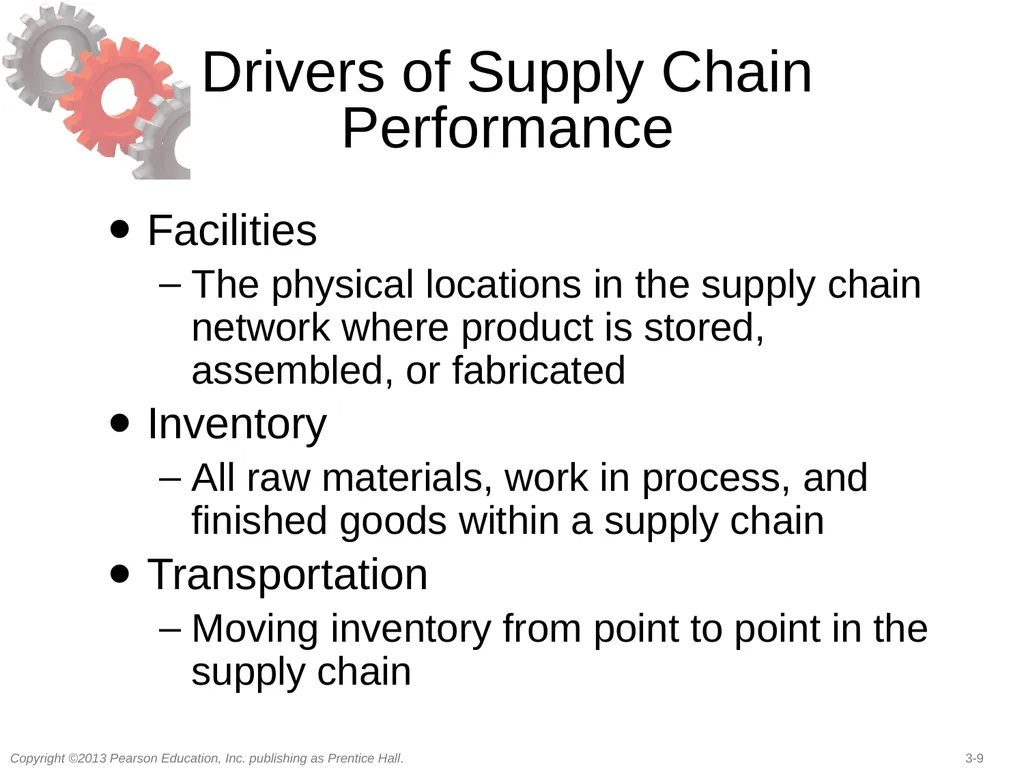
slide9. Drivers of Supply Chain Performance Facilities
The physical locations in the supply chain network where product is stored, assembled, or fabricated
Inventory
All raw materials, work in process, and finished goods within a supply chain
Transportation
Moving inventory from point to point in the supply chain<br>
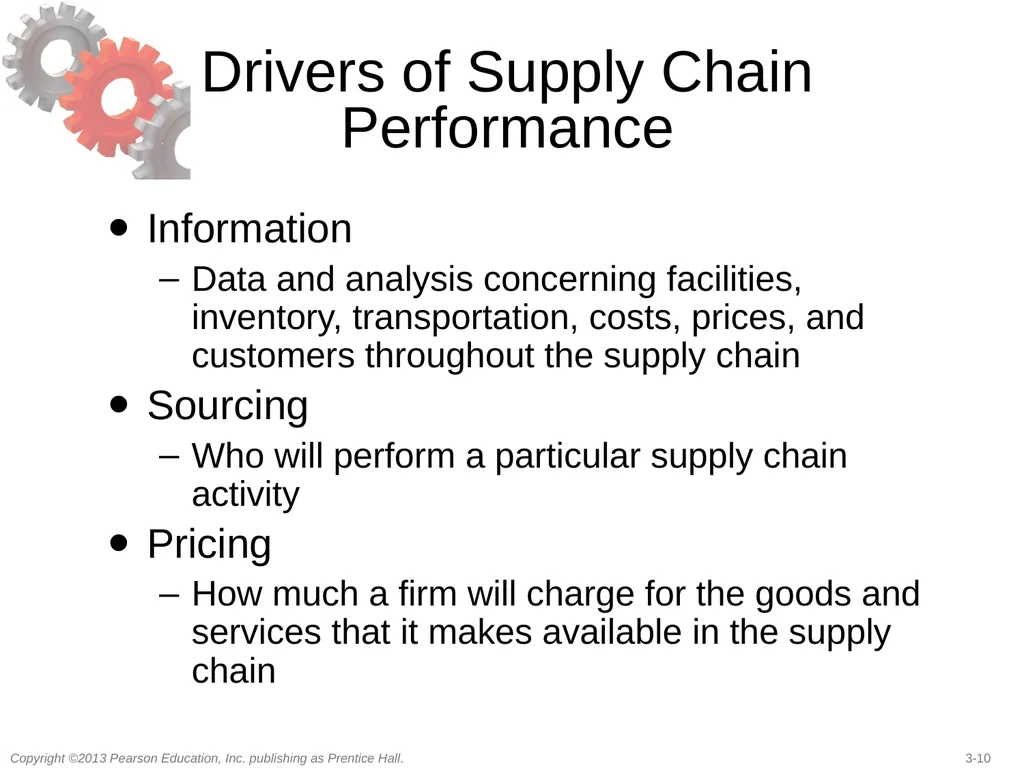
slide10. Drivers of Supply Chain Performance Information
Data and analysis concerning facilities, inventory, transportation, costs, prices, and customers throughout the supply chain
Sourcing
Who will perform a particular supply chain activity
Pricing
How much a firm will charge for the goods and services that it makes available in the supply chain<br>
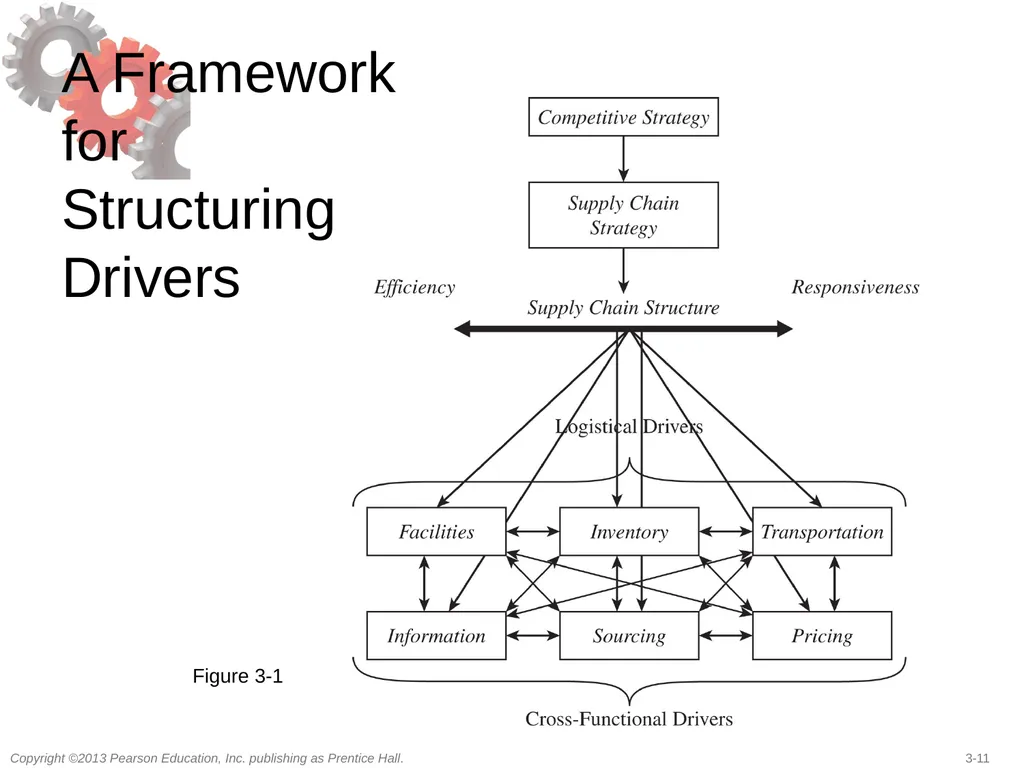
slide11. A Framework for Structuring Drivers Figure 3-1<br>
slide12. Facilities Role in the supply chain
The “where” of the supply chain
Manufacturing or storage (warehouses)
Role in the competitive strategy
Economies of scale (efficiency priority)
Larger number of smaller facilities (responsiveness priority)<br>
slide13. Facilities Components of facilities decisions
Role
Flexible, dedicated, or a combination of the two
Product focus or a functional focus
Location
Where a company will locate its facilities
Centralize/decentralize, macroeconomic factors, quality of workers, cost of workers and facility, availability of infrastructure, proximity to customers, location of other facilities, tax effects<br>
slide14. Facilities Components of facilities decisions
Capacity
A facility’s capacity to perform its intended function or functions
Excess capacity – responsive, costly
Little excess capacity – more efficient, less responsive<br>
slide15. Facilities Components of facilities decisions
Facility-related metrics
Capacity
Utilization
Processing/setup/down/idle time
Production cost per unit
Quality losses
Theoretical flow/cycle time of production
Actual average flow/cycle time<br>
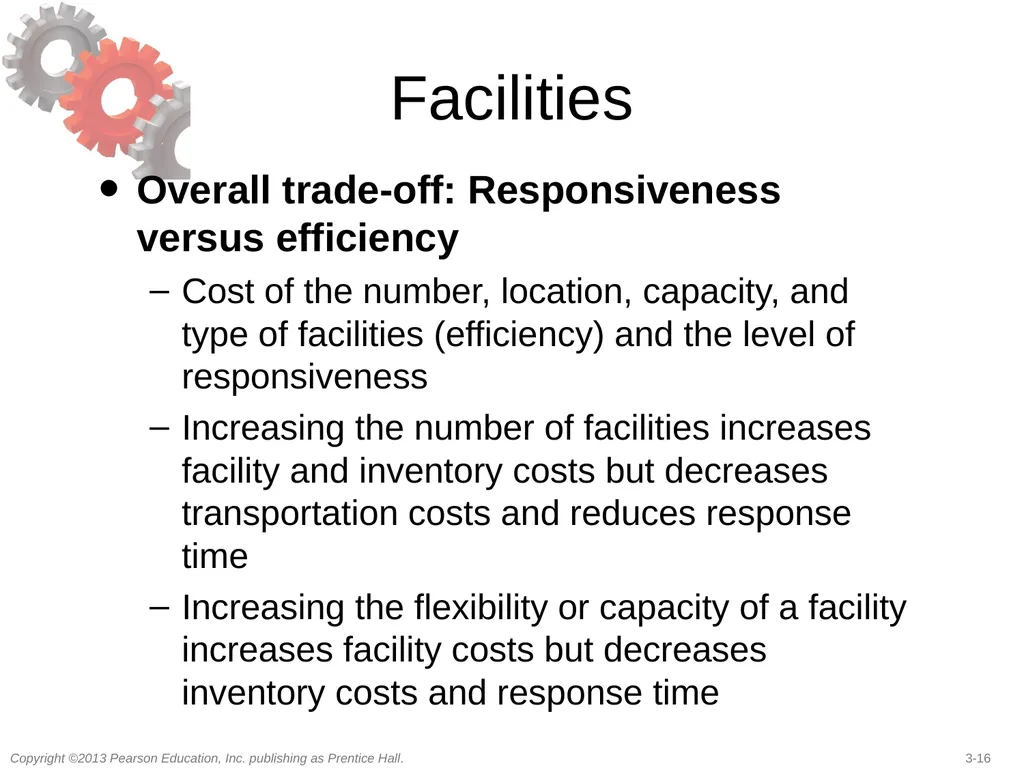
slide16. Facilities Overall trade-off: Responsiveness versus efficiency
Cost of the number, location, capacity, and type of facilities (efficiency) and the level of responsiveness
Increasing the number of facilities increases facility and inventory costs but decreases transportation costs and reduces response time
Increasing the flexibility or capacity of a facility increases facility costs but decreases inventory costs and response time<br>
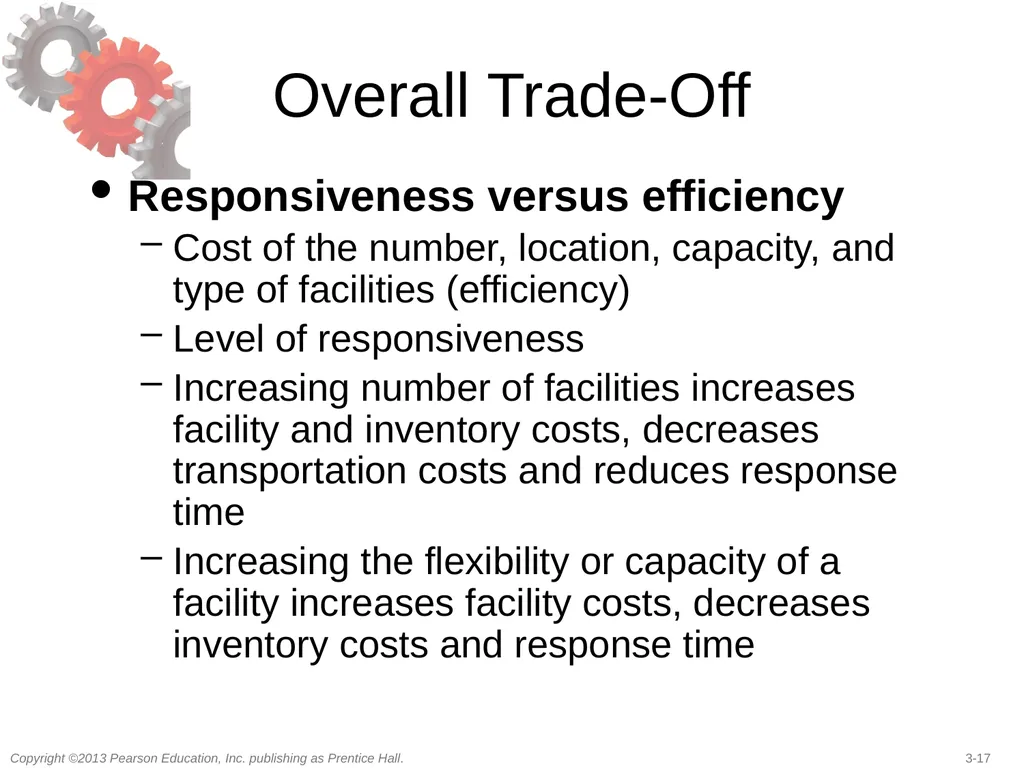
slide17. Overall Trade-Off Responsiveness versus efficiency
Cost of the number, location, capacity, and type of facilities (efficiency)
Level of responsiveness
Increasing number of facilities increases facility and inventory costs, decreases transportation costs and reduces response time
Increasing the flexibility or capacity of a facility increases facility costs, decreases inventory costs and response time<br>
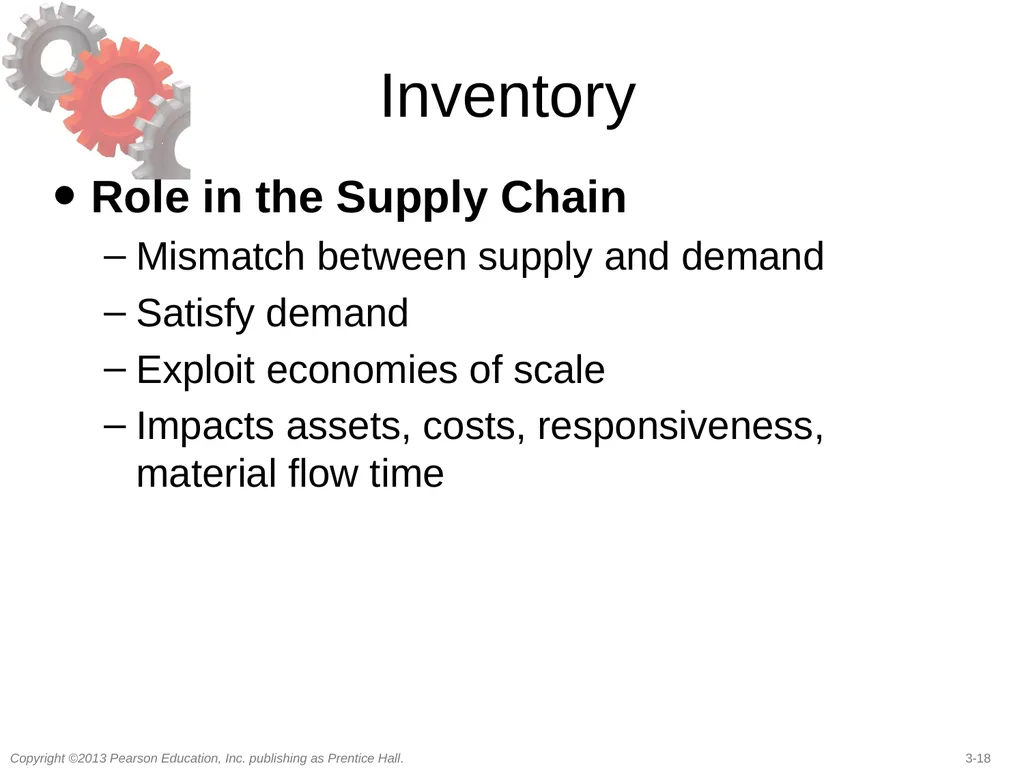
slide18. Inventory Role in the Supply Chain
Mismatch between supply and demand
Satisfy demand
Exploit economies of scale
Impacts assets, costs, responsiveness, material flow time<br>
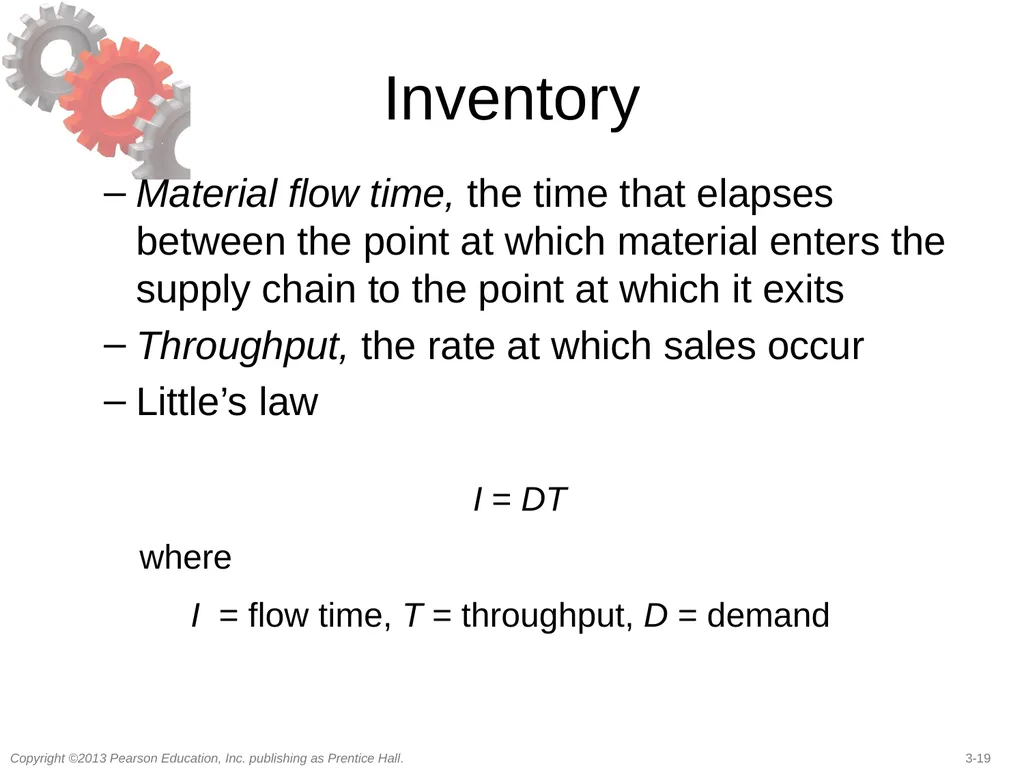
slide19. Inventory Material flow time, the time that elapses between the point at which material enters the supply chain to the point at which it exits
Throughput, the rate at which sales occur
Little’s law I = DT
where
I = flow time, T = throughput, D = demand<br>
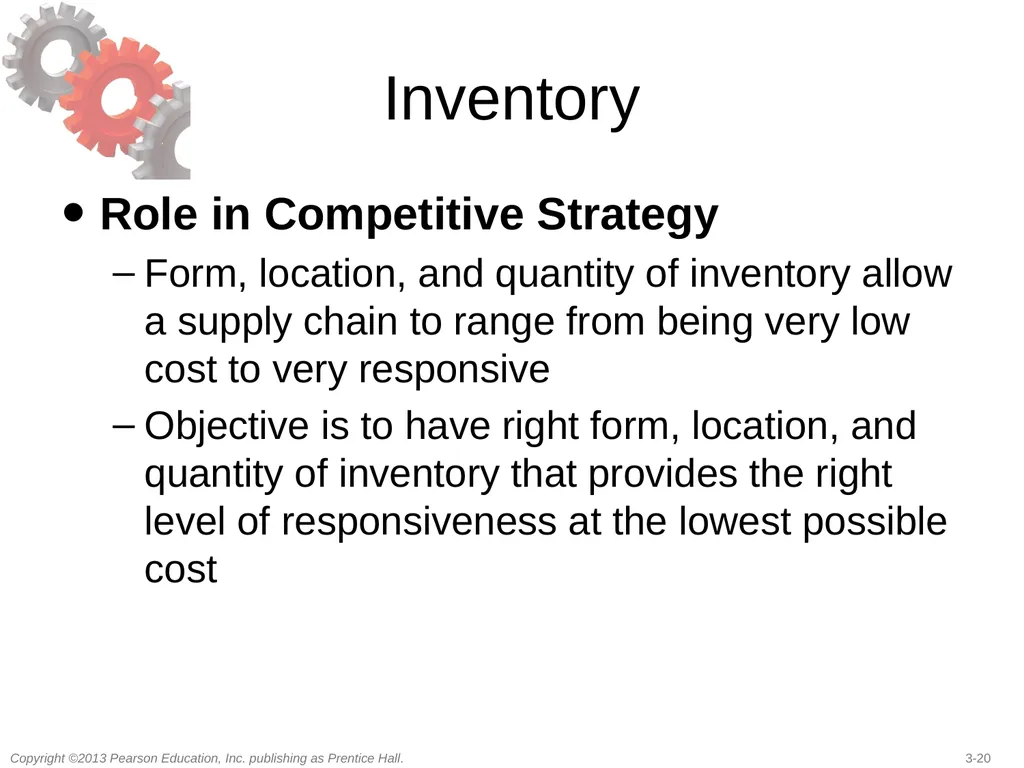
slide20. Inventory Role in Competitive Strategy
Form, location, and quantity of inventory allow a supply chain to range from being very low cost to very responsive
Objective is to have right form, location, and quantity of inventory that provides the right level of responsiveness at the lowest possible cost<br>
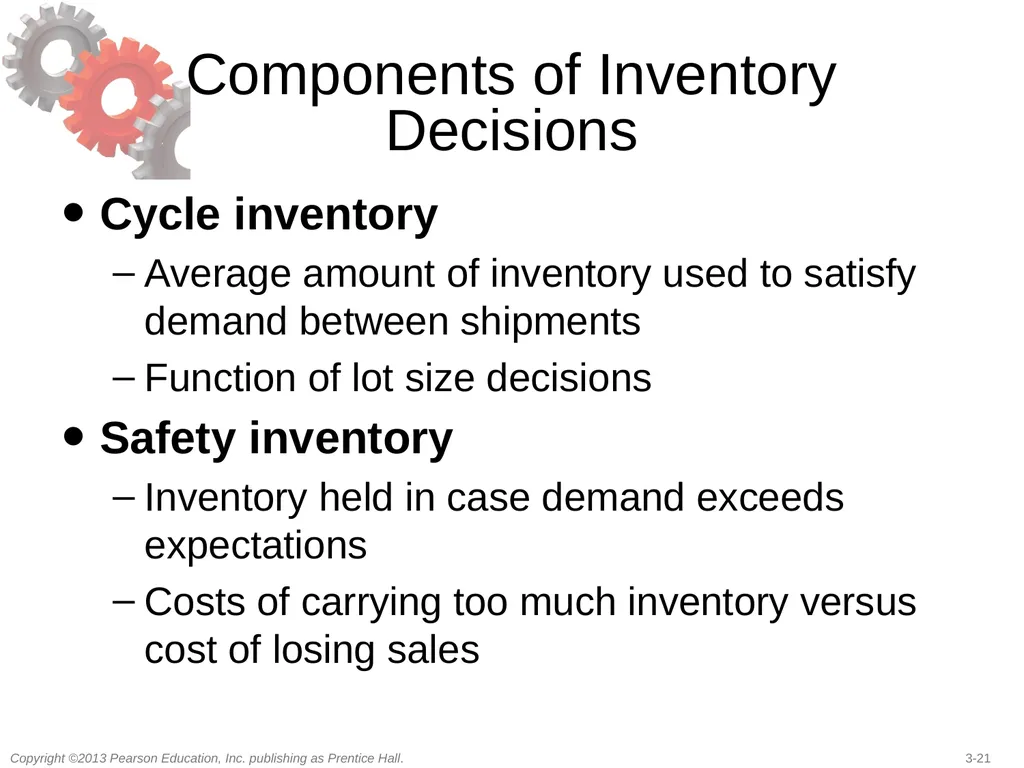
slide21. Components of Inventory Decisions Cycle inventory
Average amount of inventory used to satisfy demand between shipments
Function of lot size decisions
Safety inventory
Inventory held in case demand exceeds expectations
Costs of carrying too much inventory versus cost of losing sales<br>
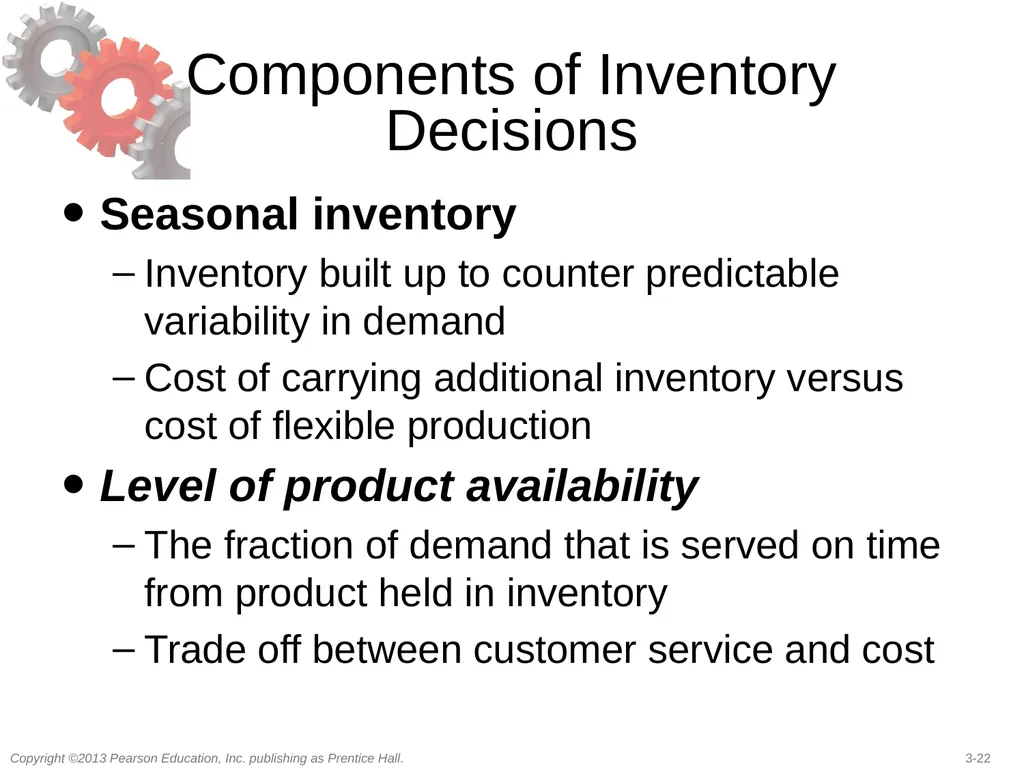
slide22. Components of Inventory Decisions Seasonal inventory
Inventory built up to counter predictable variability in demand
Cost of carrying additional inventory versus cost of flexible production
Level of product availability
The fraction of demand that is served on time from product held in inventory
Trade off between customer service and cost<br>
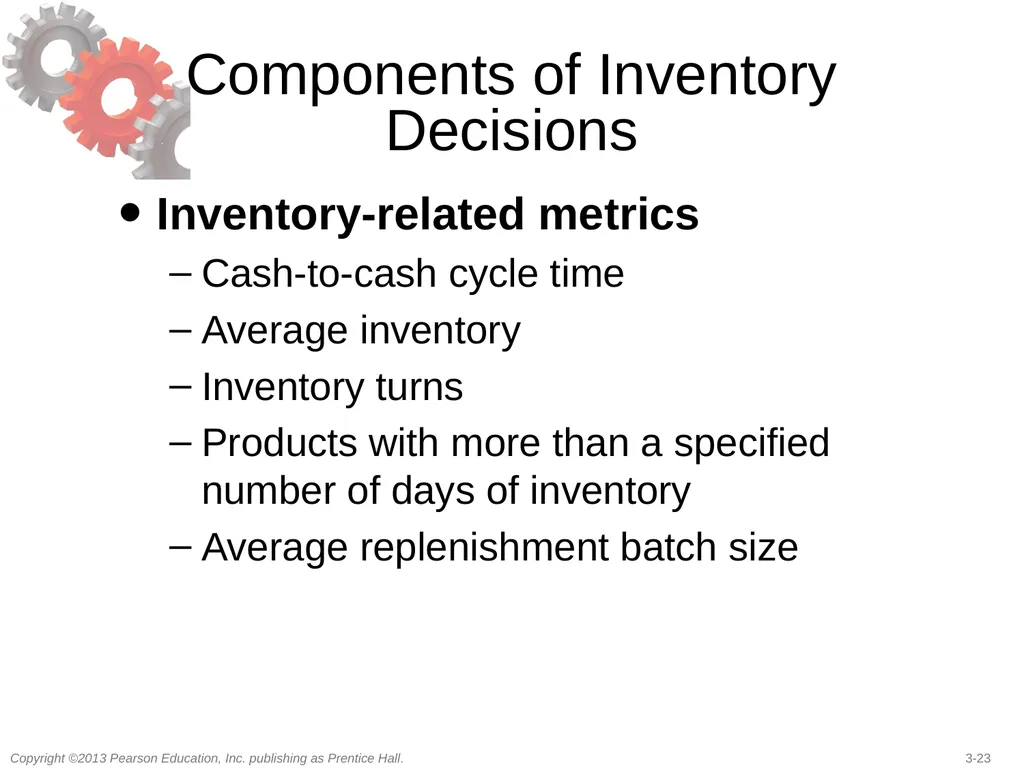
slide23. Components of Inventory Decisions Inventory-related metrics
Cash-to-cash cycle time
Average inventory
Inventory turns
Products with more than a specified number of days of inventory
Average replenishment batch size<br>
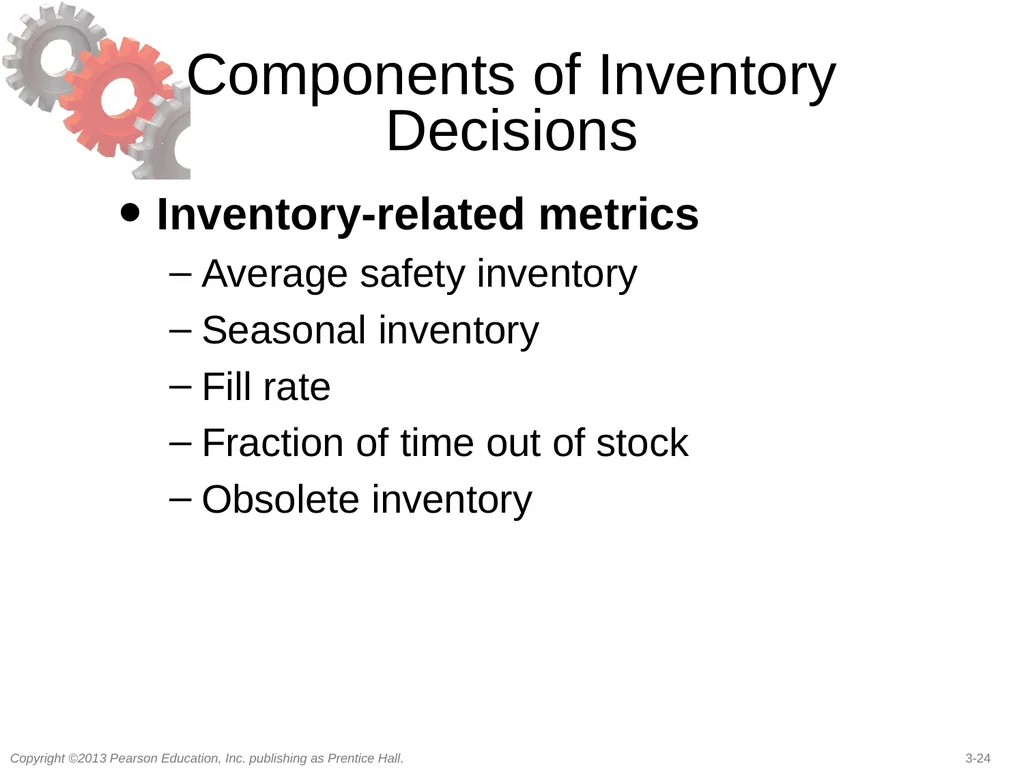
slide24. Components of Inventory Decisions Inventory-related metrics
Average safety inventory
Seasonal inventory
Fill rate
Fraction of time out of stock
Obsolete inventory<br>
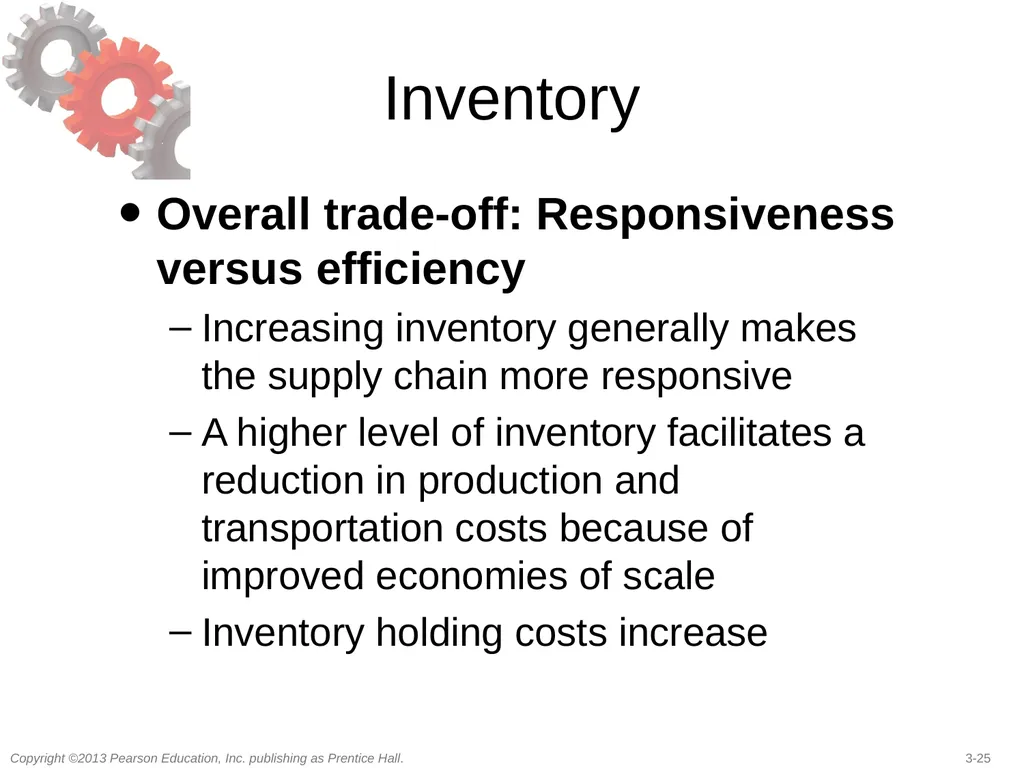
slide25. Inventory Overall trade-off: Responsiveness versus efficiency
Increasing inventory generally makes the supply chain more responsive
A higher level of inventory facilitates a reduction in production and transportation costs because of improved economies of scale
Inventory holding costs increase<br>
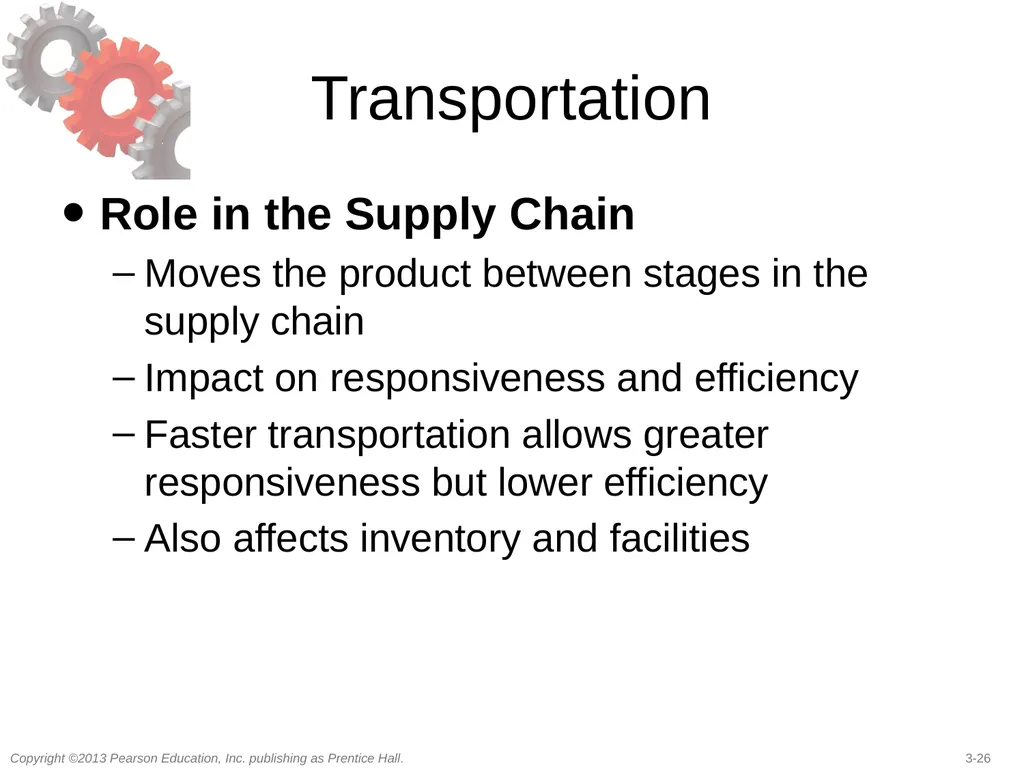
slide26. Transportation Role in the Supply Chain
Moves the product between stages in the supply chain
Impact on responsiveness and efficiency
Faster transportation allows greater responsiveness but lower efficiency
Also affects inventory and facilities<br>
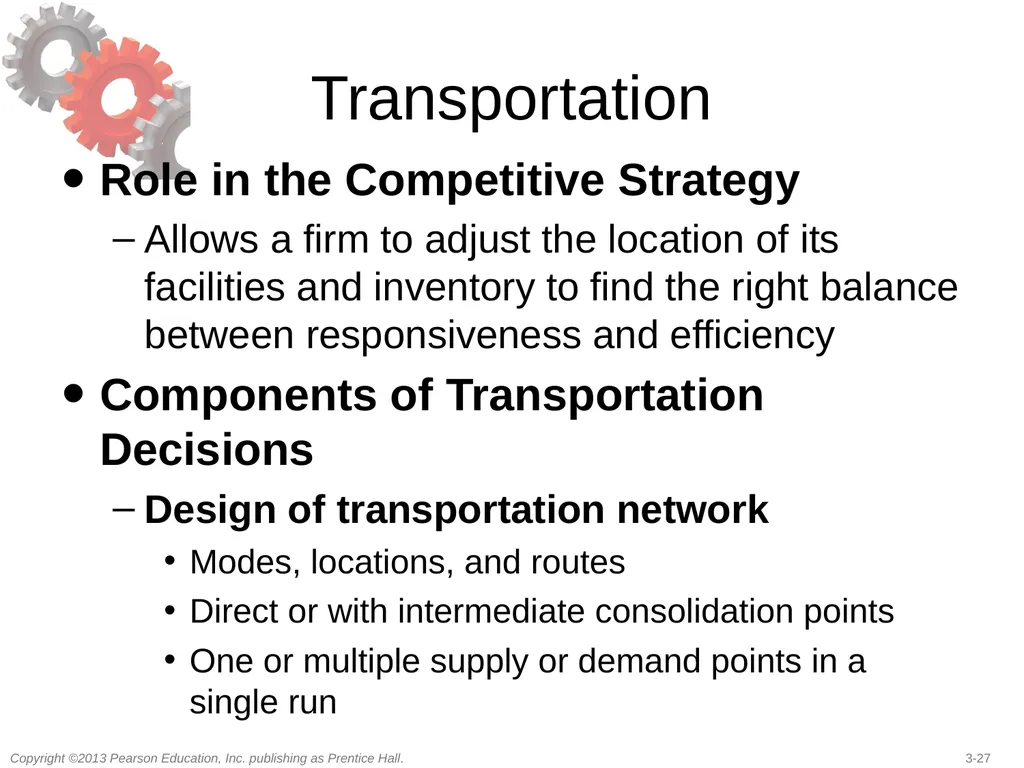
slide27. Transportation Role in the Competitive Strategy
Allows a firm to adjust the location of its facilities and inventory to find the right balance between responsiveness and efficiency
Components of Transportation Decisions
Design of transportation network
Modes, locations, and routes
Direct or with intermediate consolidation points
One or multiple supply or demand points in a single run<br>
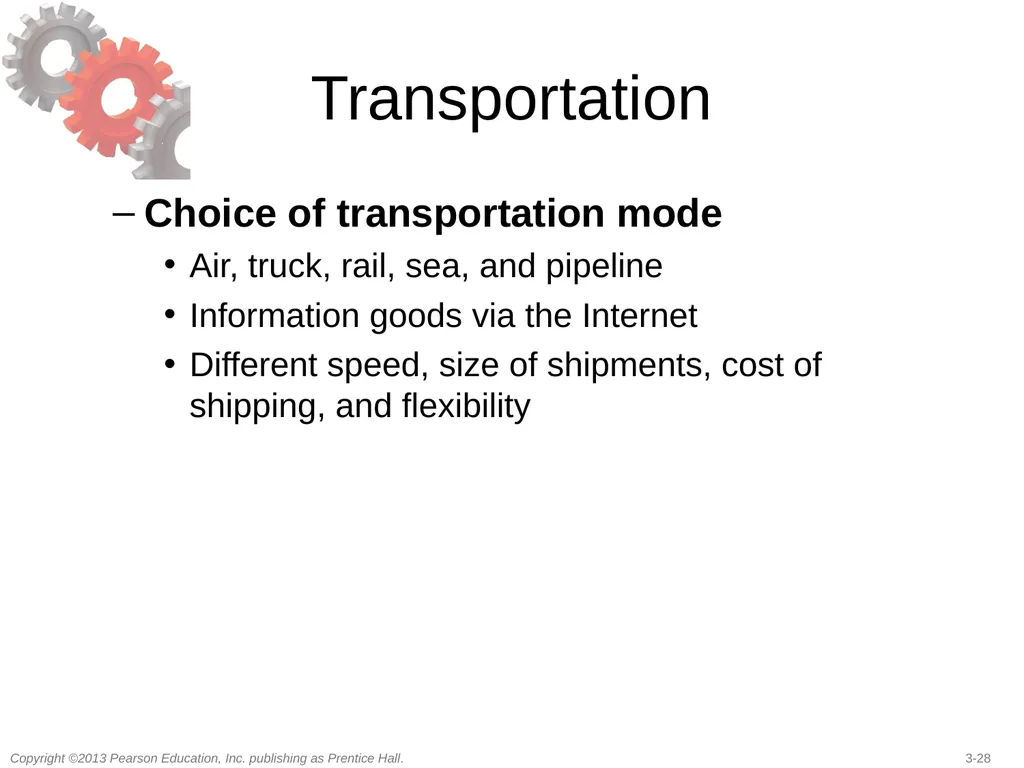
slide28. Transportation Choice of transportation mode
Air, truck, rail, sea, and pipeline
Information goods via the Internet
Different speed, size of shipments, cost of shipping, and flexibility<br>
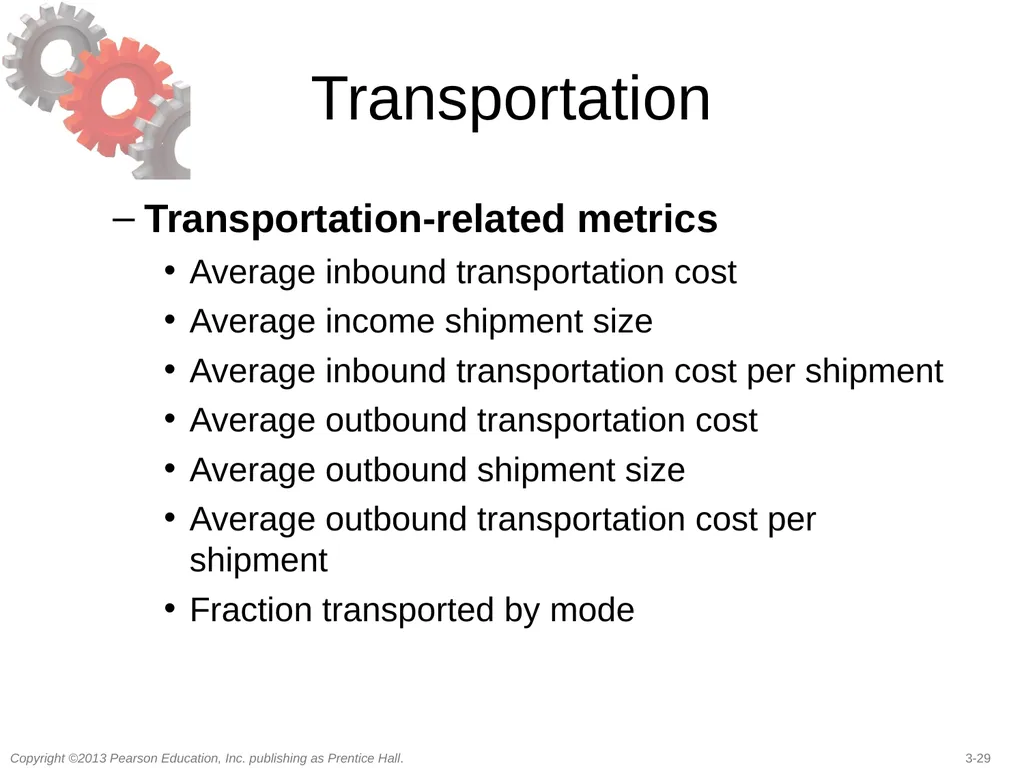
slide29. Transportation Transportation-related metrics
Average inbound transportation cost
Average income shipment size
Average inbound transportation cost per shipment
Average outbound transportation cost
Average outbound shipment size
Average outbound transportation cost per shipment
Fraction transported by mode<br>
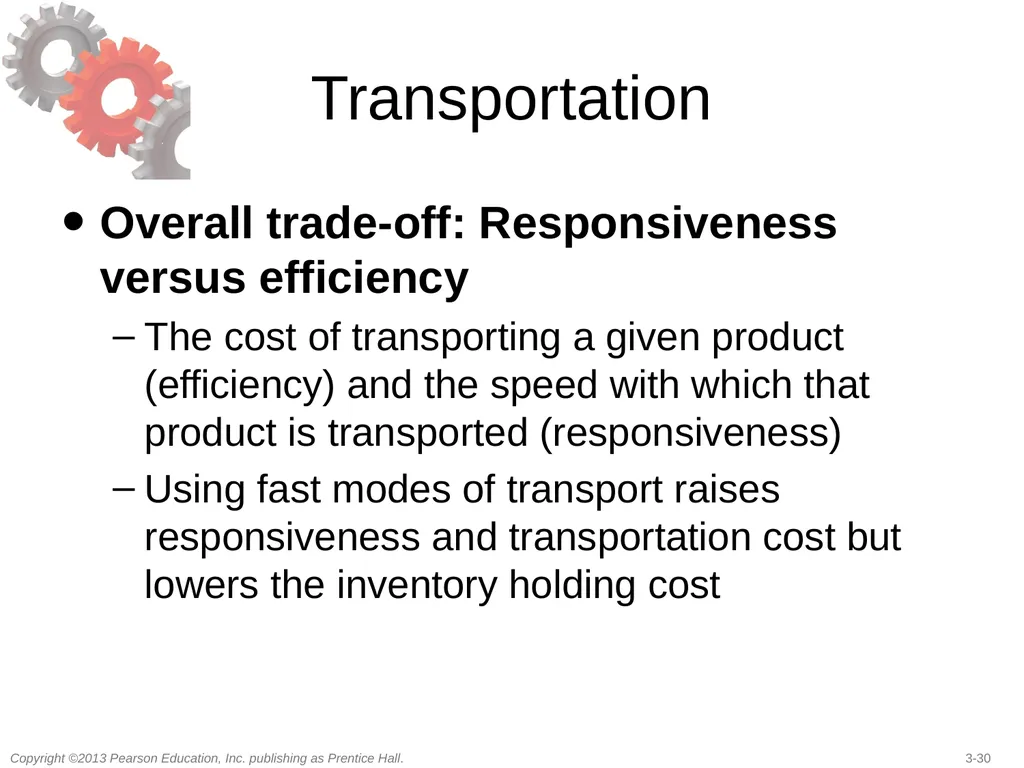
slide30. Transportation Overall trade-off: Responsiveness versus efficiency
The cost of transporting a given product (efficiency) and the speed with which that product is transported (responsiveness)
Using fast modes of transport raises responsiveness and transportation cost but lowers the inventory holding cost<br>
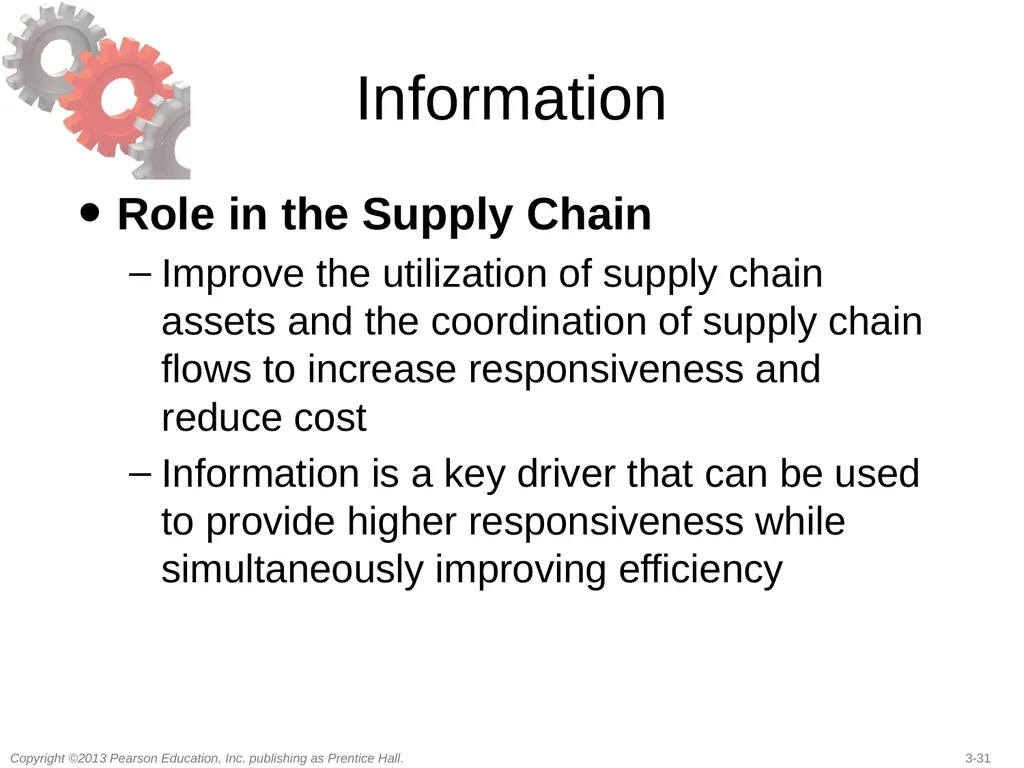
slide31. Information Role in the Supply Chain
Improve the utilization of supply chain assets and the coordination of supply chain flows to increase responsiveness and reduce cost
Information is a key driver that can be used to provide higher responsiveness while simultaneously improving efficiency<br>
slide32. Information Role in the Competitive Strategy
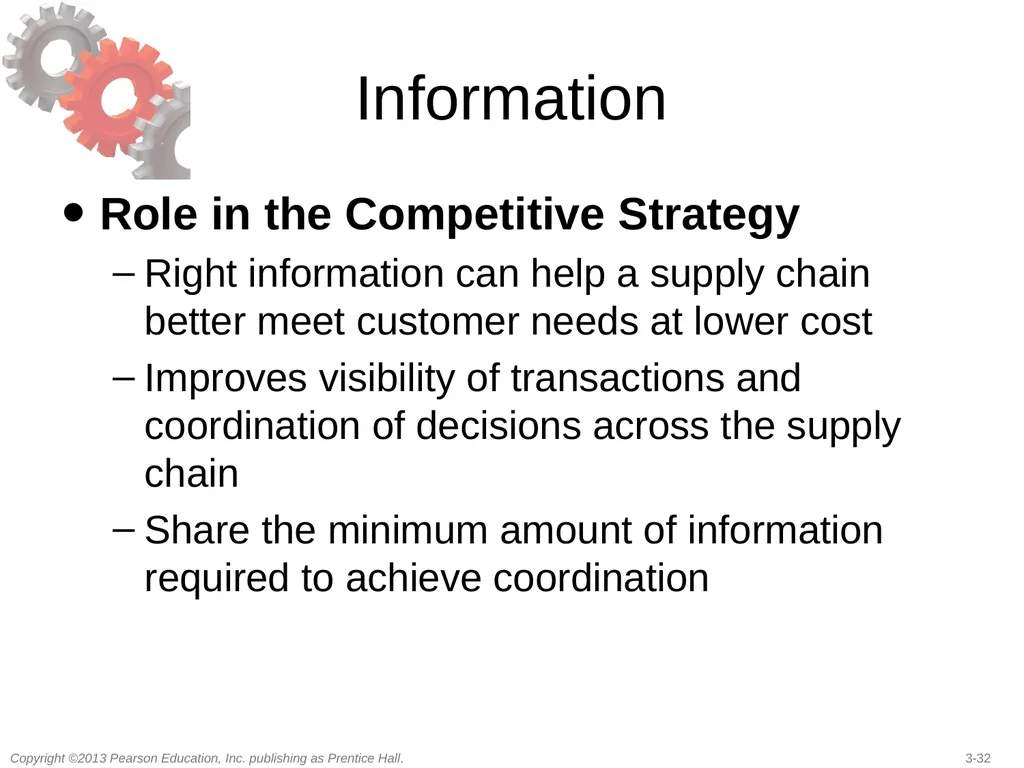
Right information can help a supply chain better meet customer needs at lower cost
Improves visibility of transactions and coordination of decisions across the supply chain
Share the minimum amount of information required to achieve coordination<br>
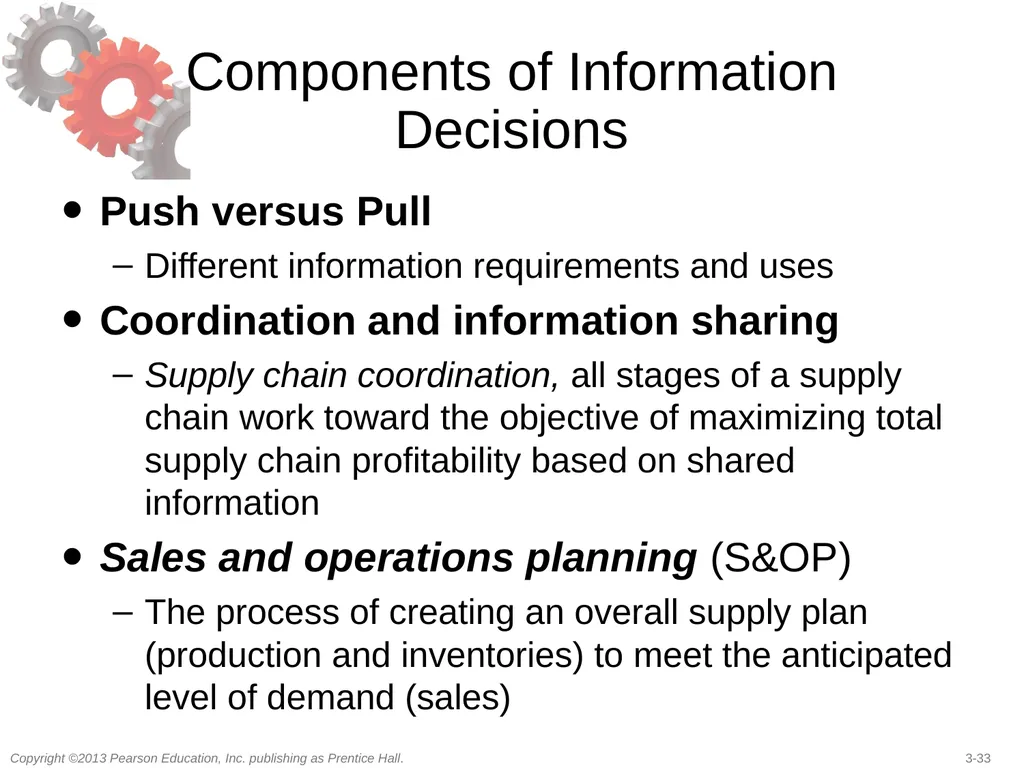
slide33. Components of Information Decisions Push versus Pull
Different information requirements and uses
Coordination and information sharing
Supply chain coordination, all stages of a supply chain work toward the objective of maximizing total supply chain profitability based on shared information
Sales and operations planning (S&OP)
The process of creating an overall supply plan (production and inventories) to meet the anticipated level of demand (sales)<br>
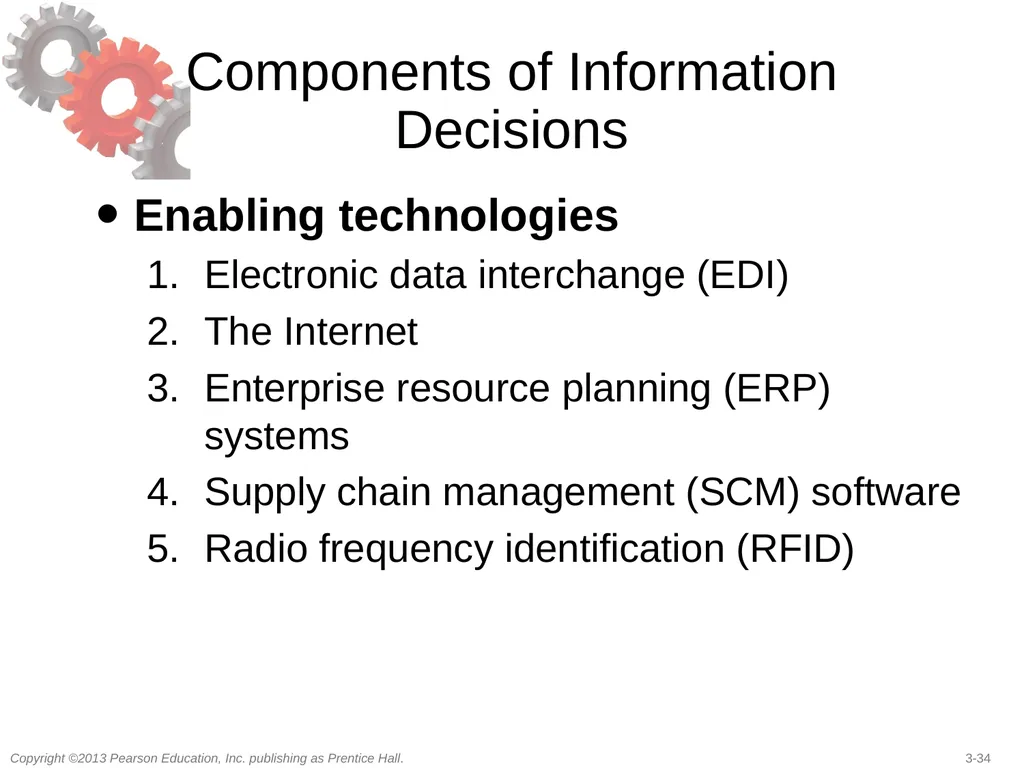
slide34. Components of Information Decisions Enabling technologies
Electronic data interchange (EDI)
The Internet
Enterprise resource planning (ERP) systems
Supply chain management (SCM) software
Radio frequency identification (RFID)<br>
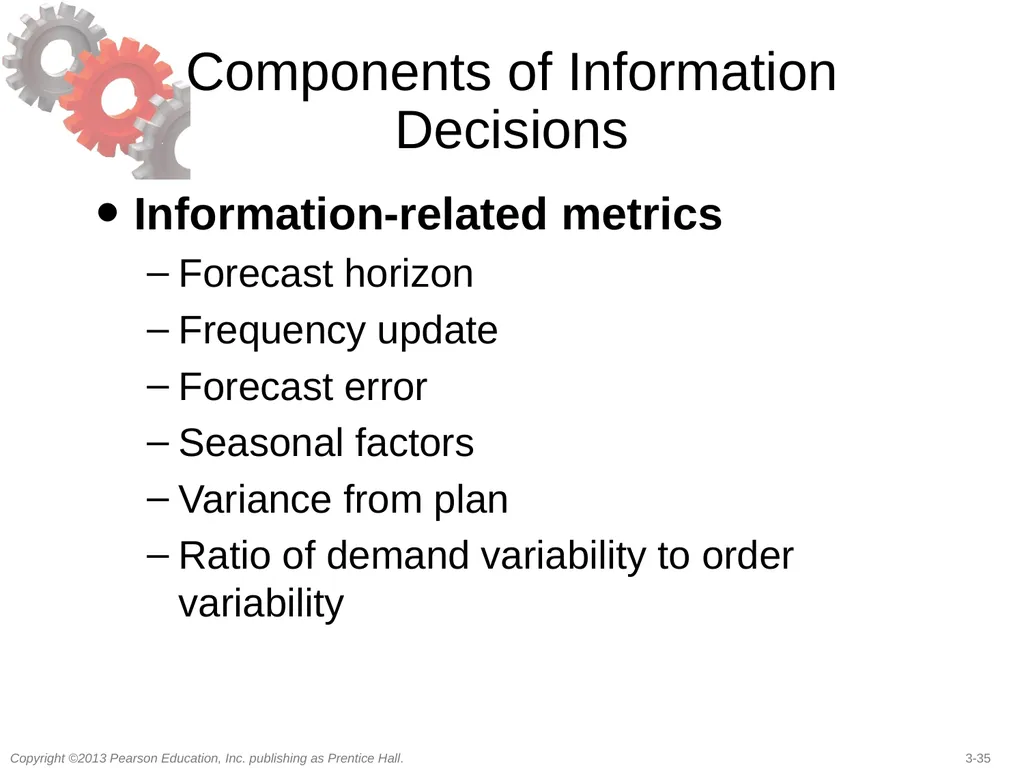
slide35. Components of Information Decisions Information-related metrics
Forecast horizon
Frequency update
Forecast error
Seasonal factors
Variance from plan
Ratio of demand variability to order variability<br>
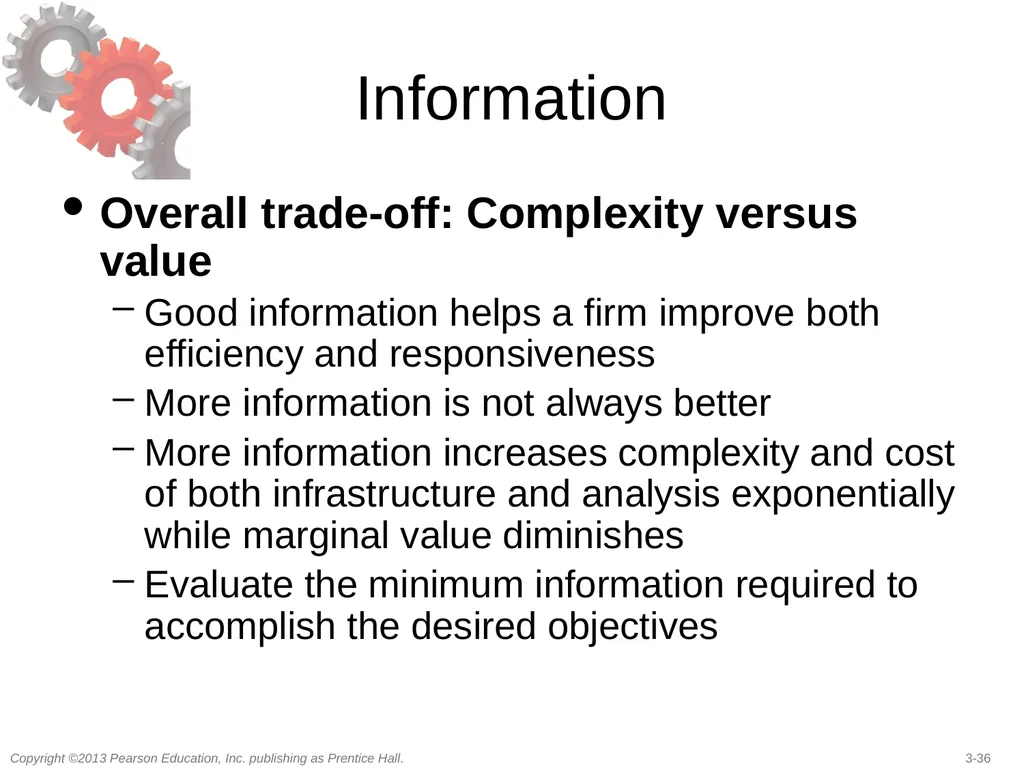
slide36. Information Overall trade-off: Complexity versus value
Good information helps a firm improve both efficiency and responsiveness
More information is not always better
More information increases complexity and cost of both infrastructure and analysis exponentially while marginal value diminishes
Evaluate the minimum information required to accomplish the desired objectives<br>
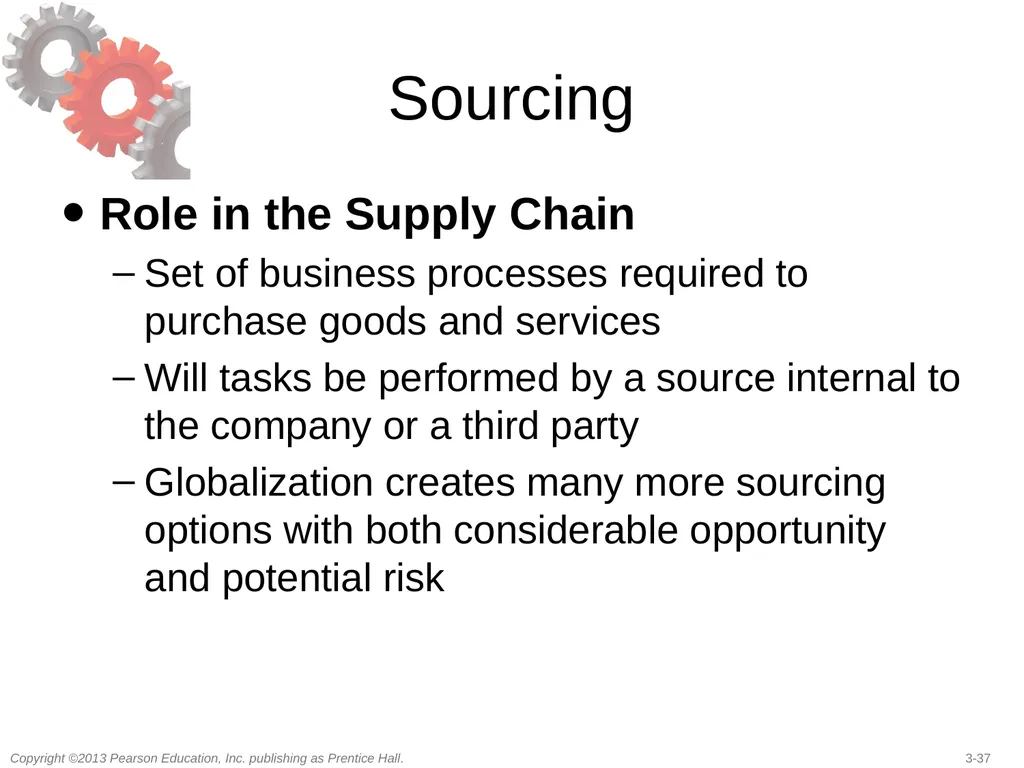
slide37. Sourcing Role in the Supply Chain
Set of business processes required to purchase goods and services
Will tasks be performed by a source internal to the company or a third party
Globalization creates many more sourcing options with both considerable opportunity and potential risk<br>
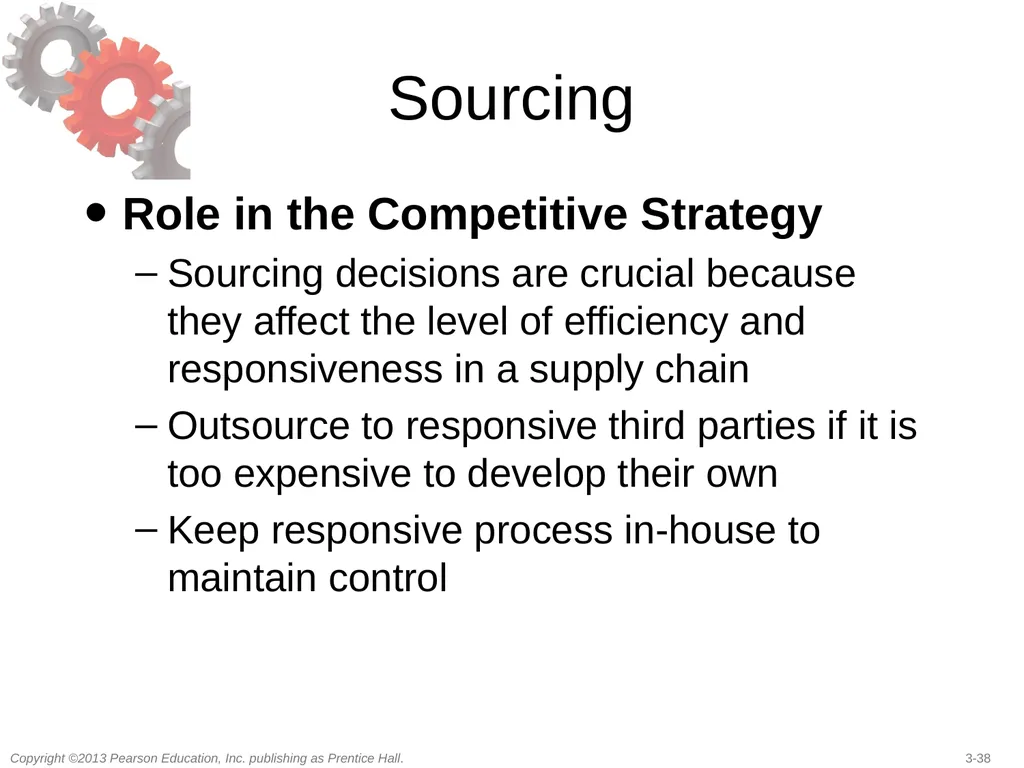
slide38. Sourcing Role in the Competitive Strategy
Sourcing decisions are crucial because they affect the level of efficiency and responsiveness in a supply chain
Outsource to responsive third parties if it is too expensive to develop their own
Keep responsive process in-house to maintain control<br>
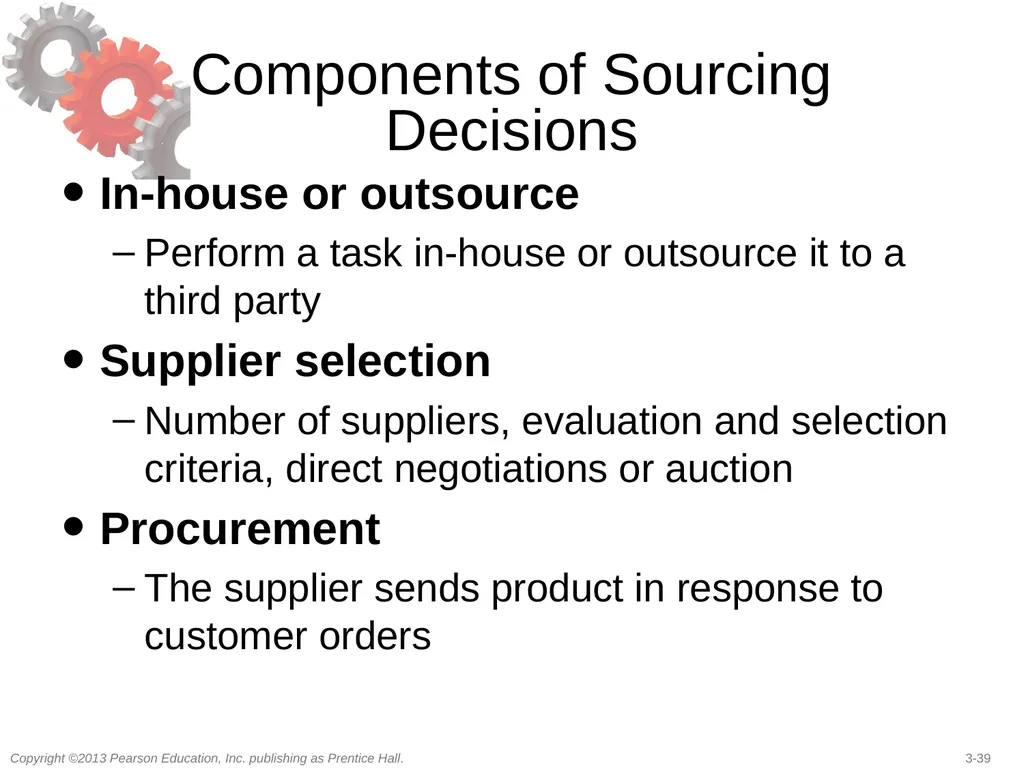
slide39. Components of Sourcing Decisions In-house or outsource
Perform a task in-house or outsource it to a third party
Supplier selection
Number of suppliers, evaluation and selection criteria, direct negotiations or auction
Procurement
The supplier sends product in response to customer orders<br>
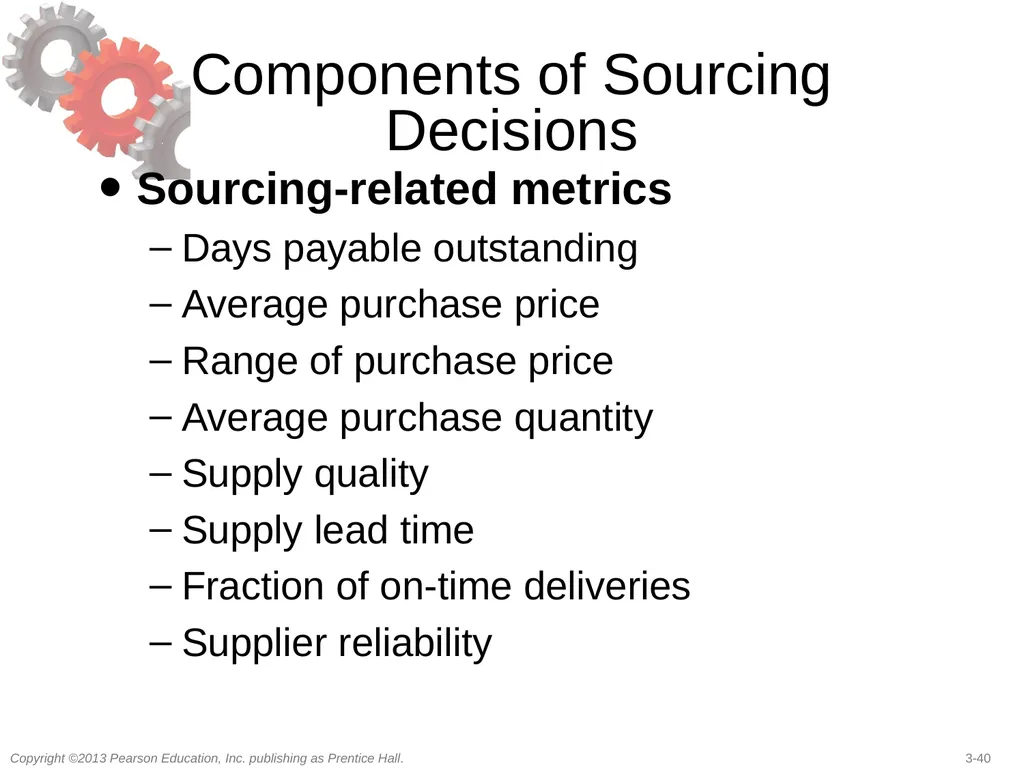
slide40. Components of Sourcing Decisions Sourcing-related metrics
Days payable outstanding
Average purchase price
Range of purchase price
Average purchase quantity
Supply quality
Supply lead time
Fraction of on-time deliveries
Supplier reliability<br>
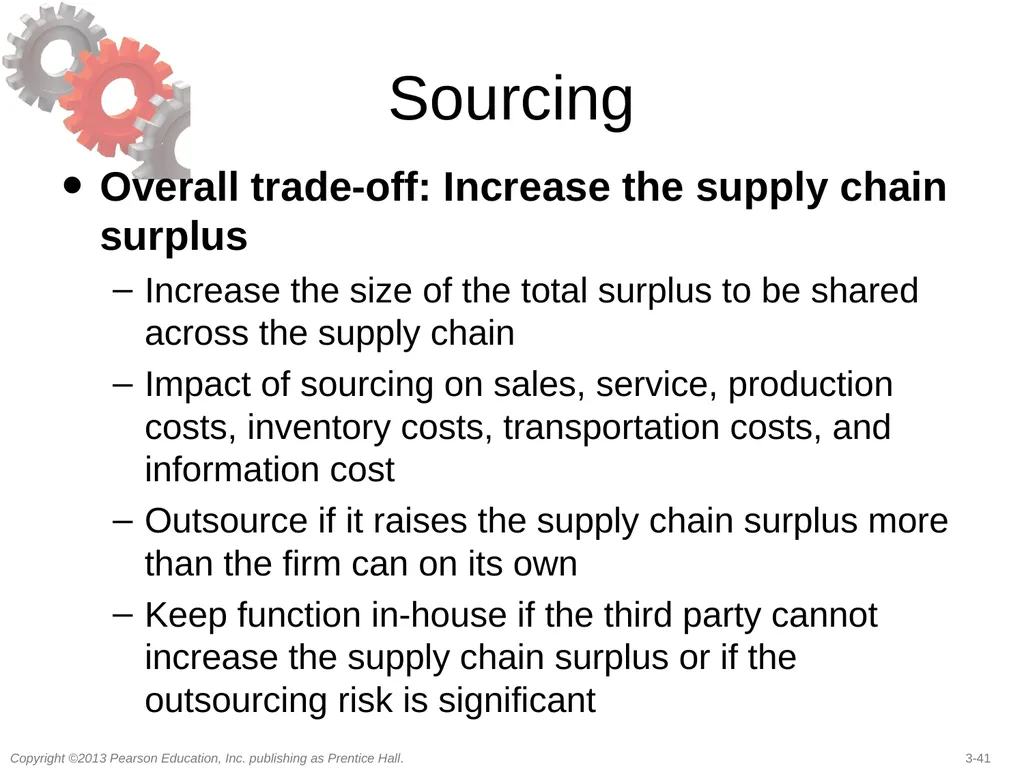
slide41. Sourcing Overall trade-off: Increase the supply chain surplus
Increase the size of the total surplus to be shared across the supply chain
Impact of sourcing on sales, service, production costs, inventory costs, transportation costs, and information cost
Outsource if it raises the supply chain surplus more than the firm can on its own
Keep function in-house if the third party cannot increase the supply chain surplus or if the outsourcing risk is significant<br>
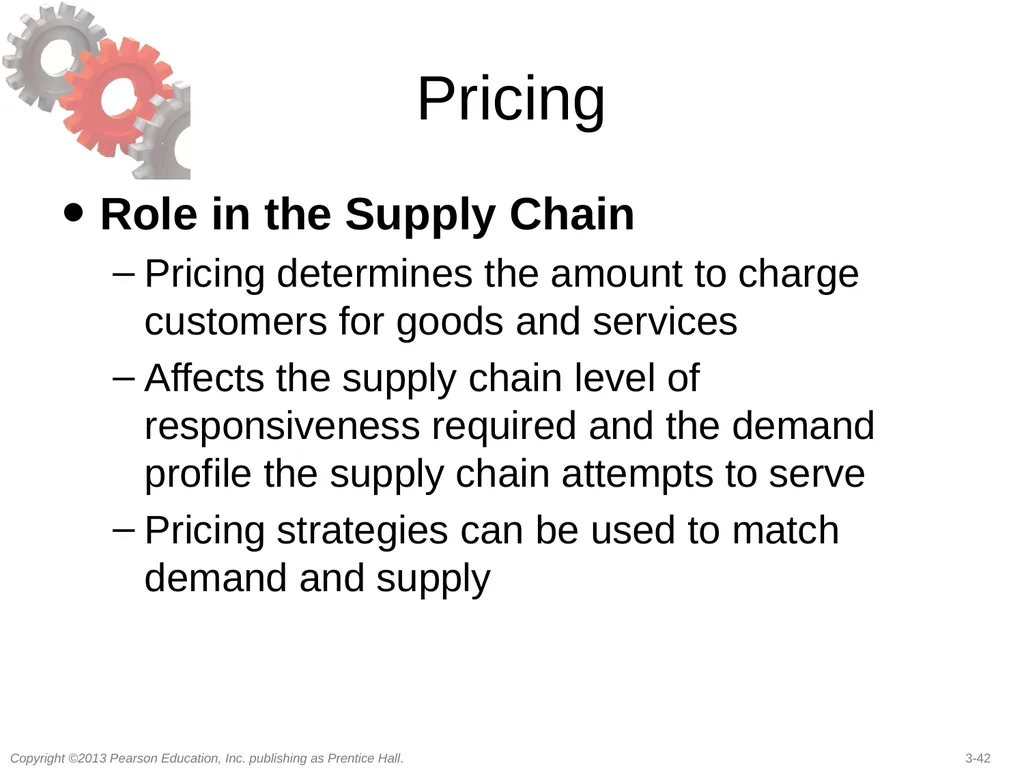
slide42. Pricing Role in the Supply Chain
Pricing determines the amount to charge customers for goods and services
Affects the supply chain level of responsiveness required and the demand profile the supply chain attempts to serve
Pricing strategies can be used to match demand and supply<br>
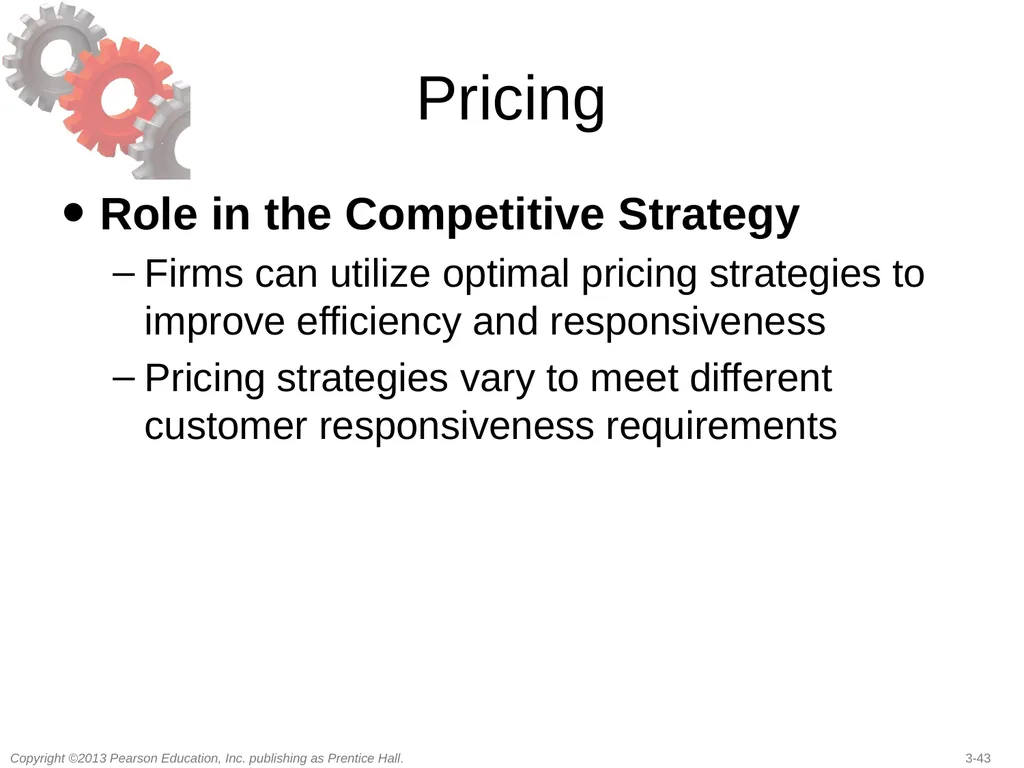
slide43. Pricing Role in the Competitive Strategy
Firms can utilize optimal pricing strategies to improve efficiency and responsiveness
Pricing strategies vary to meet different customer responsiveness requirements<br>
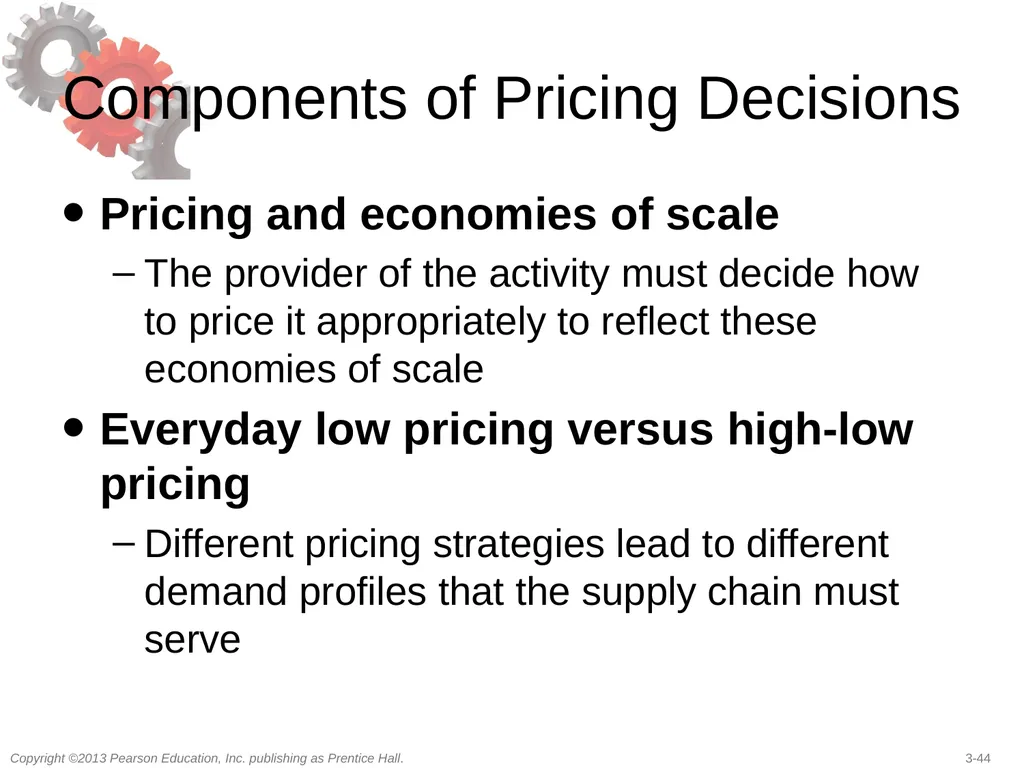
slide44. Components of Pricing Decisions Pricing and economies of scale
The provider of the activity must decide how to price it appropriately to reflect these economies of scale
Everyday low pricing versus high-low pricing
Different pricing strategies lead to different demand profiles that the supply chain must serve<br>
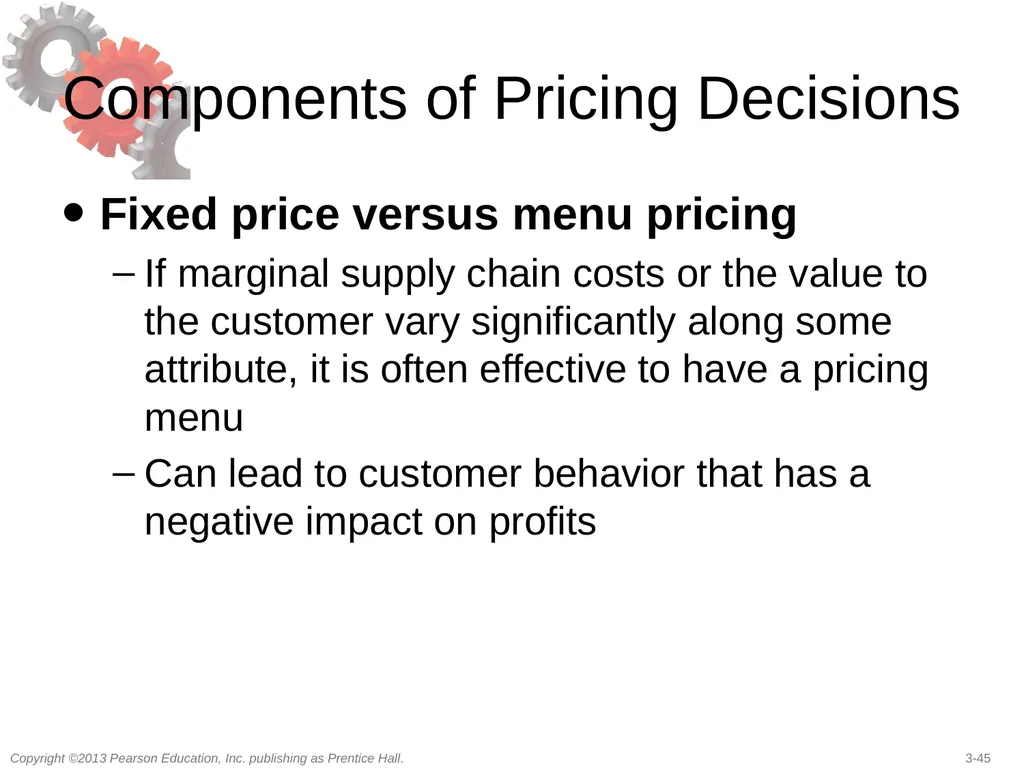
slide45. Components of Pricing Decisions Fixed price versus menu pricing
If marginal supply chain costs or the value to the customer vary significantly along some attribute, it is often effective to have a pricing menu
Can lead to customer behavior that has a negative impact on profits<br>
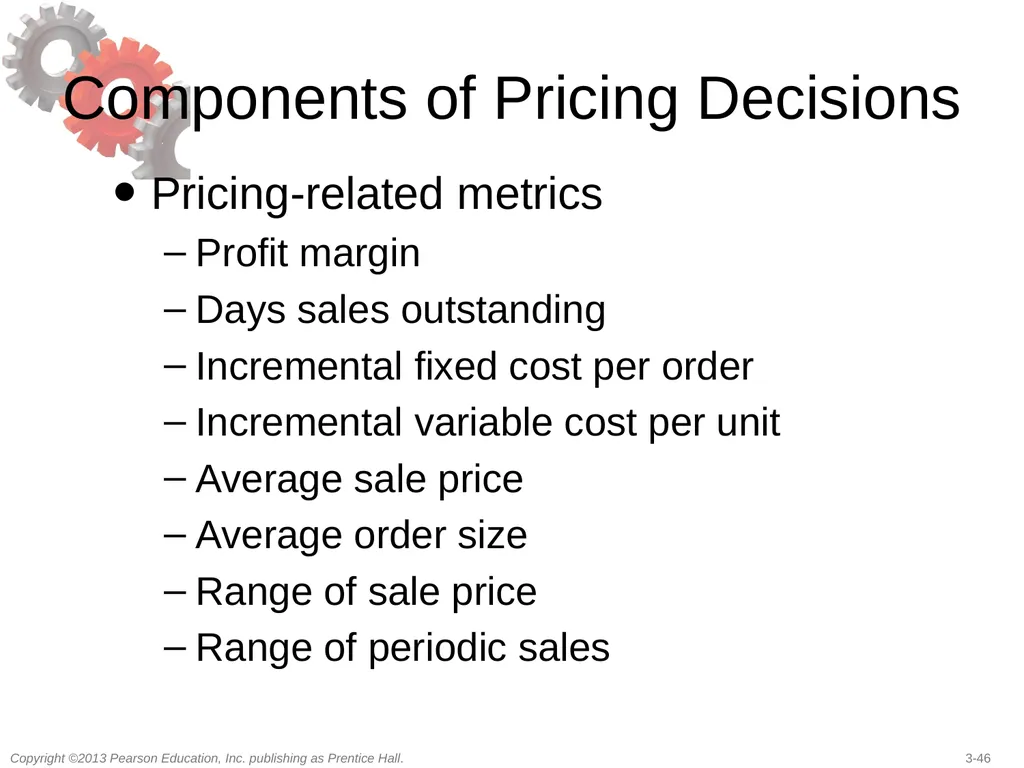
slide46. Components of Pricing Decisions Pricing-related metrics
Profit margin
Days sales outstanding
Incremental fixed cost per order
Incremental variable cost per unit
Average sale price
Average order size
Range of sale price
Range of periodic sales<br>
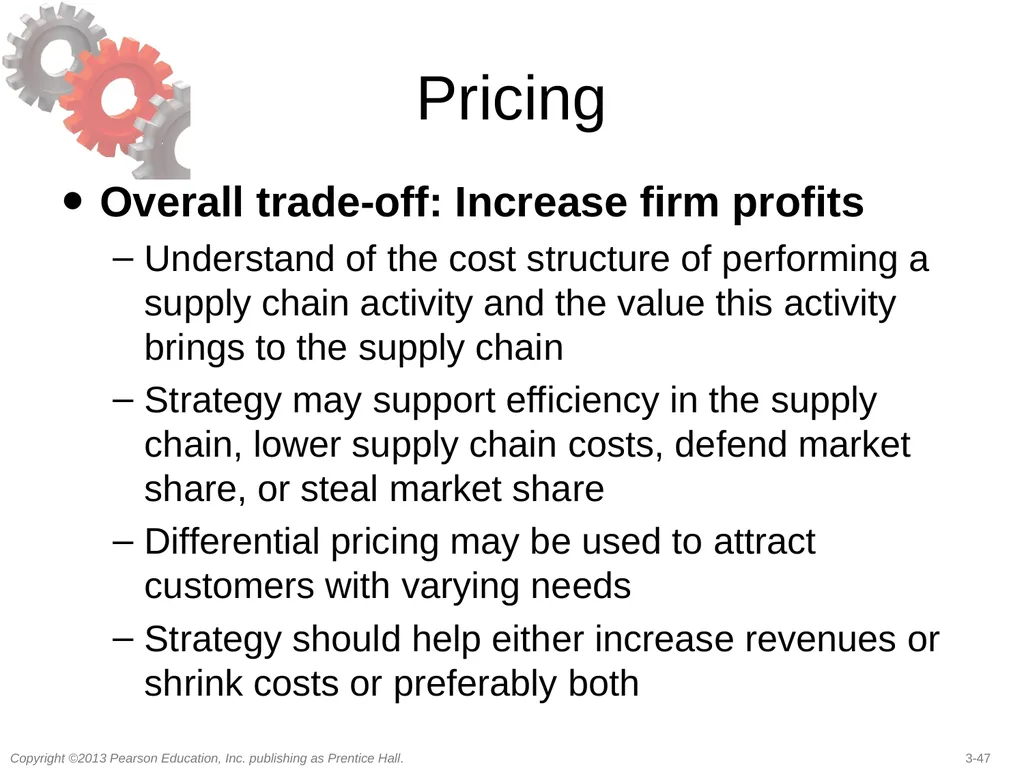
slide47. Pricing Overall trade-off: Increase firm profits
Understand of the cost structure of performing a supply chain activity and the value this activity brings to the supply chain
Strategy may support efficiency in the supply chain, lower supply chain costs, defend market share, or steal market share
Differential pricing may be used to attract customers with varying needs
Strategy should help either increase revenues or shrink costs or preferably both<br>
slide48. Summary of Learning Objectives Describe key financial measures of firm performance
Identify the major drivers of supply chain performance
Discuss the role of each driver in creating strategic fit between the supply chain strategy and the competitive strategy
Define the key metrics that track the performance of the supply chain in terms of each driver<br>
slide49. All rights reserved. No part of this publication may be reproduced, stored in a retrieval system, or transmitted, in any form or by any means, electronic, mechanical, photocopying, recording, or otherwise, without the prior written permission of the publisher.
Printed in the United States of America.<br>
slide2. Learning Objectives Describe key financial measures of firm performance.
Identify the major drivers of supply chain performance.
Discuss the role of each driver in creating strategic fit between the supply chain strategy and the competitive strategy.
Define the key metrics that track the performance of the supply chain in terms of each driver.<br>
slide3. Financial Measures Of Performance From a shareholder perspective, return on equity (ROE) is the main summary measure of a firm’s performance<br>
slide4. Financial Measures Of Performance Return on assets (ROA) measures the return earned on each dollar invested by the firm in assets<br>
slide5. Financial Data for Amazon Table 3-1<br>
slide6. Financial Measures Of Performance An important ratio that defines financial leverage is accounts payable turnover (APT)<br>
slide7. Financial Measures Of Performance ROA can be written as the product of two ratios – profit margin and asset turnover<br>
slide8. Financial Measures Of Performance Cash-to-cash (C2C) cycle roughly measures the average amount time from when cash enters the process as cost to when it returns as collected revenue C2C = – days payable (1/APT) + days in inventory (1/INVT) + days receivable (1/ART)<br>
slide9. Drivers of Supply Chain Performance Facilities
The physical locations in the supply chain network where product is stored, assembled, or fabricated
Inventory
All raw materials, work in process, and finished goods within a supply chain
Transportation
Moving inventory from point to point in the supply chain<br>
slide10. Drivers of Supply Chain Performance Information
Data and analysis concerning facilities, inventory, transportation, costs, prices, and customers throughout the supply chain
Sourcing
Who will perform a particular supply chain activity
Pricing
How much a firm will charge for the goods and services that it makes available in the supply chain<br>
slide11. A Framework for Structuring Drivers Figure 3-1<br>
slide12. Facilities Role in the supply chain
The “where” of the supply chain
Manufacturing or storage (warehouses)
Role in the competitive strategy
Economies of scale (efficiency priority)
Larger number of smaller facilities (responsiveness priority)<br>
slide13. Facilities Components of facilities decisions
Role
Flexible, dedicated, or a combination of the two
Product focus or a functional focus
Location
Where a company will locate its facilities
Centralize/decentralize, macroeconomic factors, quality of workers, cost of workers and facility, availability of infrastructure, proximity to customers, location of other facilities, tax effects<br>
slide14. Facilities Components of facilities decisions
Capacity
A facility’s capacity to perform its intended function or functions
Excess capacity – responsive, costly
Little excess capacity – more efficient, less responsive<br>
slide15. Facilities Components of facilities decisions
Facility-related metrics
Capacity
Utilization
Processing/setup/down/idle time
Production cost per unit
Quality losses
Theoretical flow/cycle time of production
Actual average flow/cycle time<br>
slide16. Facilities Overall trade-off: Responsiveness versus efficiency
Cost of the number, location, capacity, and type of facilities (efficiency) and the level of responsiveness
Increasing the number of facilities increases facility and inventory costs but decreases transportation costs and reduces response time
Increasing the flexibility or capacity of a facility increases facility costs but decreases inventory costs and response time<br>
slide17. Overall Trade-Off Responsiveness versus efficiency
Cost of the number, location, capacity, and type of facilities (efficiency)
Level of responsiveness
Increasing number of facilities increases facility and inventory costs, decreases transportation costs and reduces response time
Increasing the flexibility or capacity of a facility increases facility costs, decreases inventory costs and response time<br>
slide18. Inventory Role in the Supply Chain
Mismatch between supply and demand
Satisfy demand
Exploit economies of scale
Impacts assets, costs, responsiveness, material flow time<br>
slide19. Inventory Material flow time, the time that elapses between the point at which material enters the supply chain to the point at which it exits
Throughput, the rate at which sales occur
Little’s law I = DT
where
I = flow time, T = throughput, D = demand<br>
slide20. Inventory Role in Competitive Strategy
Form, location, and quantity of inventory allow a supply chain to range from being very low cost to very responsive
Objective is to have right form, location, and quantity of inventory that provides the right level of responsiveness at the lowest possible cost<br>
slide21. Components of Inventory Decisions Cycle inventory
Average amount of inventory used to satisfy demand between shipments
Function of lot size decisions
Safety inventory
Inventory held in case demand exceeds expectations
Costs of carrying too much inventory versus cost of losing sales<br>
slide22. Components of Inventory Decisions Seasonal inventory
Inventory built up to counter predictable variability in demand
Cost of carrying additional inventory versus cost of flexible production
Level of product availability
The fraction of demand that is served on time from product held in inventory
Trade off between customer service and cost<br>
slide23. Components of Inventory Decisions Inventory-related metrics
Cash-to-cash cycle time
Average inventory
Inventory turns
Products with more than a specified number of days of inventory
Average replenishment batch size<br>
slide24. Components of Inventory Decisions Inventory-related metrics
Average safety inventory
Seasonal inventory
Fill rate
Fraction of time out of stock
Obsolete inventory<br>
slide25. Inventory Overall trade-off: Responsiveness versus efficiency
Increasing inventory generally makes the supply chain more responsive
A higher level of inventory facilitates a reduction in production and transportation costs because of improved economies of scale
Inventory holding costs increase<br>
slide26. Transportation Role in the Supply Chain
Moves the product between stages in the supply chain
Impact on responsiveness and efficiency
Faster transportation allows greater responsiveness but lower efficiency
Also affects inventory and facilities<br>
slide27. Transportation Role in the Competitive Strategy
Allows a firm to adjust the location of its facilities and inventory to find the right balance between responsiveness and efficiency
Components of Transportation Decisions
Design of transportation network
Modes, locations, and routes
Direct or with intermediate consolidation points
One or multiple supply or demand points in a single run<br>
slide28. Transportation Choice of transportation mode
Air, truck, rail, sea, and pipeline
Information goods via the Internet
Different speed, size of shipments, cost of shipping, and flexibility<br>
slide29. Transportation Transportation-related metrics
Average inbound transportation cost
Average income shipment size
Average inbound transportation cost per shipment
Average outbound transportation cost
Average outbound shipment size
Average outbound transportation cost per shipment
Fraction transported by mode<br>
slide30. Transportation Overall trade-off: Responsiveness versus efficiency
The cost of transporting a given product (efficiency) and the speed with which that product is transported (responsiveness)
Using fast modes of transport raises responsiveness and transportation cost but lowers the inventory holding cost<br>
slide31. Information Role in the Supply Chain
Improve the utilization of supply chain assets and the coordination of supply chain flows to increase responsiveness and reduce cost
Information is a key driver that can be used to provide higher responsiveness while simultaneously improving efficiency<br>
slide32. Information Role in the Competitive Strategy
Right information can help a supply chain better meet customer needs at lower cost
Improves visibility of transactions and coordination of decisions across the supply chain
Share the minimum amount of information required to achieve coordination<br>
slide33. Components of Information Decisions Push versus Pull
Different information requirements and uses
Coordination and information sharing
Supply chain coordination, all stages of a supply chain work toward the objective of maximizing total supply chain profitability based on shared information
Sales and operations planning (S&OP)
The process of creating an overall supply plan (production and inventories) to meet the anticipated level of demand (sales)<br>
slide34. Components of Information Decisions Enabling technologies
Electronic data interchange (EDI)
The Internet
Enterprise resource planning (ERP) systems
Supply chain management (SCM) software
Radio frequency identification (RFID)<br>
slide35. Components of Information Decisions Information-related metrics
Forecast horizon
Frequency update
Forecast error
Seasonal factors
Variance from plan
Ratio of demand variability to order variability<br>
slide36. Information Overall trade-off: Complexity versus value
Good information helps a firm improve both efficiency and responsiveness
More information is not always better
More information increases complexity and cost of both infrastructure and analysis exponentially while marginal value diminishes
Evaluate the minimum information required to accomplish the desired objectives<br>
slide37. Sourcing Role in the Supply Chain
Set of business processes required to purchase goods and services
Will tasks be performed by a source internal to the company or a third party
Globalization creates many more sourcing options with both considerable opportunity and potential risk<br>
slide38. Sourcing Role in the Competitive Strategy
Sourcing decisions are crucial because they affect the level of efficiency and responsiveness in a supply chain
Outsource to responsive third parties if it is too expensive to develop their own
Keep responsive process in-house to maintain control<br>
slide39. Components of Sourcing Decisions In-house or outsource
Perform a task in-house or outsource it to a third party
Supplier selection
Number of suppliers, evaluation and selection criteria, direct negotiations or auction
Procurement
The supplier sends product in response to customer orders<br>
slide40. Components of Sourcing Decisions Sourcing-related metrics
Days payable outstanding
Average purchase price
Range of purchase price
Average purchase quantity
Supply quality
Supply lead time
Fraction of on-time deliveries
Supplier reliability<br>
slide41. Sourcing Overall trade-off: Increase the supply chain surplus
Increase the size of the total surplus to be shared across the supply chain
Impact of sourcing on sales, service, production costs, inventory costs, transportation costs, and information cost
Outsource if it raises the supply chain surplus more than the firm can on its own
Keep function in-house if the third party cannot increase the supply chain surplus or if the outsourcing risk is significant<br>
slide42. Pricing Role in the Supply Chain
Pricing determines the amount to charge customers for goods and services
Affects the supply chain level of responsiveness required and the demand profile the supply chain attempts to serve
Pricing strategies can be used to match demand and supply<br>
slide43. Pricing Role in the Competitive Strategy
Firms can utilize optimal pricing strategies to improve efficiency and responsiveness
Pricing strategies vary to meet different customer responsiveness requirements<br>
slide44. Components of Pricing Decisions Pricing and economies of scale
The provider of the activity must decide how to price it appropriately to reflect these economies of scale
Everyday low pricing versus high-low pricing
Different pricing strategies lead to different demand profiles that the supply chain must serve<br>
slide45. Components of Pricing Decisions Fixed price versus menu pricing
If marginal supply chain costs or the value to the customer vary significantly along some attribute, it is often effective to have a pricing menu
Can lead to customer behavior that has a negative impact on profits<br>
slide46. Components of Pricing Decisions Pricing-related metrics
Profit margin
Days sales outstanding
Incremental fixed cost per order
Incremental variable cost per unit
Average sale price
Average order size
Range of sale price
Range of periodic sales<br>
slide47. Pricing Overall trade-off: Increase firm profits
Understand of the cost structure of performing a supply chain activity and the value this activity brings to the supply chain
Strategy may support efficiency in the supply chain, lower supply chain costs, defend market share, or steal market share
Differential pricing may be used to attract customers with varying needs
Strategy should help either increase revenues or shrink costs or preferably both<br>
slide48. Summary of Learning Objectives Describe key financial measures of firm performance
Identify the major drivers of supply chain performance
Discuss the role of each driver in creating strategic fit between the supply chain strategy and the competitive strategy
Define the key metrics that track the performance of the supply chain in terms of each driver<br>
slide49. All rights reserved. No part of this publication may be reproduced, stored in a retrieval system, or transmitted, in any form or by any means, electronic, mechanical, photocopying, recording, or otherwise, without the prior written permission of the publisher.
Printed in the United States of America.<br>