Support Vector Machines: A case study in quadratic programming MSE 214: Optimization via Case Studies Instructor: Ashish Goel Slides originally by Oliver Hinder The problem For current patients which we know if they have heart disease.
"Support Vector Machines: A case study in quadratic" is the property of its rightful owner. Permission is granted to
download and print the materials on this website for personal, non-commercial use only, and to display it
on your personal computer provided you do not modify the materials and that you retain all copyright
notices contained in the materials. By downloading content from our website, you accept the terms of this
agreement.
Presentation Transcript
01
Support Vector Machines: A case study in quadratic programming MS&E 214: Optimization via Case Studies
Instructor: Ashish Goel
Slides originally by Oliver Hinder<br>
02
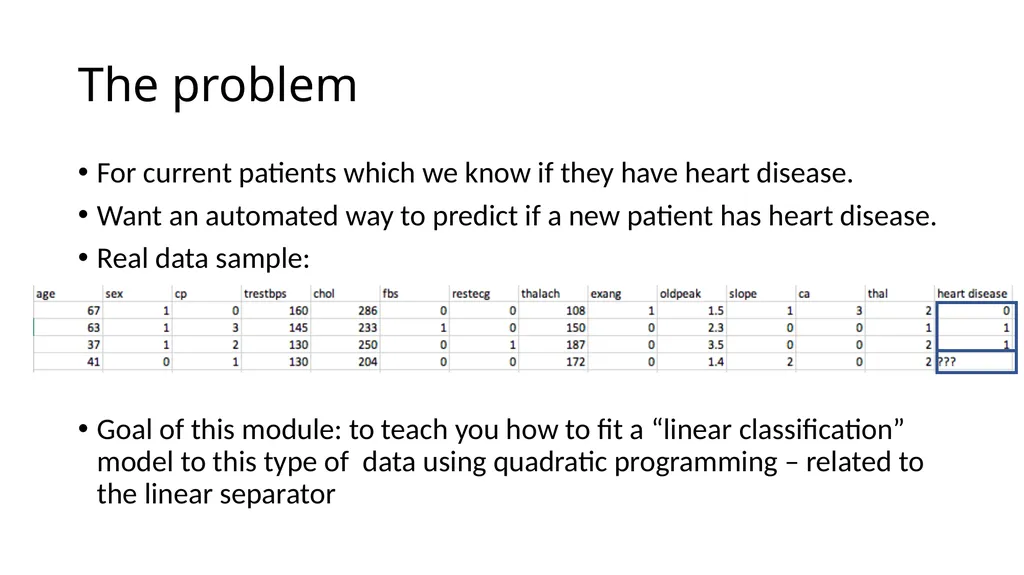
The problem For current patients which we know if they have heart disease.
Want an automated way to predict if a new patient has heart disease.
Real data sample:
Goal of this module: to teach you how to fit a “linear classification” model to this type of data using quadratic programming – related to the linear separator<br>
03
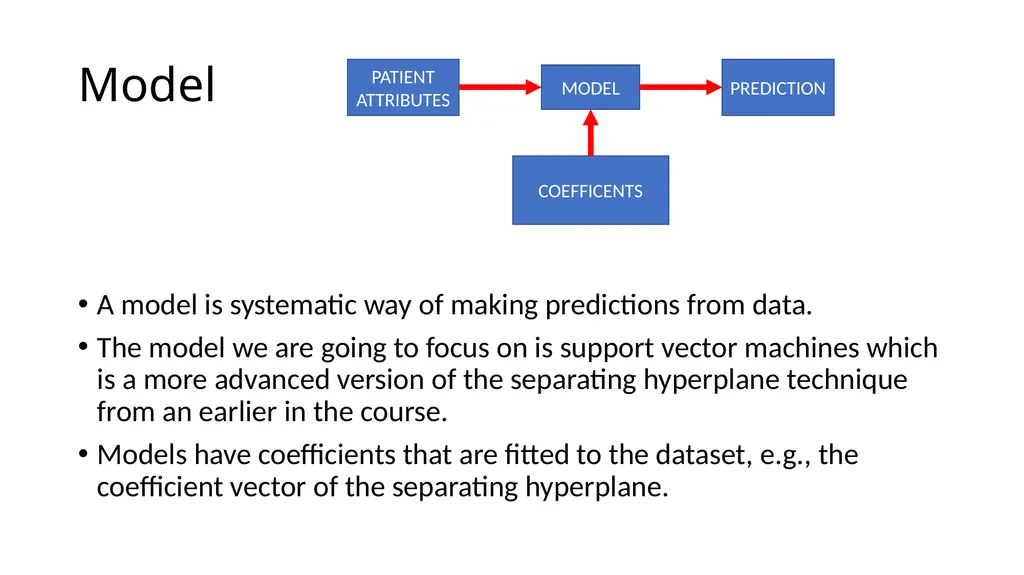
Model A model is systematic way of making predictions from data.
The model we are going to focus on is support vector machines which is a more advanced version of the separating hyperplane technique from an earlier in the course.
Models have coefficients that are fitted to the dataset, e.g., the coefficient vector of the separating hyperplane.<br>
04
Test and training sets You should always split your dataset into training and test data. Dataset<br>
05
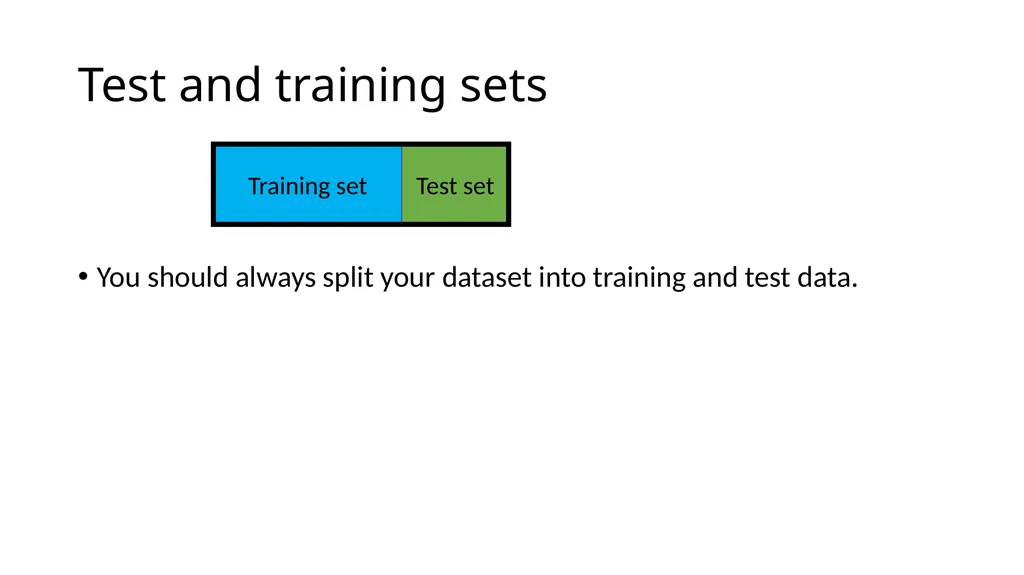
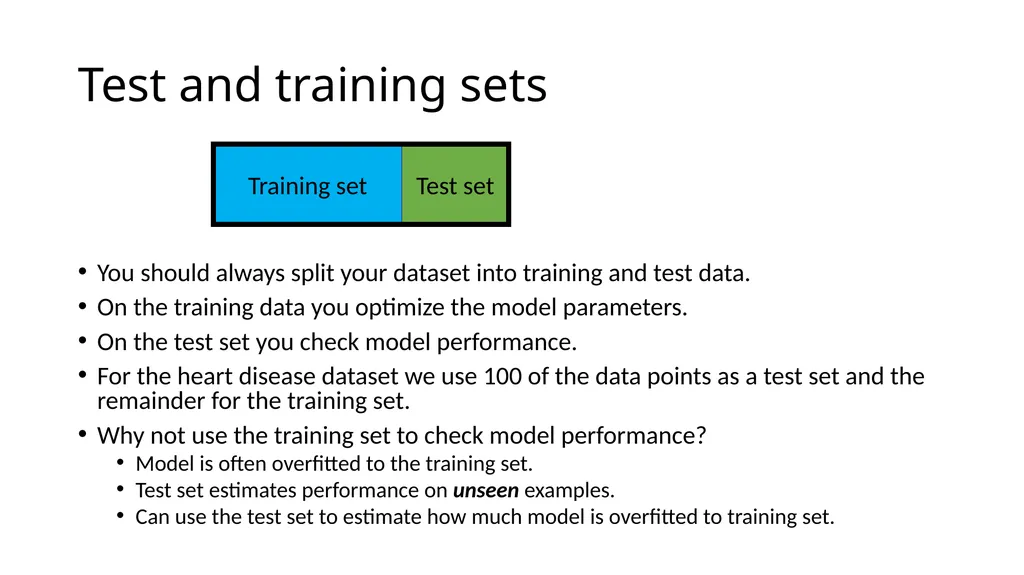
Test and training sets You should always split your dataset into training and test data. Test set Training set<br>
06
Test and training sets You should always split your dataset into training and test data.
On the training data you optimize the model parameters.
On the test set you check model performance.
For the heart disease dataset we use 100 of the data points as a test set and the remainder for the training set.
Why not use the training set to check model performance?
Model is often overfitted to the training set.
Test set estimates performance on unseen examples.
Can use the test set to estimate how much model is overfitted to training set. Test set Training set<br>
07
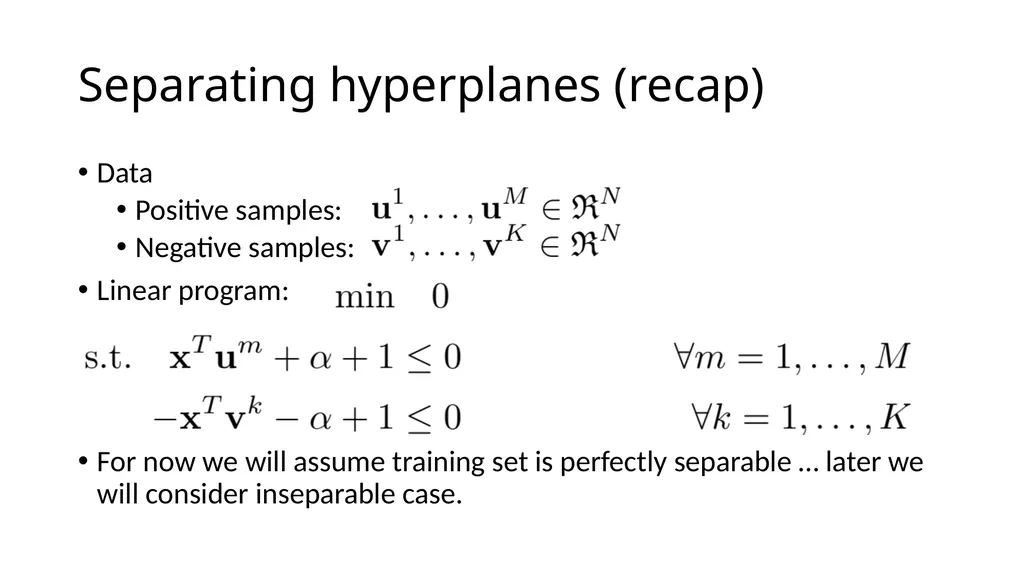
Separating hyperplanes (recap) Data
Positive samples:
Negative samples:
Linear program:
For now we will assume training set is perfectly separable … later we will consider inseparable case.<br>
08
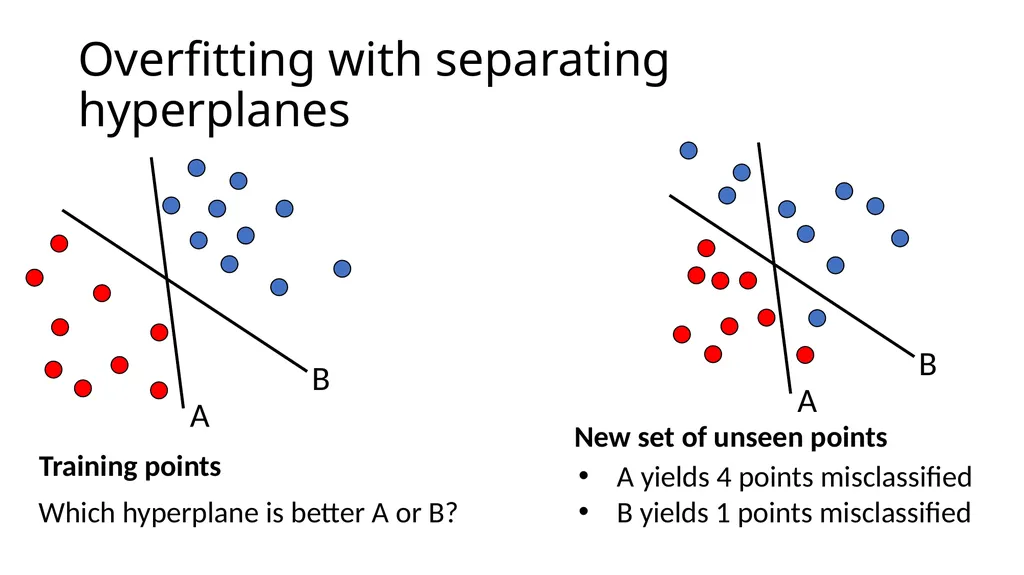
Overfitting with separating hyperplanes A yields 4 points misclassified
B yields 1 points misclassified Training points New set of unseen points Which hyperplane is better A or B?<br>
09
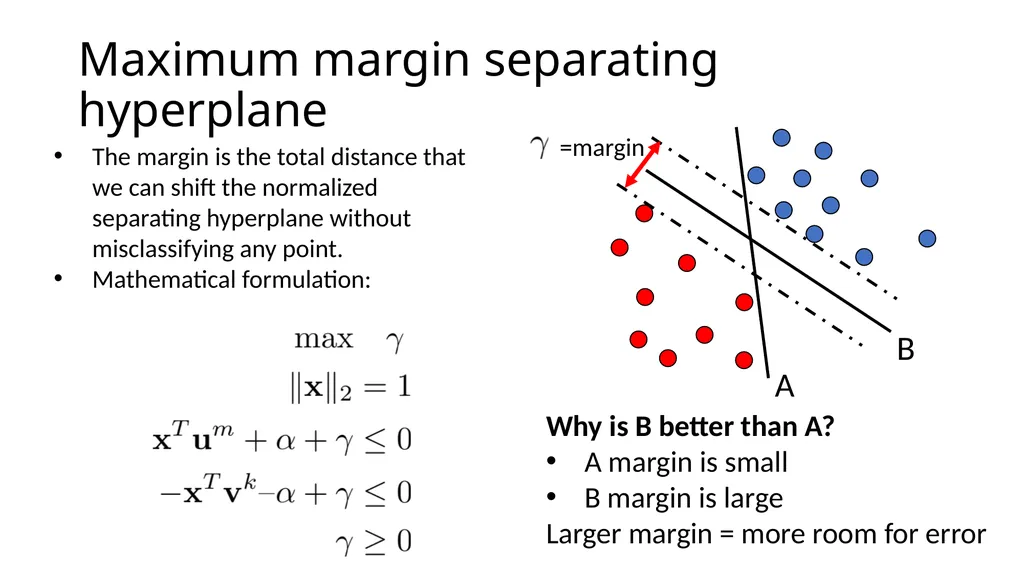
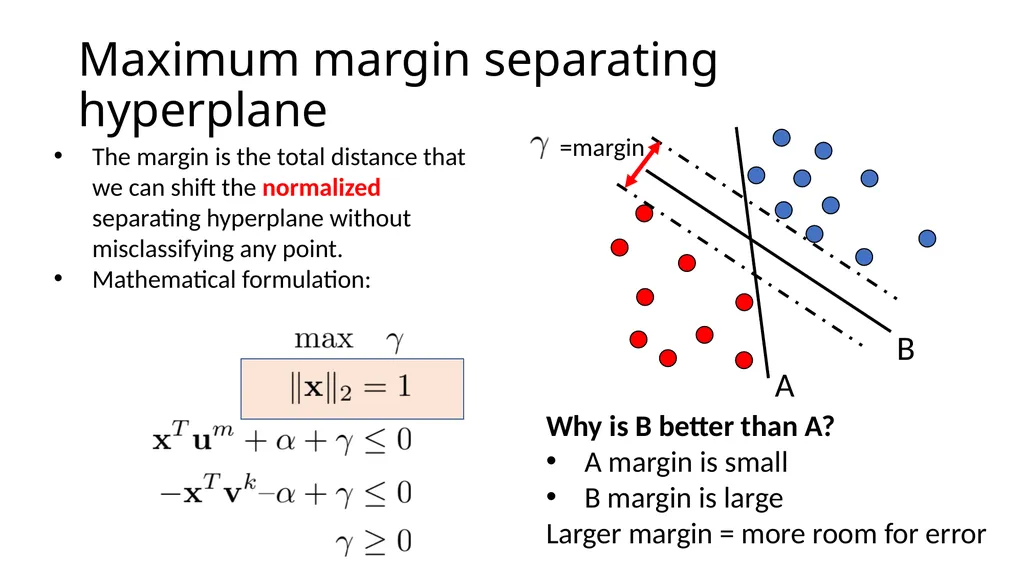
Maximum margin separating hyperplane Why is B better than A?
A margin is small
B margin is large
Larger margin = more room for error The margin is the total distance that we can shift the normalized separating hyperplane without misclassifying any point.
Mathematical formulation:<br>
10
Maximum margin separating hyperplane Why is B better than A?
A margin is small
B margin is large
Larger margin = more room for error The margin is the total distance that we can shift the normalized separating hyperplane without misclassifying any point.
Mathematical formulation:<br>
11
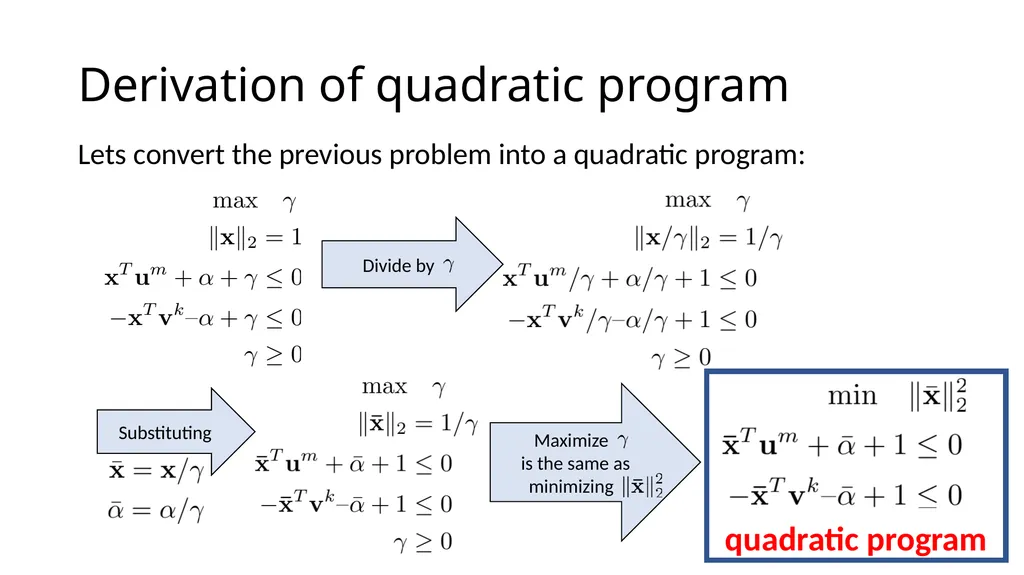
Derivation of quadratic program Lets convert the previous problem into a quadratic program: Substituting Divide by quadratic program<br>
12
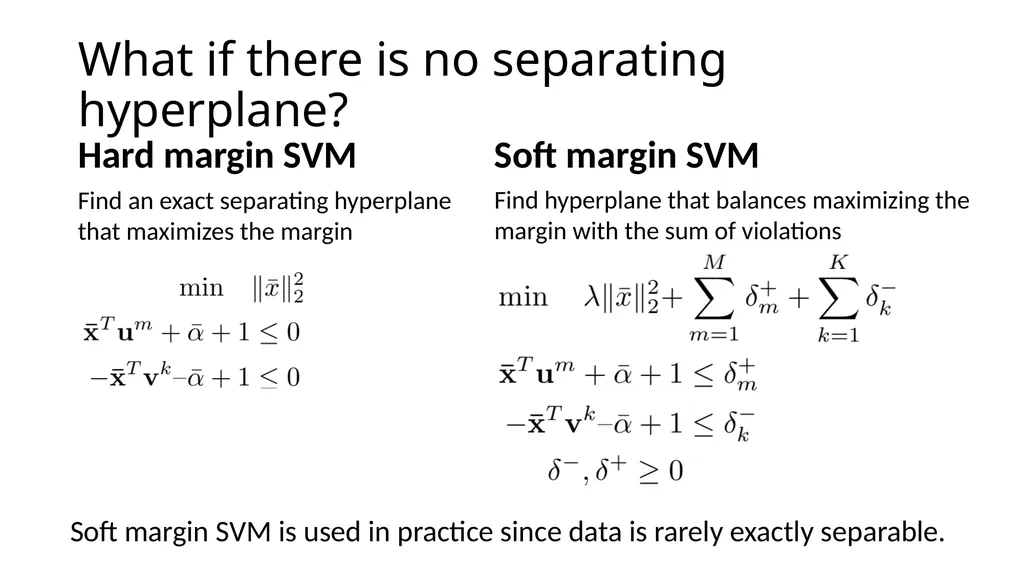
What if there is no separating hyperplane? Find an exact separating hyperplane that maximizes the margin Find hyperplane that balances maximizing the margin with the sum of violations Soft margin SVM Hard margin SVM Soft margin SVM is used in practice since data is rarely exactly separable.<br>
13
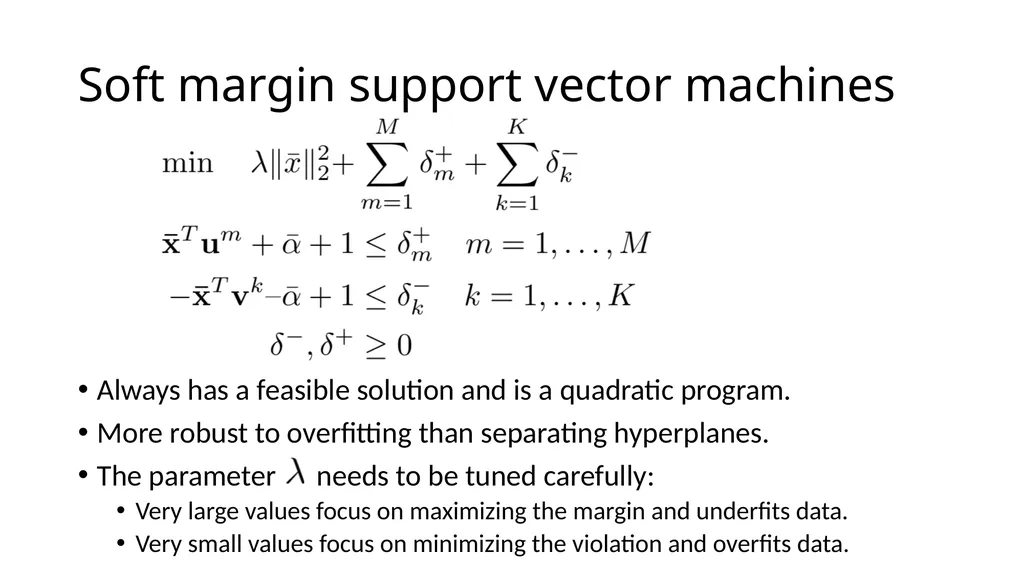
Soft margin support vector machines Always has a feasible solution and is a quadratic program.
More robust to overfitting than separating hyperplanes.
The parameter needs to be tuned carefully:
Very large values focus on maximizing the margin and underfits data.
Very small values focus on minimizing the violation and overfits data.<br>
14
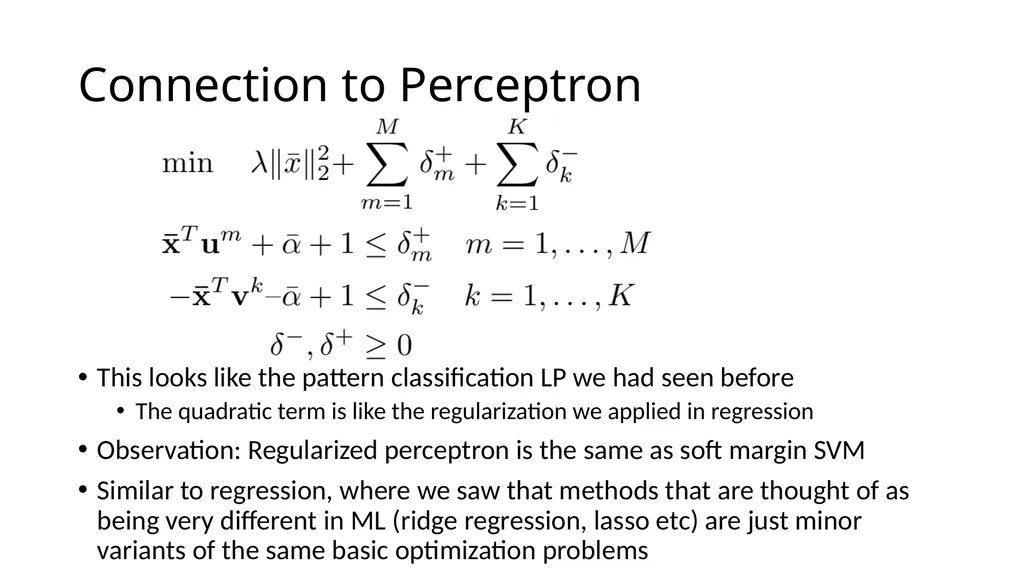
Connection to Perceptron This looks like the pattern classification LP we had seen before
The quadratic term is like the regularization we applied in regression
Observation: Regularized perceptron is the same as soft margin SVM
Similar to regression, where we saw that methods that are thought of as being very different in ML (ridge regression, lasso etc) are just minor variants of the same basic optimization problems<br>
15
Methods for solving SVM<br>
16
Excel Main benefit is easy to use with no programming experience.
Can formulate very tiny problems in excel (less than 50 data points).
Can solve slightly bigger problems if one purchases commercial software but might still be slow to solve problems with a few hundred data points and model coefficients. Also see https://opensolver.org/.<br>
17
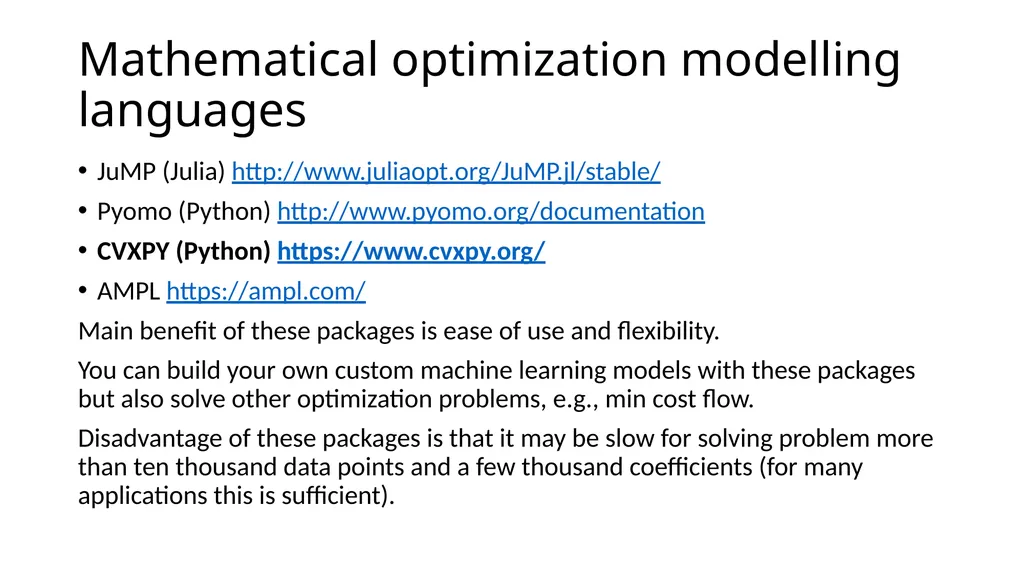
Mathematical optimization modelling languages JuMP (Julia) http://www.juliaopt.org/JuMP.jl/stable/
Pyomo (Python) http://www.pyomo.org/documentation
CVXPY (Python) https://www.cvxpy.org/
AMPL https://ampl.com/
Main benefit of these packages is ease of use and flexibility.
You can build your own custom machine learning models with these packages but also solve other optimization problems, e.g., min cost flow.
Disadvantage of these packages is that it may be slow for solving problem more than ten thousand data points and a few thousand coefficients (for many applications this is sufficient).<br>
18
Machine learning modelling languages Tensor flow (Python) https://www.tensorflow.org/
PyTorch (Python) https://pytorch.org/
Main benefit is the ability to train sophisticated models, e.g., neural networks.
Can be difficult to learn and cannot be used to solve non-machine learning optimization problems, e.g., minimum cost flow.<br>
19
Machine learning packages with SVM Statistics and Machine Learning Toolbox (Matlab)
Scikit (Python) https://scikit-learn.org/stable/tutorial/basic/tutorial.html
Main benefit is easy to learn and scalable.
Low flexibility – have to use model provided.<br>
20
Getting ready to implement SVM Remember to split the data into test and training set!
Divide each column by their standard deviation. This stops issues with poor scaling of data.
Try multiple different values of . Pick the value that makes the most correct classifications.
Since this for this data set we our algorithm to be conservative (i.e., always correctly classify individuals with heart disease) we may want to modify our objective accordingly.<br>