
Teaching staff digital experience insights survey
LD
Published · 26 slides · 0 views

1 / 1




Description
Teaching staff digital experience insights survey results Organisation name 2020-21 Instructions for using this template read and delete this slide The aim of this pro forma is to allow you to quickly pick out the key data from your
Related Topics
Share
Embed code
Download this presentation From Below
"Teaching staff digital experience insights survey" is the property of its rightful owner. Permission is granted to download and print the materials on this website for personal, non-commercial use only, and to display it on your personal computer provided you do not modify the materials and that you retain all copyright notices contained in the materials. By downloading content from our website, you accept the terms of this agreement.
Presentation Transcript
01
Teaching staff digital experience insights survey results Organisation name
2020-21<br>
2020-21<br>
02
Instructions for using this template – read and delete this slide The aim of this pro forma is to allow you to quickly pick out the key data from your insights surveys and share this with others in your organisation
We recommend that you complete this in conjunction with the Jisc guidance (Using insights surveys in Jisc online survey) – under the sub-section ‘Accessing the data collected during and after the survey is live’ which can be found here
This template aims to focus on the main data relevant at an organisational-level
Where possible you should compare and contrast the teaching staff results with your other insight surveys (if you ran these surveys as well) – note there is a separate Excel spreadsheet and PowerPoint slides to build charts that compare across different surveys
Note that all text highlighted in grey is for reference only, so should be read and then deleted. Text highlighted in yellow is where you need to insert information from your organisational results.<br>
We recommend that you complete this in conjunction with the Jisc guidance (Using insights surveys in Jisc online survey) – under the sub-section ‘Accessing the data collected during and after the survey is live’ which can be found here
This template aims to focus on the main data relevant at an organisational-level
Where possible you should compare and contrast the teaching staff results with your other insight surveys (if you ran these surveys as well) – note there is a separate Excel spreadsheet and PowerPoint slides to build charts that compare across different surveys
Note that all text highlighted in grey is for reference only, so should be read and then deleted. Text highlighted in yellow is where you need to insert information from your organisational results.<br>
03
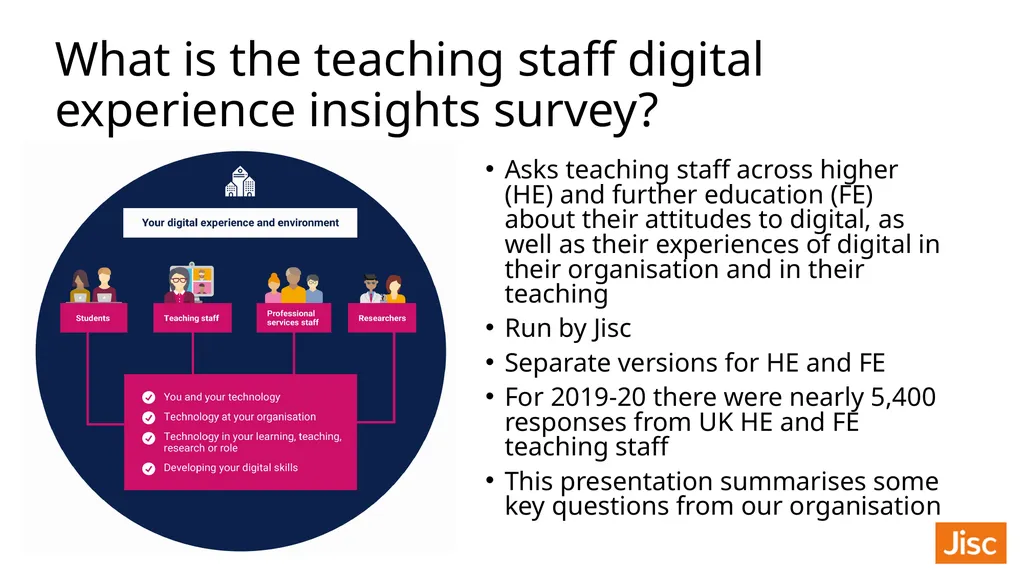
What is the teaching staff digital experience insights survey? Asks teaching staff across higher (HE) and further education (FE) about their attitudes to digital, as well as their experiences of digital in their organisation and in their teaching
Run by Jisc
Separate versions for HE and FE
For 2019-20 there were nearly 5,400 responses from UK HE and FE teaching staff
This presentation summarises some key questions from our organisation<br>
Run by Jisc
Separate versions for HE and FE
For 2019-20 there were nearly 5,400 responses from UK HE and FE teaching staff
This presentation summarises some key questions from our organisation<br>
04
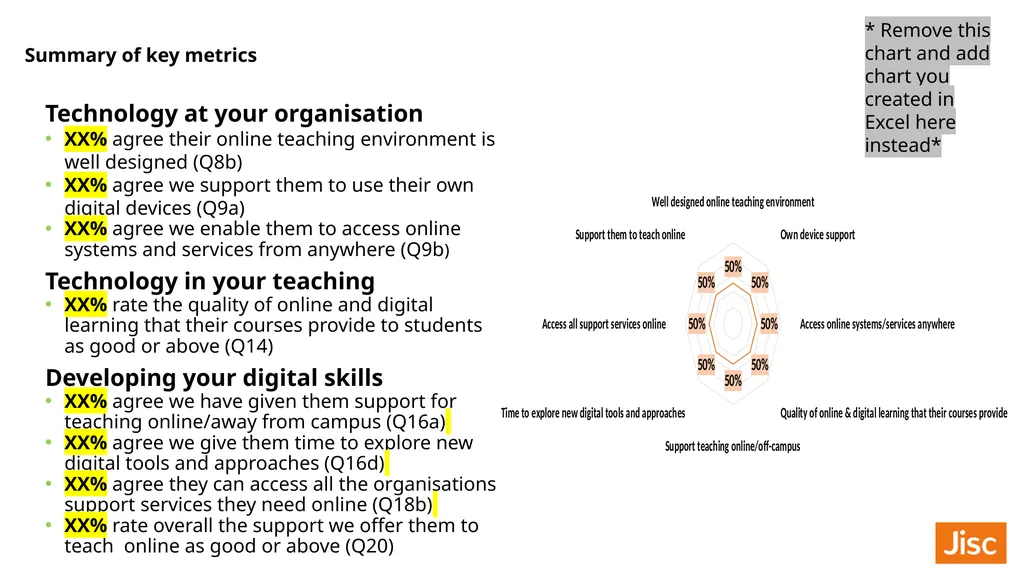
Summary of key metrics Technology at your organisation
XX% agree their online teaching environment is well designed (Q8b)
XX% agree we support them to use their own digital devices (Q9a)
XX% agree we enable them to access online systems and services from anywhere (Q9b)
Technology in your teaching
XX% rate the quality of online and digital learning that their courses provide to students as good or above (Q14)
Developing your digital skills
XX% agree we have given them support for teaching online/away from campus (Q16a)
XX% agree we give them time to explore new digital tools and approaches (Q16d)
XX% agree they can access all the organisations support services they need online (Q18b)
XX% rate overall the support we offer them to teach online as good or above (Q20) * Remove this chart and add chart you created in Excel here instead*<br>
XX% agree their online teaching environment is well designed (Q8b)
XX% agree we support them to use their own digital devices (Q9a)
XX% agree we enable them to access online systems and services from anywhere (Q9b)
Technology in your teaching
XX% rate the quality of online and digital learning that their courses provide to students as good or above (Q14)
Developing your digital skills
XX% agree we have given them support for teaching online/away from campus (Q16a)
XX% agree we give them time to explore new digital tools and approaches (Q16d)
XX% agree they can access all the organisations support services they need online (Q18b)
XX% rate overall the support we offer them to teach online as good or above (Q20) * Remove this chart and add chart you created in Excel here instead*<br>
05
Key findings How do the percentages compare with the findings in the other insight surveys on the same questions (if your organisation took these surveys as well)? – place comparative charts on this slide
What are the ‘good news’ stories? What do you do well? What could improve? What relates to other organisational plans?
Suggested next steps, dissemination of results to teaching staff and future partnership methods<br>
What are the ‘good news’ stories? What do you do well? What could improve? What relates to other organisational plans?
Suggested next steps, dissemination of results to teaching staff and future partnership methods<br>
06
Benchmarking with other UK organisations<br>
07
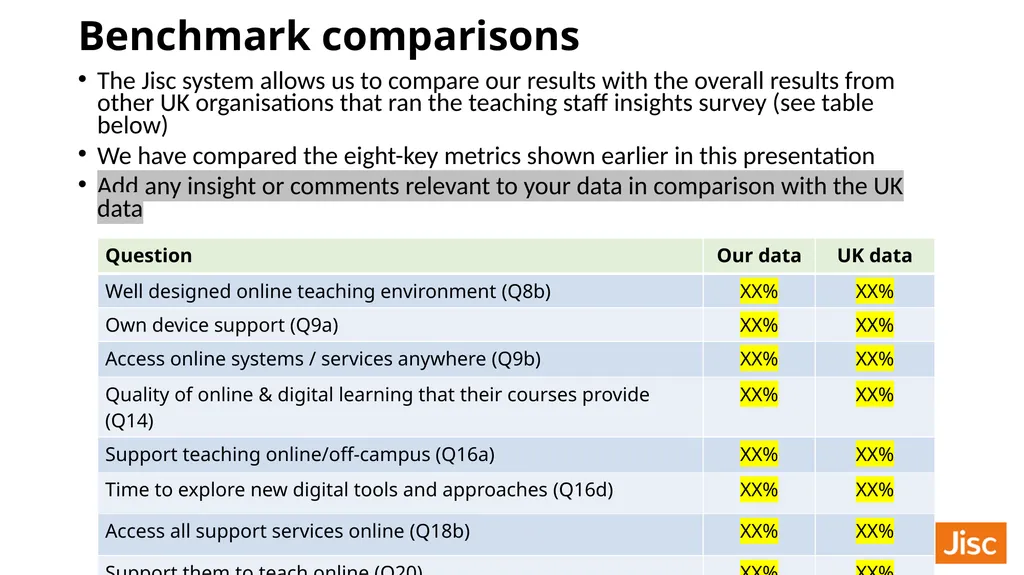
Benchmark comparisons The Jisc system allows us to compare our results with the overall results from other UK organisations that ran the teaching staff insights survey (see table below)
We have compared the eight-key metrics shown earlier in this presentation
Add any insight or comments relevant to your data in comparison with the UK data<br>
We have compared the eight-key metrics shown earlier in this presentation
Add any insight or comments relevant to your data in comparison with the UK data<br>
08
Findings by section<br>
09
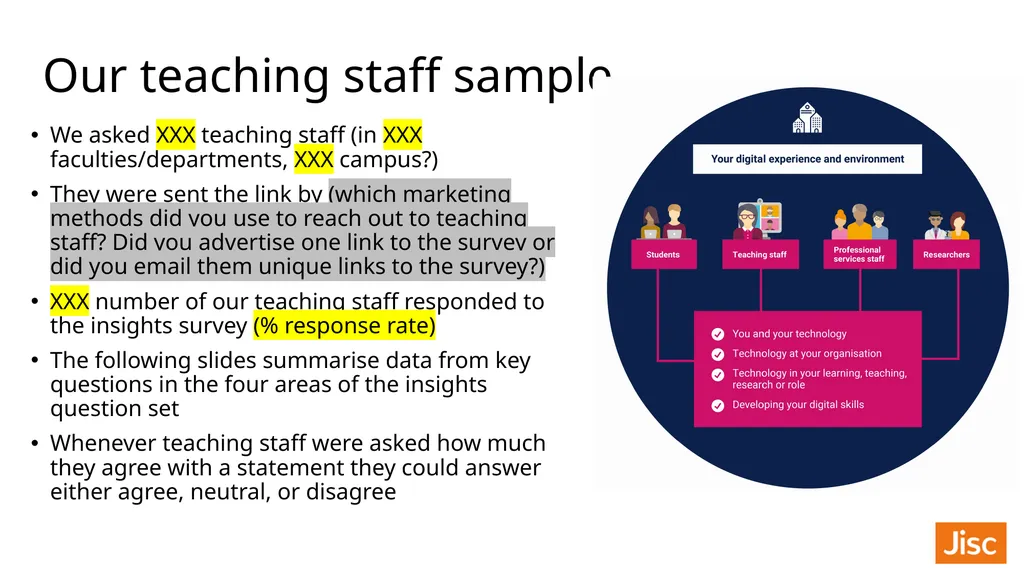
Our teaching staff sample We asked XXX teaching staff (in XXX faculties/departments, XXX campus?)
They were sent the link by (which marketing methods did you use to reach out to teaching staff? Did you advertise one link to the survey or did you email them unique links to the survey?)
XXX number of our teaching staff responded to the insights survey (% response rate)
The following slides summarise data from key questions in the four areas of the insights question set
Whenever teaching staff were asked how much they agree with a statement they could answer either agree, neutral, or disagree<br>
They were sent the link by (which marketing methods did you use to reach out to teaching staff? Did you advertise one link to the survey or did you email them unique links to the survey?)
XXX number of our teaching staff responded to the insights survey (% response rate)
The following slides summarise data from key questions in the four areas of the insights question set
Whenever teaching staff were asked how much they agree with a statement they could answer either agree, neutral, or disagree<br>
10
You and your technology - 1 Percentage of teaching staff that responded to the survey:
XX% gender split (Q6)
XX% split by number of years they have worked here in a teaching role (Q5)
How does this compare with your data from other sources outside of insights survey?
Does this sample look representative of your teaching staff?<br>
XX% gender split (Q6)
XX% split by number of years they have worked here in a teaching role (Q5)
How does this compare with your data from other sources outside of insights survey?
Does this sample look representative of your teaching staff?<br>
11
You and your technology - 2 XX% said ‘yes’ we have offered them support to use assistive technologies (Q7a) (of those who cited using at least one in Q7)<br>
12
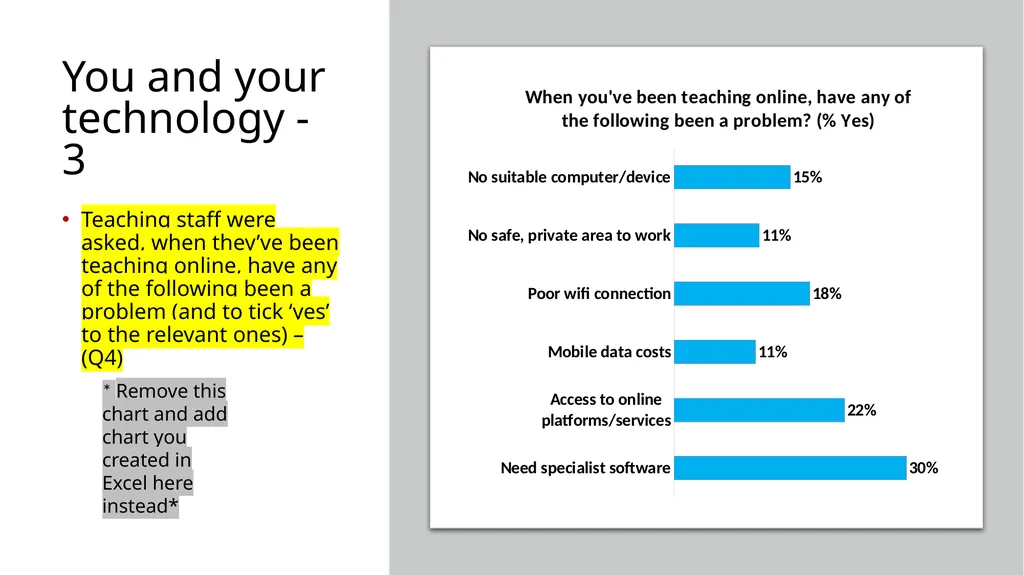
You and your technology - 3 Teaching staff were asked, when they’ve been teaching online, have any of the following been a problem (and to tick ‘yes’ to the relevant ones) – (Q4) * Remove this chart and add chart you created in Excel here instead*<br>
13
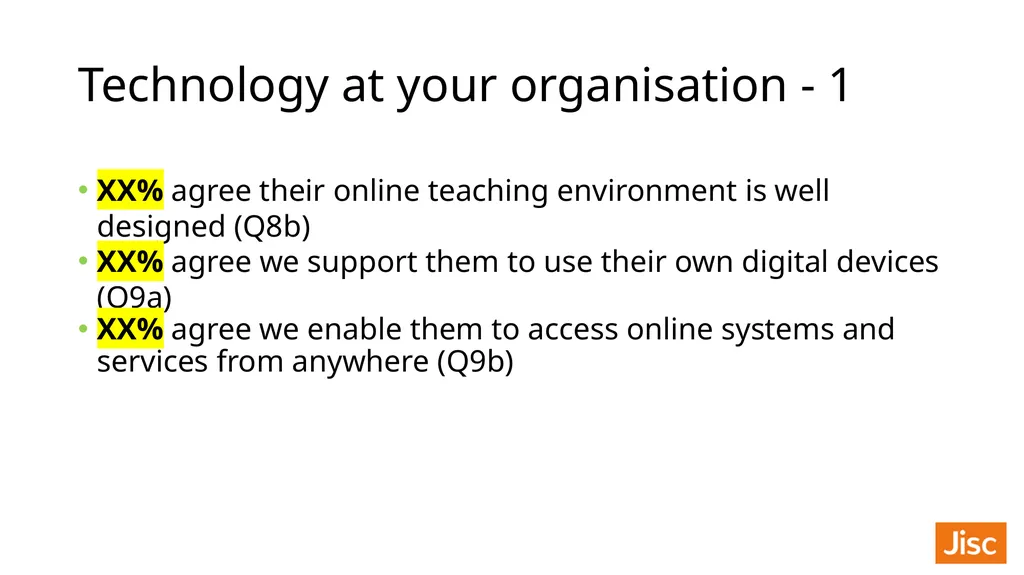
Technology at your organisation - 1 XX% agree their online teaching environment is well designed (Q8b)
XX% agree we support them to use their own digital devices (Q9a)
XX% agree we enable them to access online systems and services from anywhere (Q9b)<br>
XX% agree we support them to use their own digital devices (Q9a)
XX% agree we enable them to access online systems and services from anywhere (Q9b)<br>
14
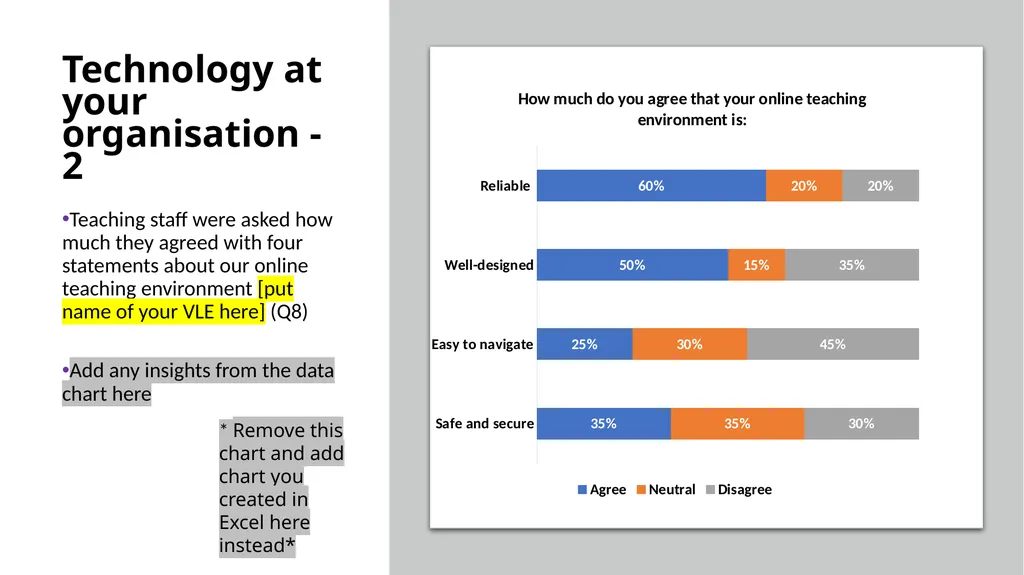
Technology at your organisation - 2 Teaching staff were asked how much they agreed with four statements about our online teaching environment [put name of your VLE here] (Q8)
Add any insights from the data chart here * Remove this chart and add chart you created in Excel here instead*<br>
Add any insights from the data chart here * Remove this chart and add chart you created in Excel here instead*<br>
15
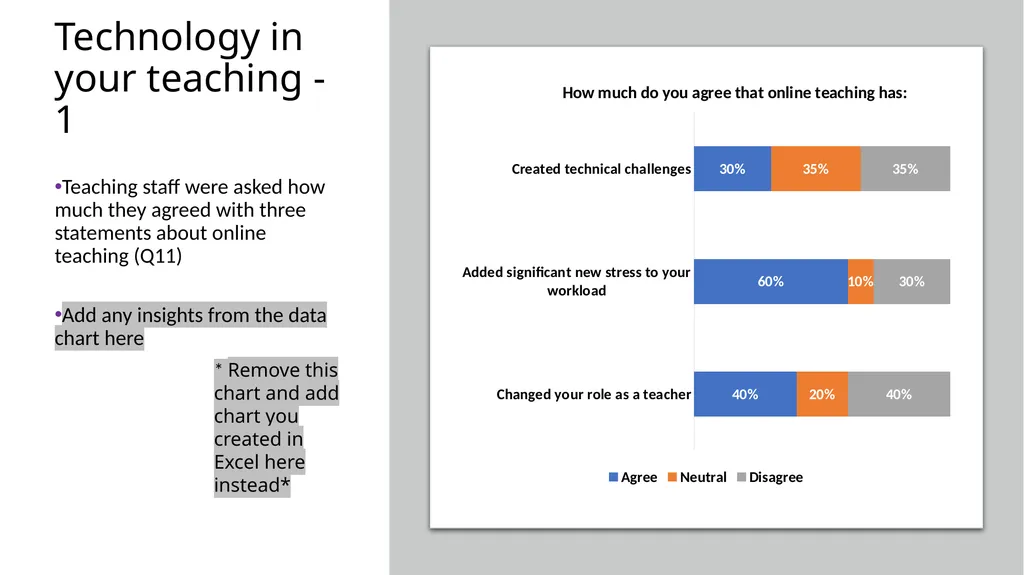
Technology in your teaching - 1 Teaching staff were asked how much they agreed with three statements about online teaching (Q11)
Add any insights from the data chart here * Remove this chart and add chart you created in Excel here instead*<br>
Add any insights from the data chart here * Remove this chart and add chart you created in Excel here instead*<br>
16
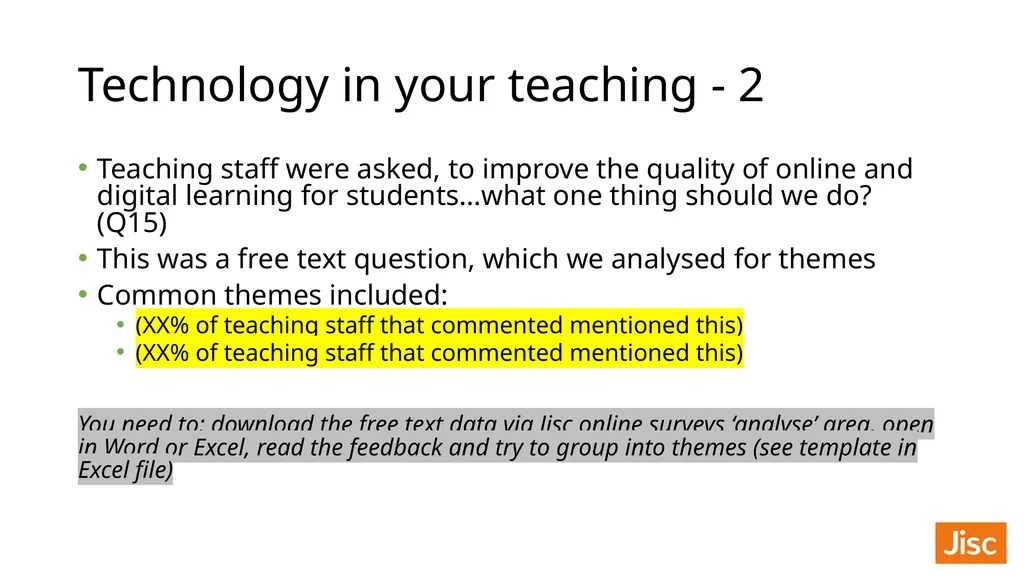
Technology in your teaching - 2 Teaching staff were asked, to improve the quality of online and digital learning for students…what one thing should we do? (Q15)
This was a free text question, which we analysed for themes
Common themes included:
(XX% of teaching staff that commented mentioned this)
(XX% of teaching staff that commented mentioned this)
You need to: download the free text data via Jisc online surveys ‘analyse’ area, open in Word or Excel, read the feedback and try to group into themes (see template in Excel file)<br>
This was a free text question, which we analysed for themes
Common themes included:
(XX% of teaching staff that commented mentioned this)
(XX% of teaching staff that commented mentioned this)
You need to: download the free text data via Jisc online surveys ‘analyse’ area, open in Word or Excel, read the feedback and try to group into themes (see template in Excel file)<br>
17
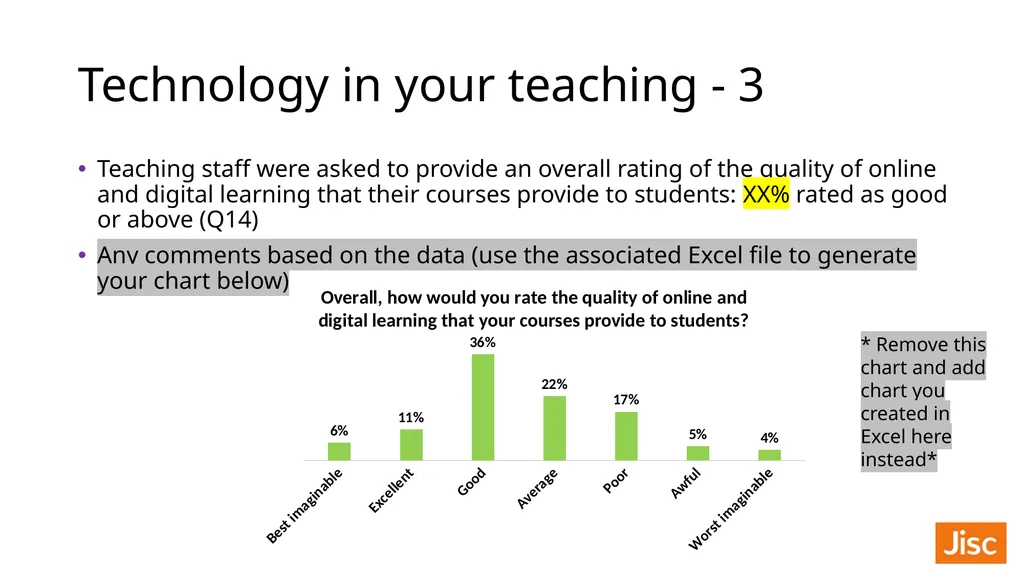
Technology in your teaching - 3 Teaching staff were asked to provide an overall rating of the quality of online and digital learning that their courses provide to students: XX% rated as good or above (Q14)
Any comments based on the data (use the associated Excel file to generate your chart below) * Remove this chart and add chart you created in Excel here instead*<br>
Any comments based on the data (use the associated Excel file to generate your chart below) * Remove this chart and add chart you created in Excel here instead*<br>
18
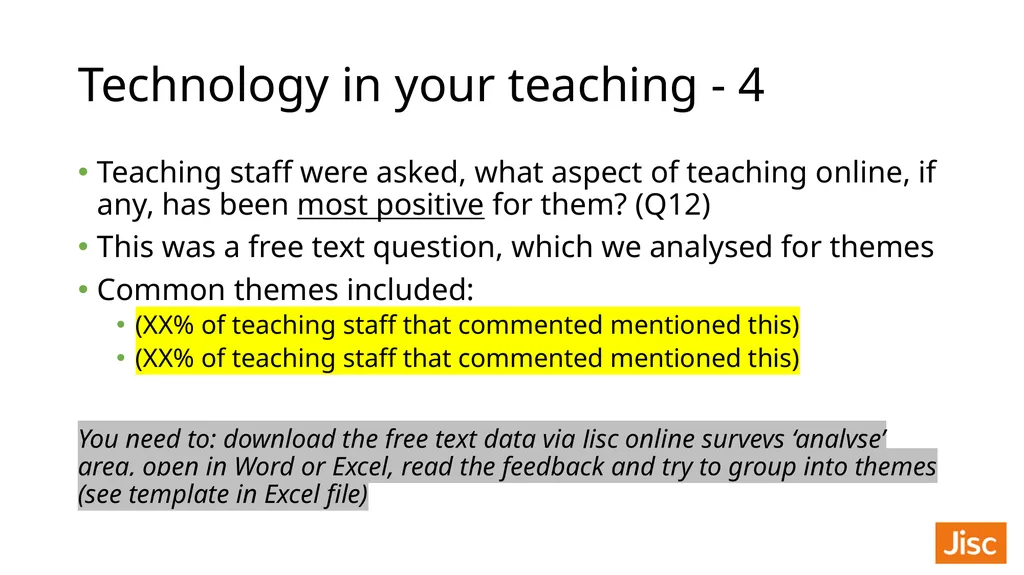
Technology in your teaching - 4 Teaching staff were asked, what aspect of teaching online, if any, has been most positive for them? (Q12)
This was a free text question, which we analysed for themes
Common themes included:
(XX% of teaching staff that commented mentioned this)
(XX% of teaching staff that commented mentioned this)
You need to: download the free text data via Jisc online surveys ‘analyse’ area, open in Word or Excel, read the feedback and try to group into themes (see template in Excel file)<br>
This was a free text question, which we analysed for themes
Common themes included:
(XX% of teaching staff that commented mentioned this)
(XX% of teaching staff that commented mentioned this)
You need to: download the free text data via Jisc online surveys ‘analyse’ area, open in Word or Excel, read the feedback and try to group into themes (see template in Excel file)<br>
19
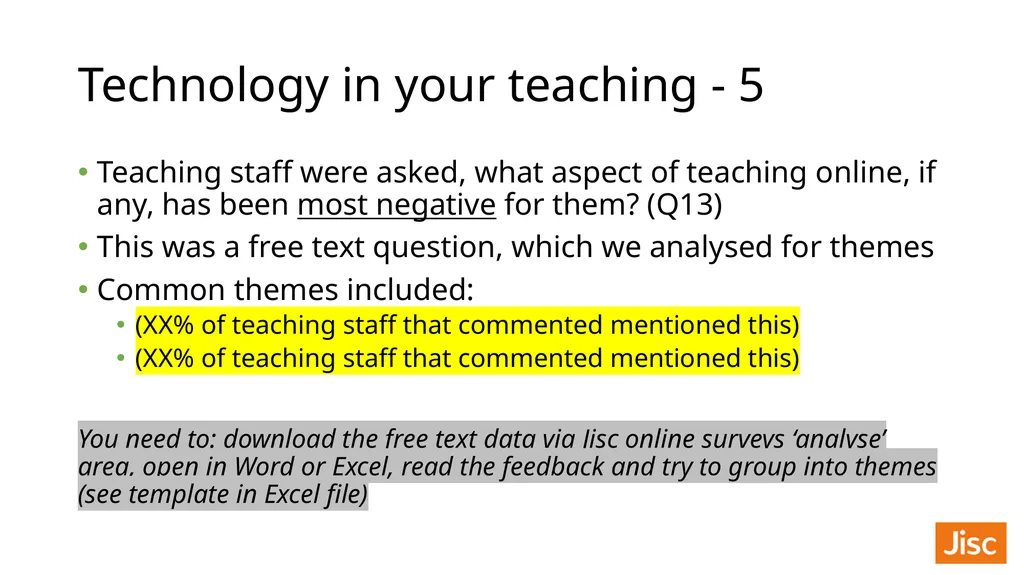
Technology in your teaching - 5 Teaching staff were asked, what aspect of teaching online, if any, has been most negative for them? (Q13)
This was a free text question, which we analysed for themes
Common themes included:
(XX% of teaching staff that commented mentioned this)
(XX% of teaching staff that commented mentioned this)
You need to: download the free text data via Jisc online surveys ‘analyse’ area, open in Word or Excel, read the feedback and try to group into themes (see template in Excel file)<br>
This was a free text question, which we analysed for themes
Common themes included:
(XX% of teaching staff that commented mentioned this)
(XX% of teaching staff that commented mentioned this)
You need to: download the free text data via Jisc online surveys ‘analyse’ area, open in Word or Excel, read the feedback and try to group into themes (see template in Excel file)<br>
20
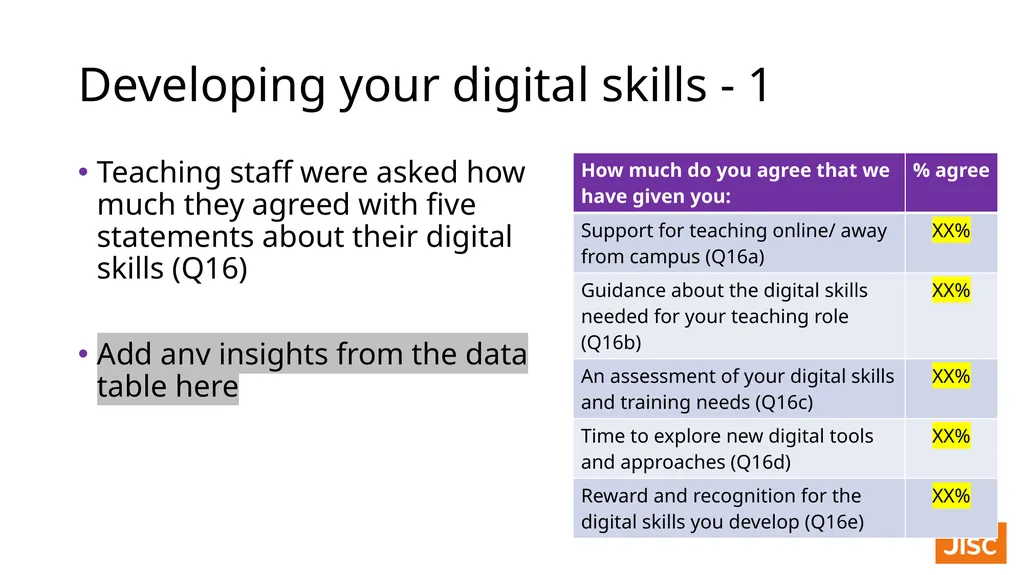
Developing your digital skills - 1 Teaching staff were asked how much they agreed with five statements about their digital skills (Q16)
Add any insights from the data table here<br>
Add any insights from the data table here<br>
21
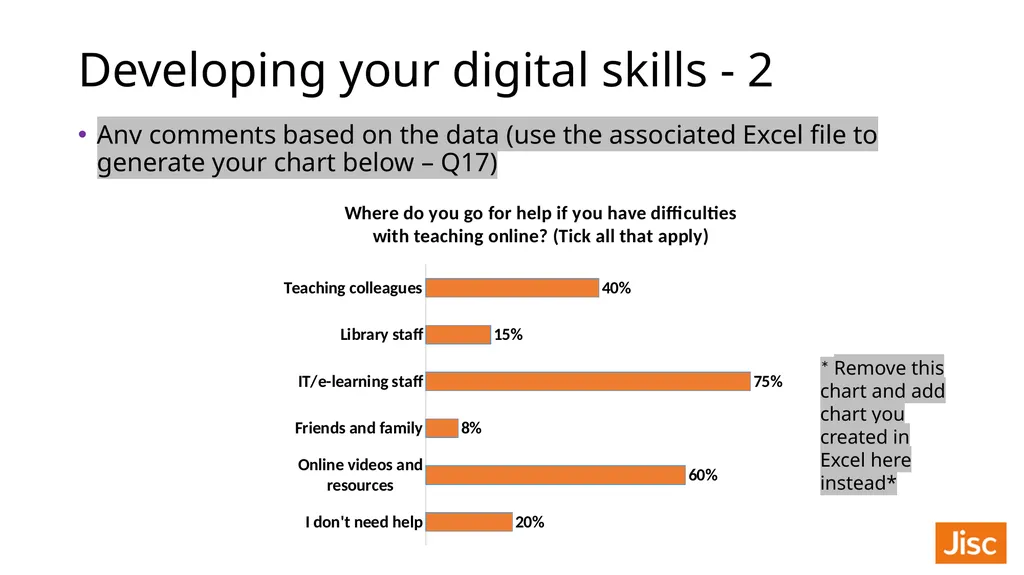
Developing your digital skills - 2 Any comments based on the data (use the associated Excel file to generate your chart below – Q17) * Remove this chart and add chart you created in Excel here instead*<br>
22
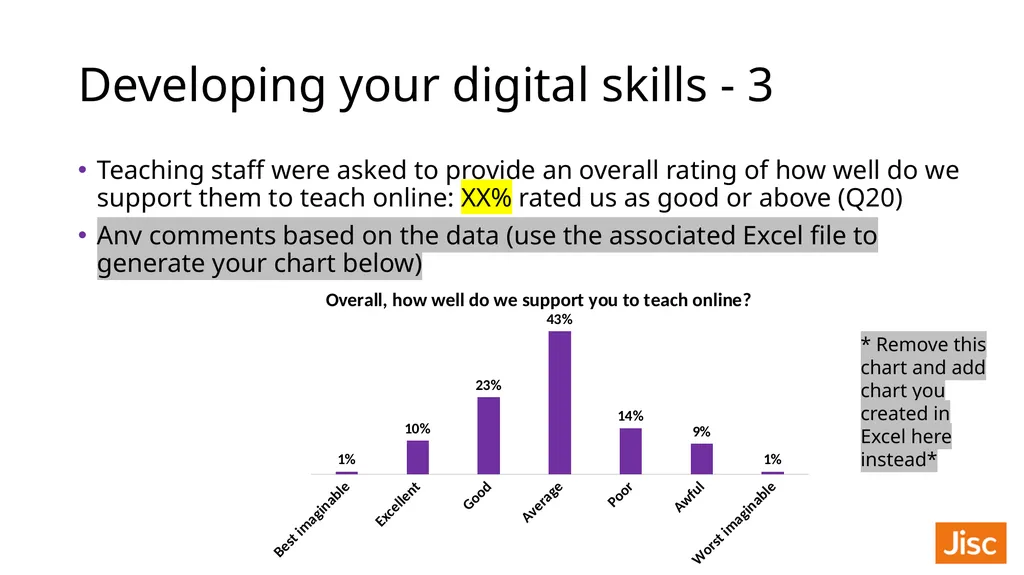
Developing your digital skills - 3 Teaching staff were asked to provide an overall rating of how well do we support them to teach online: XX% rated us as good or above (Q20)
Any comments based on the data (use the associated Excel file to generate your chart below) * Remove this chart and add chart you created in Excel here instead*<br>
Any comments based on the data (use the associated Excel file to generate your chart below) * Remove this chart and add chart you created in Excel here instead*<br>
23
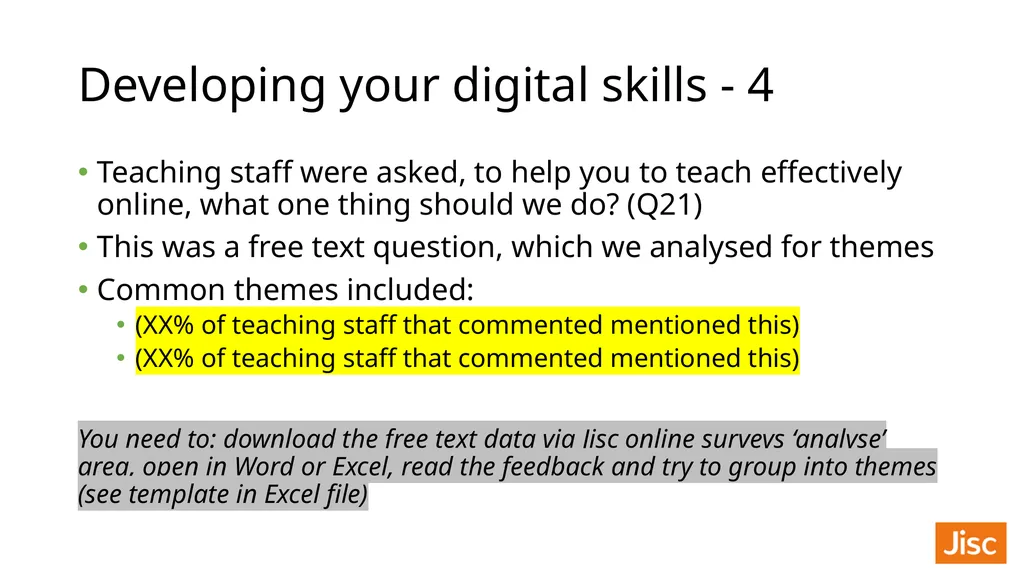
Developing your digital skills - 4 Teaching staff were asked, to help you to teach effectively online, what one thing should we do? (Q21)
This was a free text question, which we analysed for themes
Common themes included:
(XX% of teaching staff that commented mentioned this)
(XX% of teaching staff that commented mentioned this)
You need to: download the free text data via Jisc online surveys ‘analyse’ area, open in Word or Excel, read the feedback and try to group into themes (see template in Excel file)<br>
This was a free text question, which we analysed for themes
Common themes included:
(XX% of teaching staff that commented mentioned this)
(XX% of teaching staff that commented mentioned this)
You need to: download the free text data via Jisc online surveys ‘analyse’ area, open in Word or Excel, read the feedback and try to group into themes (see template in Excel file)<br>
24
Suggested next steps<br>
25
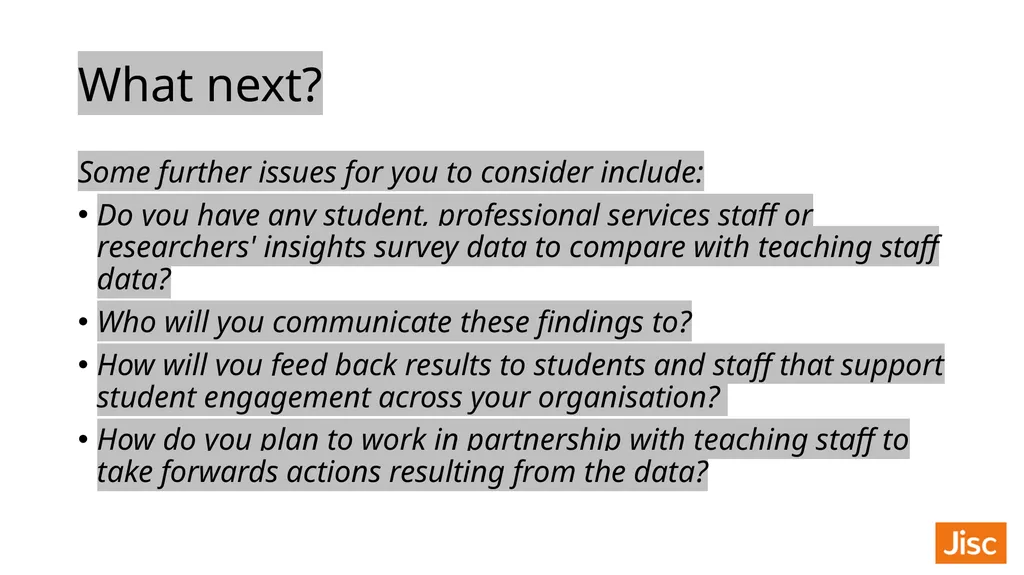
What next? Some further issues for you to consider include:
Do you have any student, professional services staff or researchers' insights survey data to compare with teaching staff data?
Who will you communicate these findings to?
How will you feed back results to students and staff that support student engagement across your organisation?
How do you plan to work in partnership with teaching staff to take forwards actions resulting from the data?<br>
Do you have any student, professional services staff or researchers' insights survey data to compare with teaching staff data?
Who will you communicate these findings to?
How will you feed back results to students and staff that support student engagement across your organisation?
How do you plan to work in partnership with teaching staff to take forwards actions resulting from the data?<br>
26
The end<br>