The Basics of Structural Equation Modeling (SEM) Wanzhu Shi, PH.D. Assistant Professor Social Science Department Texas AM International University Interactive Tool: https:forms.gleRNhSefaoDJ9vcqEF6 On March 27 2020, the city of Laredo
"The Basics of Structural Equation Modeling (SEM)" is the property of its rightful owner. Permission is granted to
download and print the materials on this website for personal, non-commercial use only, and to display it
on your personal computer provided you do not modify the materials and that you retain all copyright
notices contained in the materials. By downloading content from our website, you accept the terms of this
agreement.
Presentation Transcript
01
The Basics of Structural Equation Modeling (SEM) Wanzhu Shi, PH.D.
Assistant Professor
Social Science Department
Texas A&M International University Interactive Tool: https://forms.gle/RNhSefaoDJ9vcqEF6<br>
02
On March 27 2020, the city of Laredo issued a lockdown order due to the urgent spread of COVID-19. All non-essential businesses must close and unnecessary travel stop. No public gatherings of any size were allowed, and even travel by bicycle or “foot travel” was prohibited, unless it was “essential activities”
Although the self-quarantine was necessary during that time, many people began to have psychological issues. Researchers begin to notice that the COVID-19 virus has influenced people’s quality of life comprehensively.<br>
03
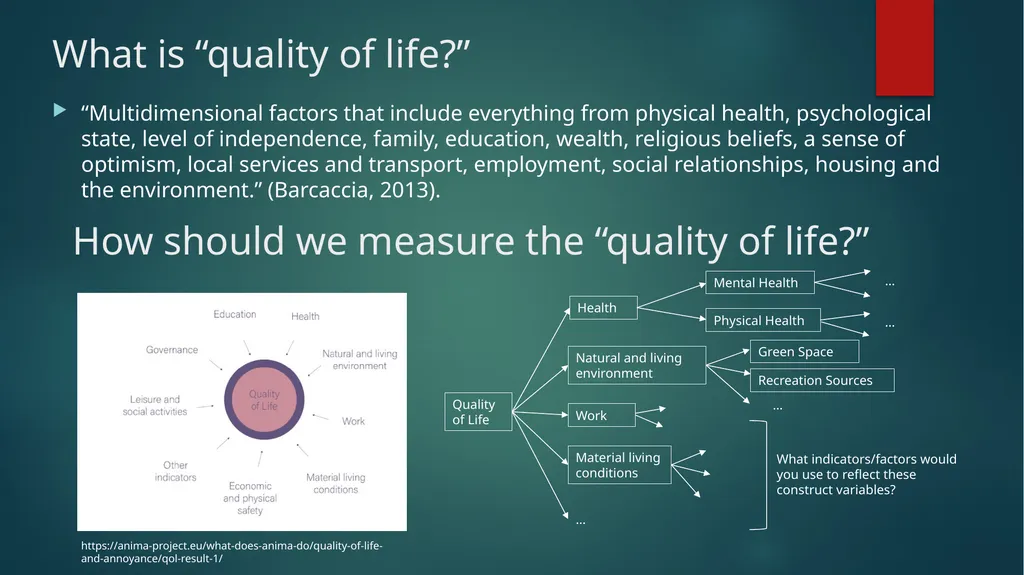
What is “quality of life?” “Multidimensional factors that include everything from physical health, psychological state, level of independence, family, education, wealth, religious beliefs, a sense of optimism, local services and transport, employment, social relationships, housing and the environment.” (Barcaccia, 2013). How should we measure the “quality of life?” https://anima-project.eu/what-does-anima-do/quality-of-life-and-annoyance/qol-result-1/ Quality of Life Health Natural and living environment Work Material living conditions … Mental Health Physical Health … … Green Space Recreation Sources … What indicators/factors would you use to reflect these construct variables?<br>
04
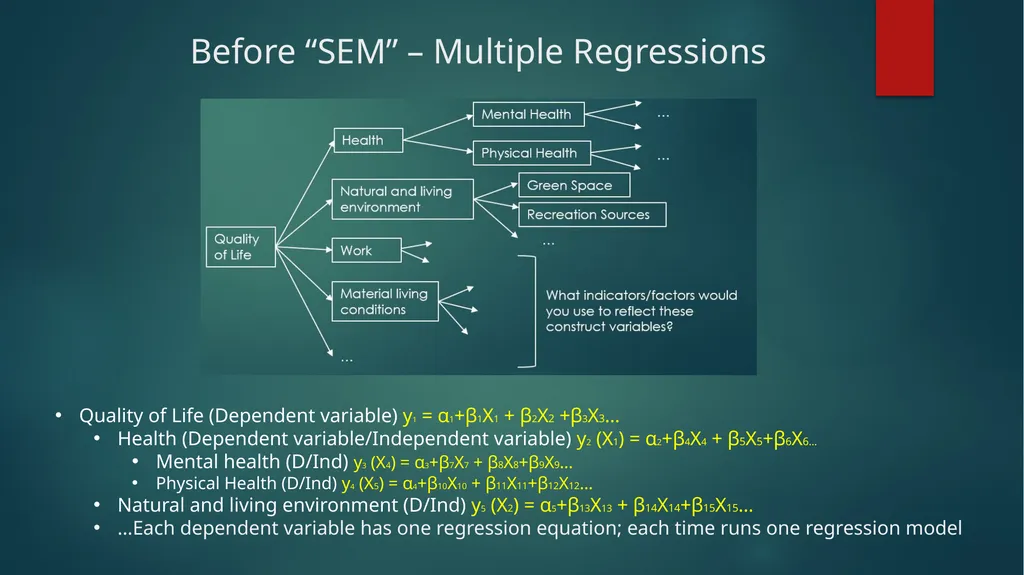
Before “SEM” – Multiple Regressions Quality of Life (Dependent variable) y1 = α1+β1X1 + β2X2 +β3X3…
Health (Dependent variable/Independent variable) y2 (X1) = α2+β4X4 + β5X5+β6X6…
Mental health (D/Ind) y3 (X4) = α3+β7X7 + β8X8+β9X9…
Physical Health (D/Ind) y4 (X5) = α4+β10X10 + β11X11+β12X12…
Natural and living environment (D/Ind) y5 (X2) = α5+β13X13 + β14X14+β15X15…
…Each dependent variable has one regression equation; each time runs one regression model<br>
05
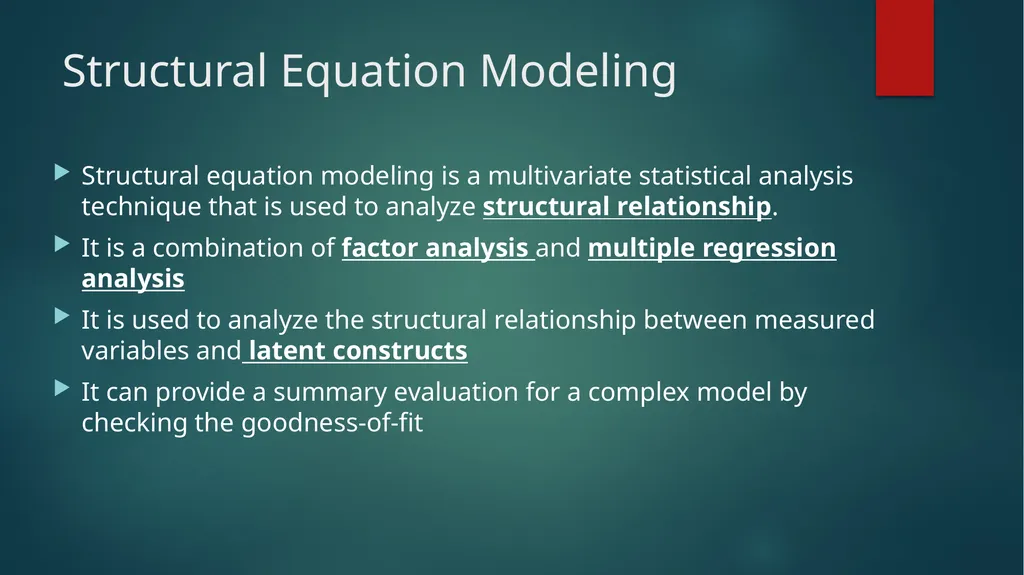
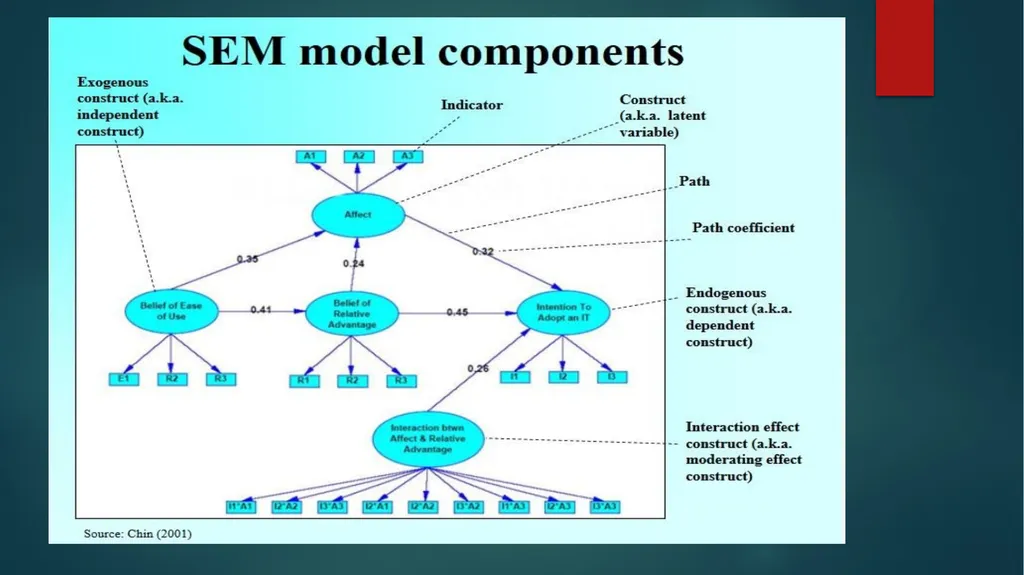
Structural Equation Modeling Structural equation modeling is a multivariate statistical analysis technique that is used to analyze structural relationship.
It is a combination of factor analysis and multiple regression analysis
It is used to analyze the structural relationship between measured variables and latent constructs
It can provide a summary evaluation for a complex model by checking the goodness-of-fit<br>
06
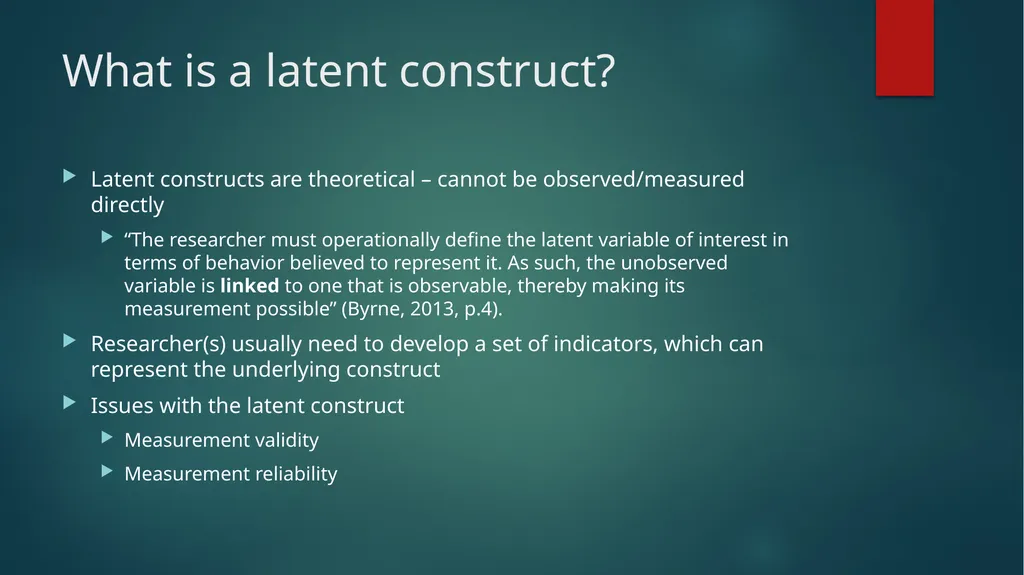
What is a latent construct? Latent constructs are theoretical – cannot be observed/measured directly
“The researcher must operationally define the latent variable of interest in terms of behavior believed to represent it. As such, the unobserved variable is linked to one that is observable, thereby making its measurement possible” (Byrne, 2013, p.4).
Researcher(s) usually need to develop a set of indicators, which can represent the underlying construct
Issues with the latent construct
Measurement validity
Measurement reliability<br>
07
What is your research question? What major are you in?
Are there going to be any latent constructs in your research questions?
How are you planning to measure all the variables related to your research questions?
What is the level of measurements of your variables?<br>
08
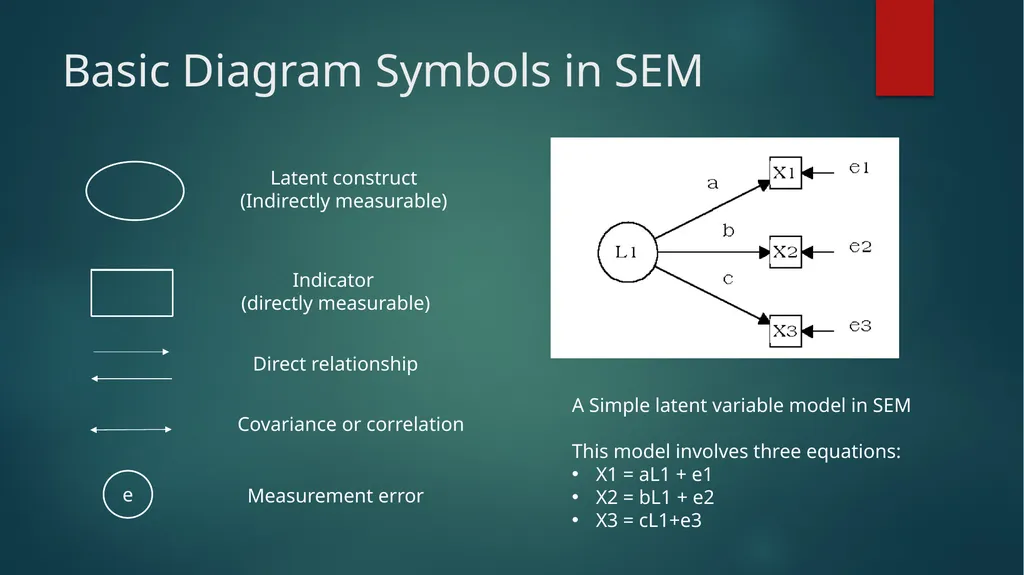
Basic Diagram Symbols in SEM Latent construct
(Indirectly measurable) Direct relationship Covariance or correlation e Measurement error A Simple latent variable model in SEM
This model involves three equations:
X1 = aL1 + e1
X2 = bL1 + e2
X3 = cL1+e3 Indicator
(directly measurable)<br>
09
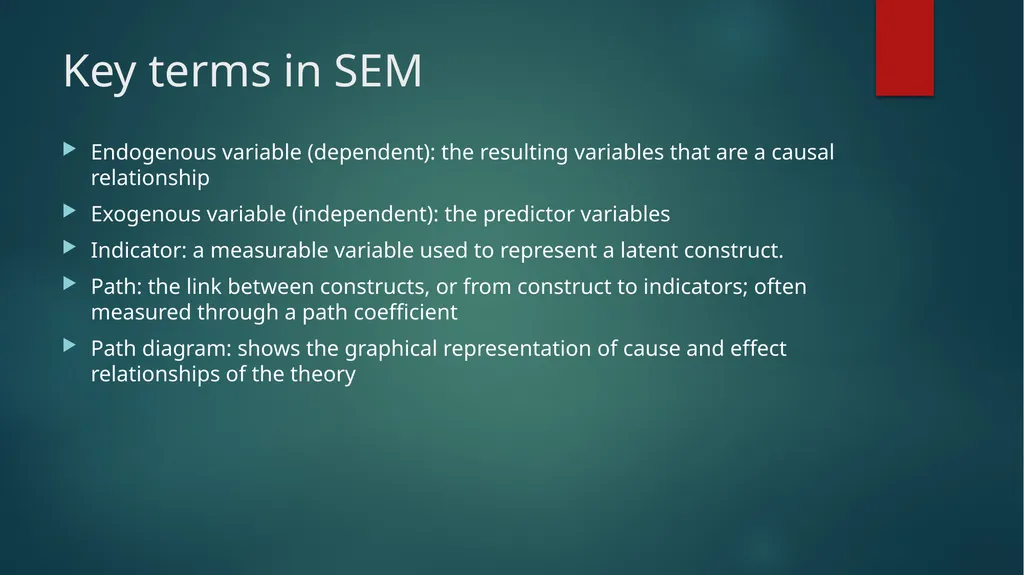
Key terms in SEM Endogenous variable (dependent): the resulting variables that are a causal relationship
Exogenous variable (independent): the predictor variables
Indicator: a measurable variable used to represent a latent construct.
Path: the link between constructs, or from construct to indicators; often measured through a path coefficient
Path diagram: shows the graphical representation of cause and effect relationships of the theory<br>
10
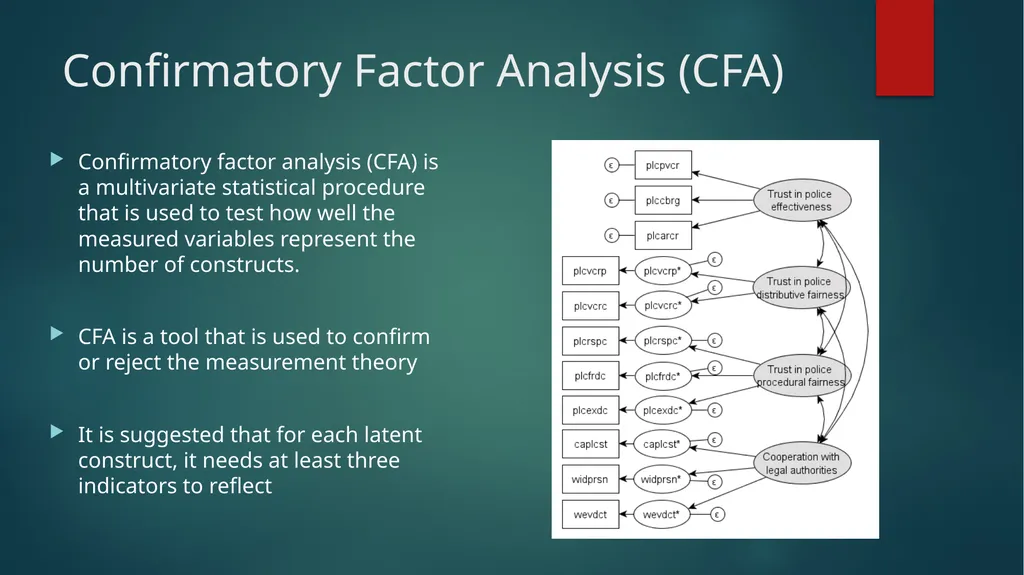
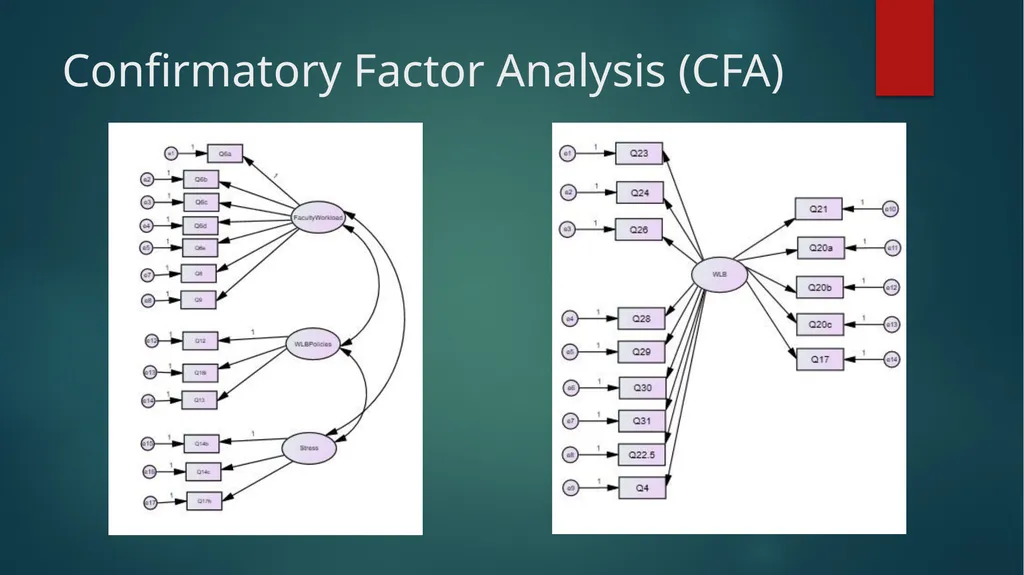
Confirmatory Factor Analysis (CFA) Confirmatory factor analysis (CFA) is a multivariate statistical procedure that is used to test how well the measured variables represent the number of constructs.
CFA is a tool that is used to confirm or reject the measurement theory
It is suggested that for each latent construct, it needs at least three indicators to reflect<br>
11
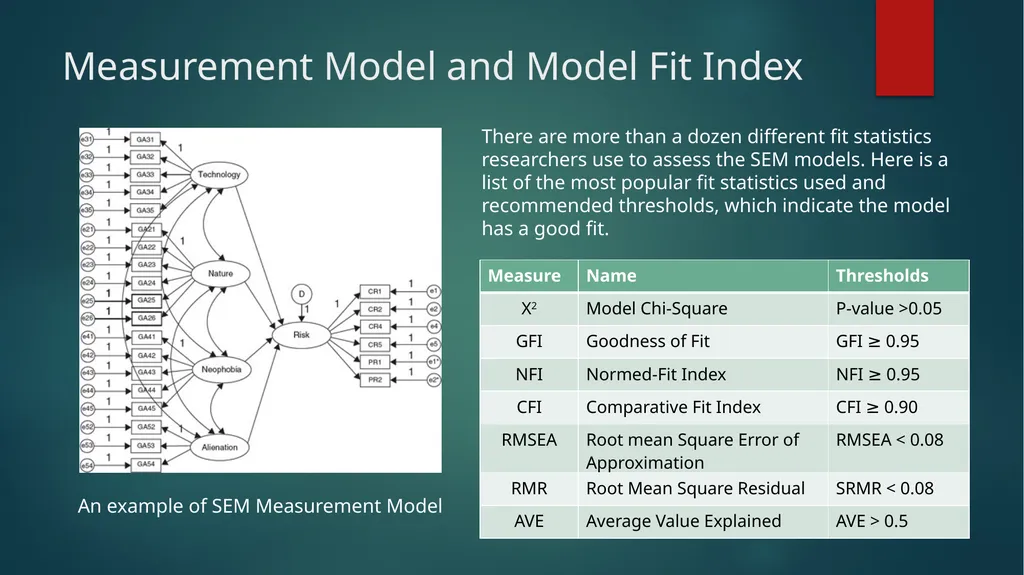
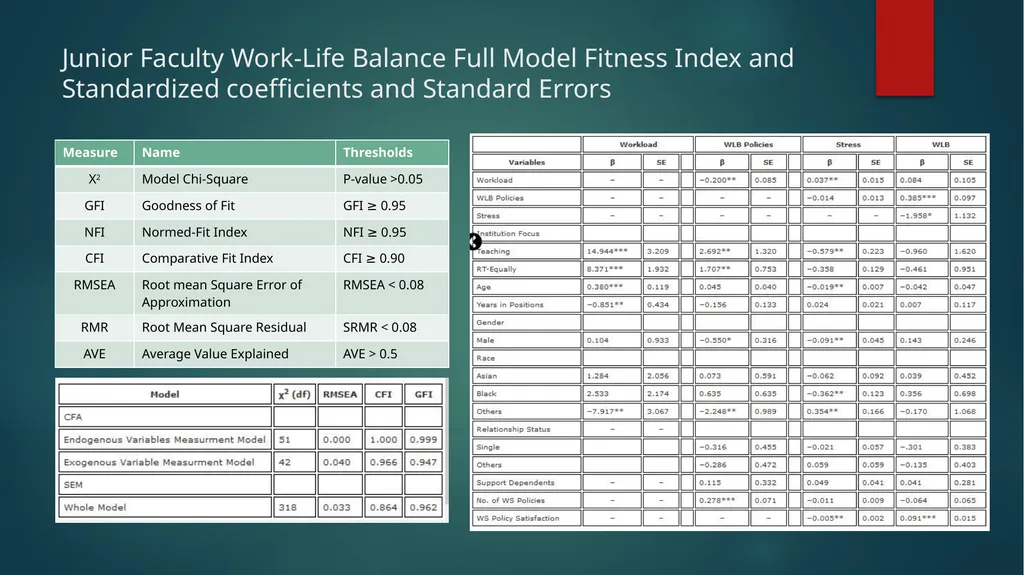
Measurement Model and Model Fit Index An example of SEM Measurement Model There are more than a dozen different fit statistics researchers use to assess the SEM models. Here is a list of the most popular fit statistics used and recommended thresholds, which indicate the model has a good fit.<br>
12
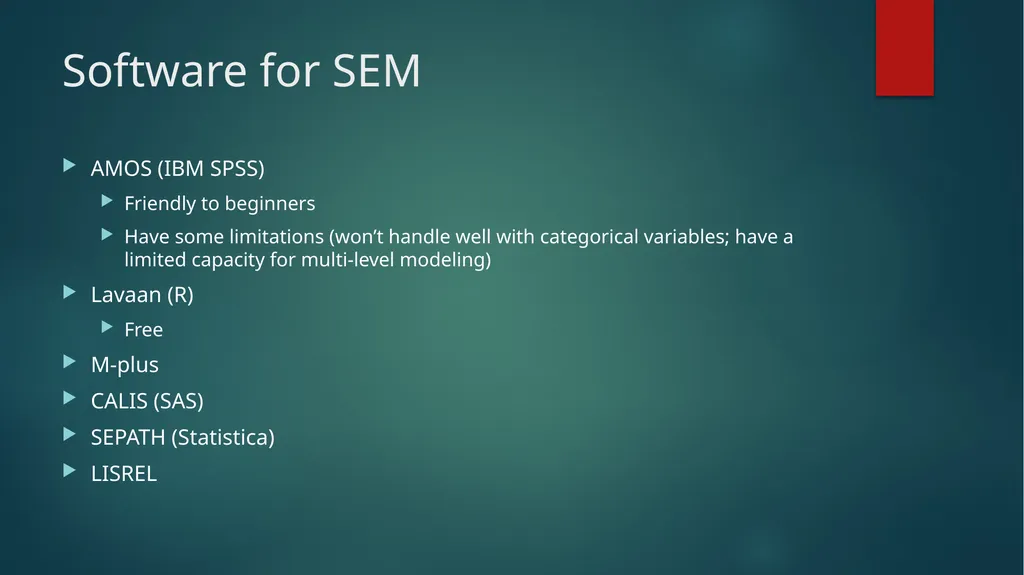
Software for SEM AMOS (IBM SPSS)
Friendly to beginners
Have some limitations (won’t handle well with categorical variables; have a limited capacity for multi-level modeling)
Lavaan (R)
Free
M-plus
CALIS (SAS)
SEPATH (Statistica)
LISREL<br>
13
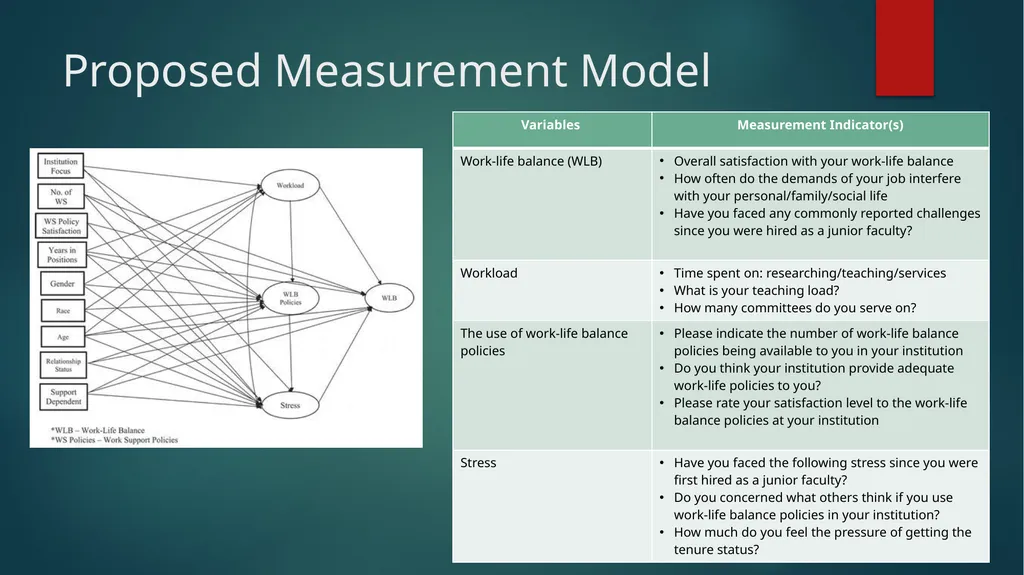
Example 1 Junior Faculty’s Work-Life Balance Research questions:
How do junior faculty in public affairs programs manage their work-life balance?
Do universities have adequate work-life balance policies in place for junior faculty?
How do workload, stress, existence of supportive policies, and individual and institutional factors relate to faculty perceptions of work-life balance?
Within academia, work-life balance incorporates the breakdown between different aspects of the workload, including teaching, research, services, and administrative responsibilities, as each of these roles contributes to the overall time spent on work (Curnalia & Mermer, 2018).
Organizations have developed a number of initiatives to address work-life balance, including formal and informal policies (Beauregard & Henry, 2009.<br>
14
Proposed Measurement Model<br>
15
Confirmatory Factor Analysis (CFA)<br>
16
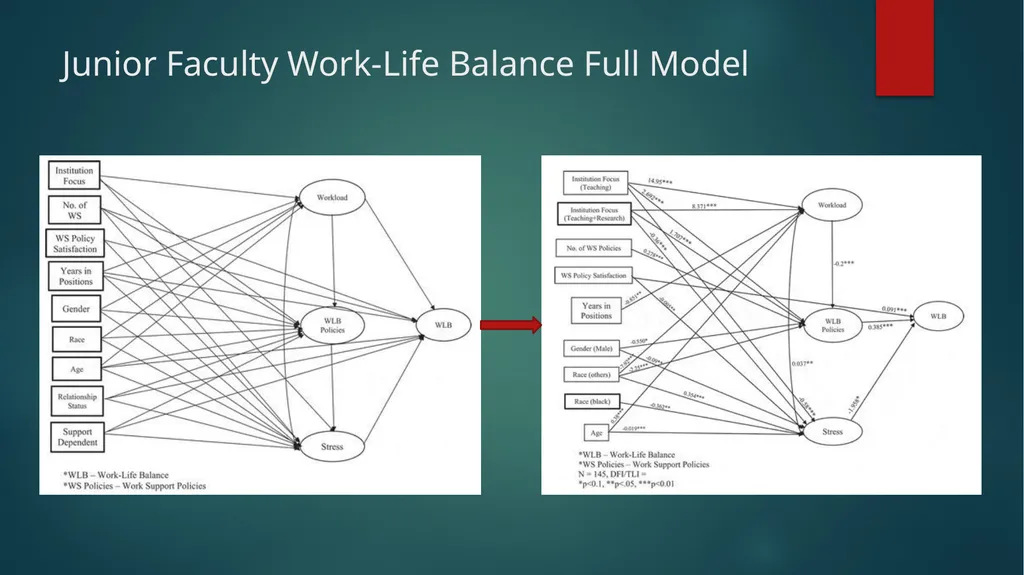
Junior Faculty Work-Life Balance Full Model<br>
17
Junior Faculty Work-Life Balance Full Model Fitness Index and Standardized coefficients and Standard Errors<br>
18
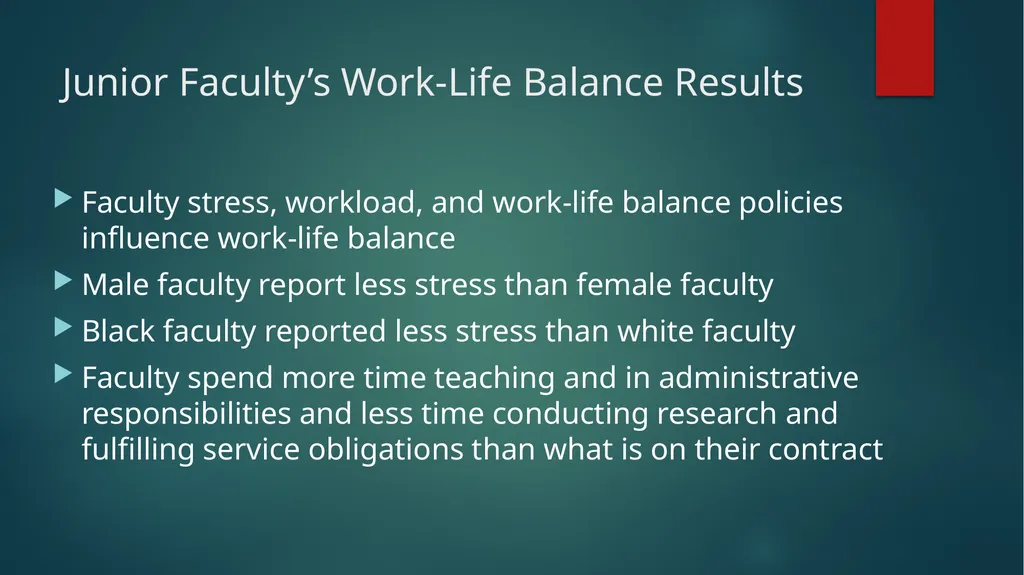
Junior Faculty’s Work-Life Balance Results Faculty stress, workload, and work-life balance policies influence work-life balance
Male faculty report less stress than female faculty
Black faculty reported less stress than white faculty
Faculty spend more time teaching and in administrative responsibilities and less time conducting research and fulfilling service obligations than what is on their contract<br>
19
Thank you! Questions?
Feedback – on Google Form
Contact Information: wanzhu.shi@tamiu.edu<br>
20
Reference Azevedo, L., Shi, W., Medina, P. S., & Bagwell, M. T. (2020). Examining junior faculty work-life balance in public affairs programs in the United States, Journal of Public Affairs Education, DOI: 10.1080/15236803.2020.1788372
Byrne, B. M. (2013). Structural equation modeling with LISREL, PRELIS, and SIMPLIS: Basic concepts, applications, and programming. Psychology Press.
Gefen, D., Straub, D. W., & Boudreau, M-C. (2000). Structural equation modeling and regression: Guidelines for research practice. Communications of the AIS, 4(7), 1-76.
Statistics Solutions. (2013). Confirmatory Factor Analysis [WWW Document]. Retrieved from http://www.statisticssolutions.com/academic-solutions/resources/directory-of-statistical-analyses/confirmatory-factor-analysis/
Tomarken, A. J., & Waller, N. G. (2005). Structural equation modeling: Strengths, limitations, and misconceptions. Annu. Rev. Clin. Psychol., 1, 31-65.<br>