The Global Energy picture: nonrenewables A Nonrenewable Energy Source Will not be replenished naturally A finite amount existsonce its gone there is no more Fossil fuels petroleum, coal, natural gas Radioactive ore Global Electricity
"The Global Energy picture: nonrenewables A" is the property of its rightful owner. Permission is granted to
download and print the materials on this website for personal, non-commercial use only, and to display it
on your personal computer provided you do not modify the materials and that you retain all copyright
notices contained in the materials. By downloading content from our website, you accept the terms of this
agreement.
Presentation Transcript
01
The Global Energy picture: nonrenewables<br>
02
A Nonrenewable Energy Source… Will not be replenished naturally
A finite amount exists—once it’s gone there is no more
Fossil fuels [petroleum, coal, natural gas]
Radioactive ore<br>
03
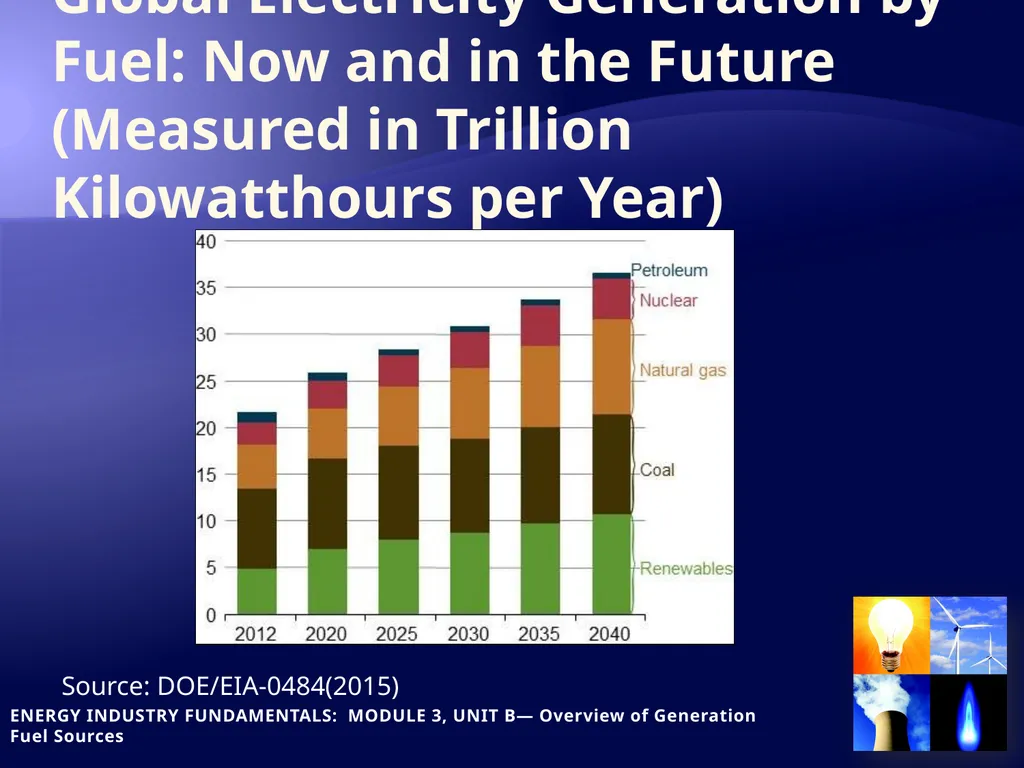
Global Electricity Generation by Fuel: Now and in the Future (Measured in Trillion Kilowatthours per Year) Source: DOE/EIA-0484(2015)<br>
04
Trends 2007 - 2035 If fossil fuel use continues to increase at the current rate, in 2035 they will provide nearly 80% of the world’s energy
Petroleum will remain the world’s single largest energy source even as its share of total energy use declines
The use of renewable energy sources will outpace the growth of petroleum use—growing 111% over the 28-year forecast period International Energy Outlook, 2010, U.S. Energy Information Administration<br>
05
Trends 2007 – 2035: Natural Gas Natural gas consumption is expected to increase 44% globally
Developing Asian countries account for 35% of the increase in natural gas consumption
The Middle East accounts for 32% of the increase in natural gas production International Energy Outlook, 2010, U.S. Energy Information Administration<br>
06
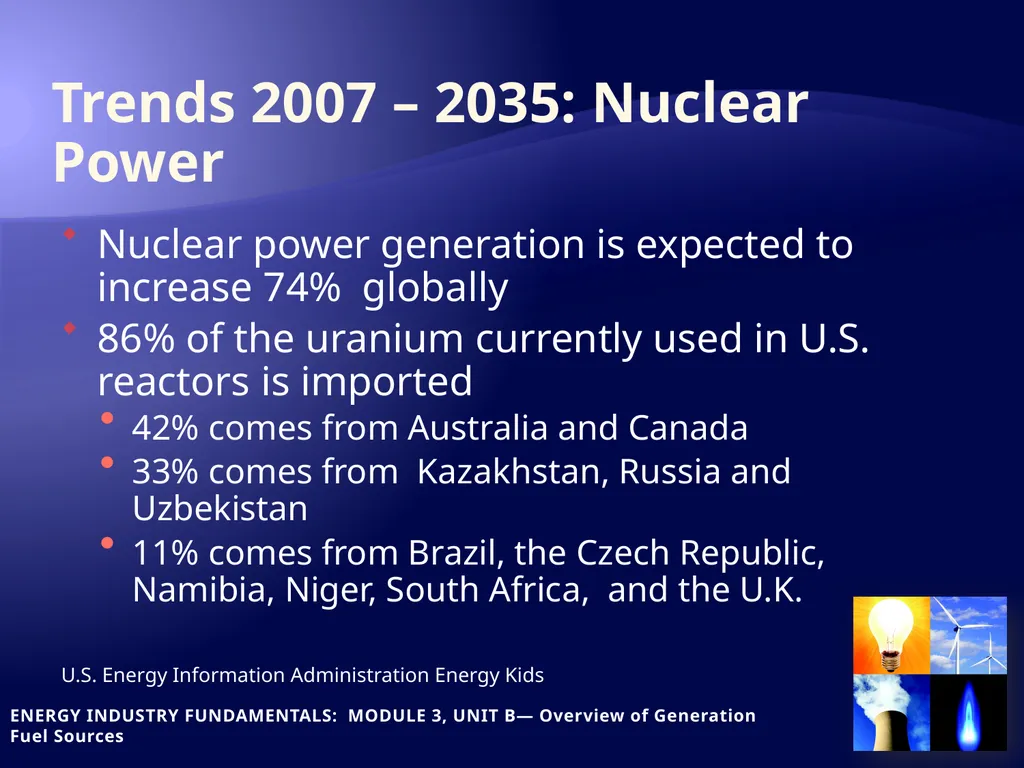
Trends 2007 – 2035: Nuclear Power Nuclear power generation is expected to increase 74% globally
86% of the uranium currently used in U.S. reactors is imported
42% comes from Australia and Canada
33% comes from Kazakhstan, Russia and Uzbekistan
11% comes from Brazil, the Czech Republic, Namibia, Niger, South Africa, and the U.K. U.S. Energy Information Administration Energy Kids<br>
07
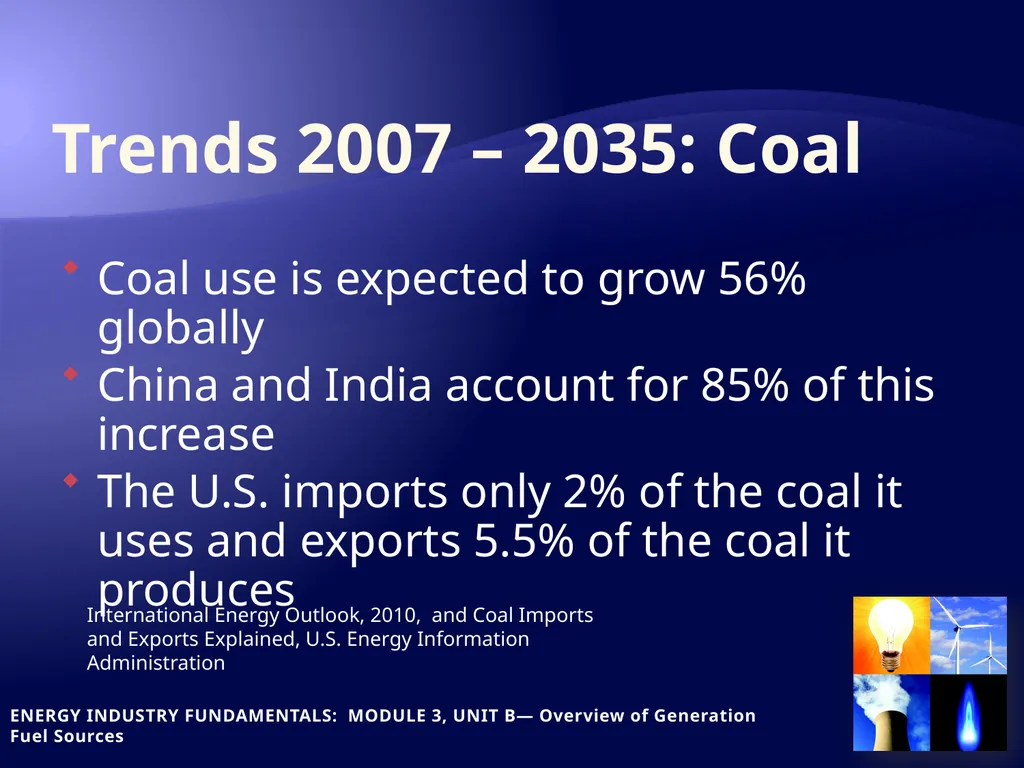
Trends 2007 – 2035: Coal Coal use is expected to grow 56% globally
China and India account for 85% of this increase
The U.S. imports only 2% of the coal it uses and exports 5.5% of the coal it produces International Energy Outlook, 2010, and Coal Imports and Exports Explained, U.S. Energy Information Administration<br>
08
Petroleum Production & Use The next 4 slides provide statistics about oil production, consumption, importing and exporting in today’s market
Notice where the U.S. ranks in the charts
Compare U.S. numbers to those of other countries
All figures from the U.S. Energy Information Agency<br>
09
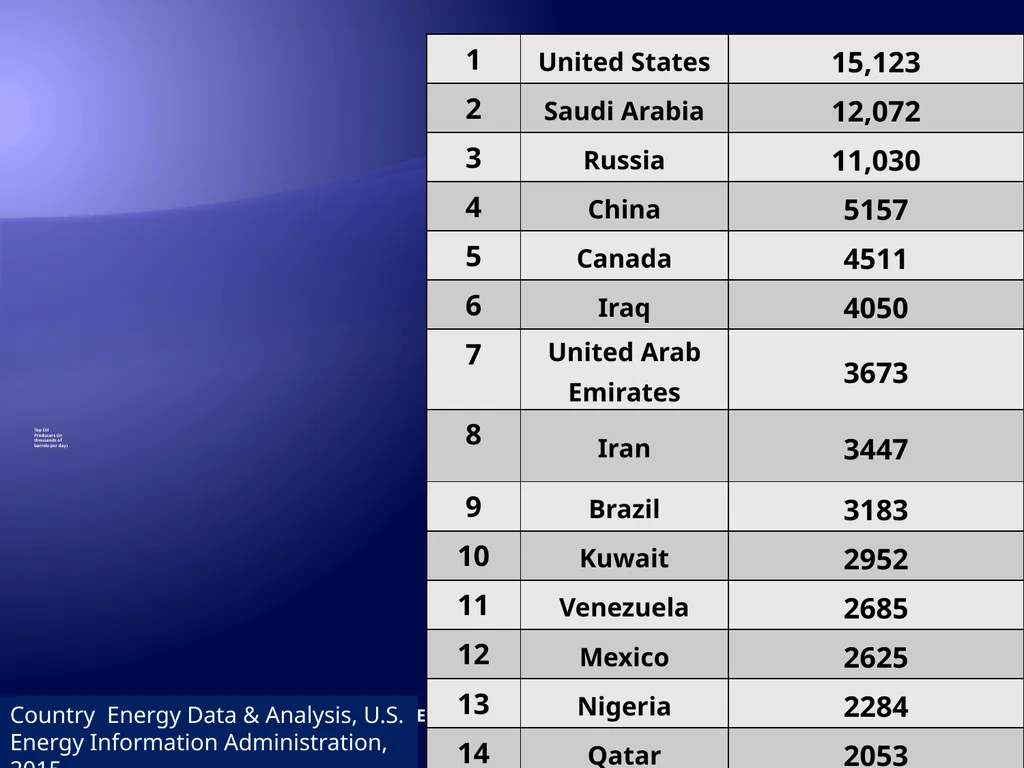
Top Oil Producers (in thousands of barrels per day) Country Energy Data & Analysis, U.S. Energy Information Administration, 2015<br>
10
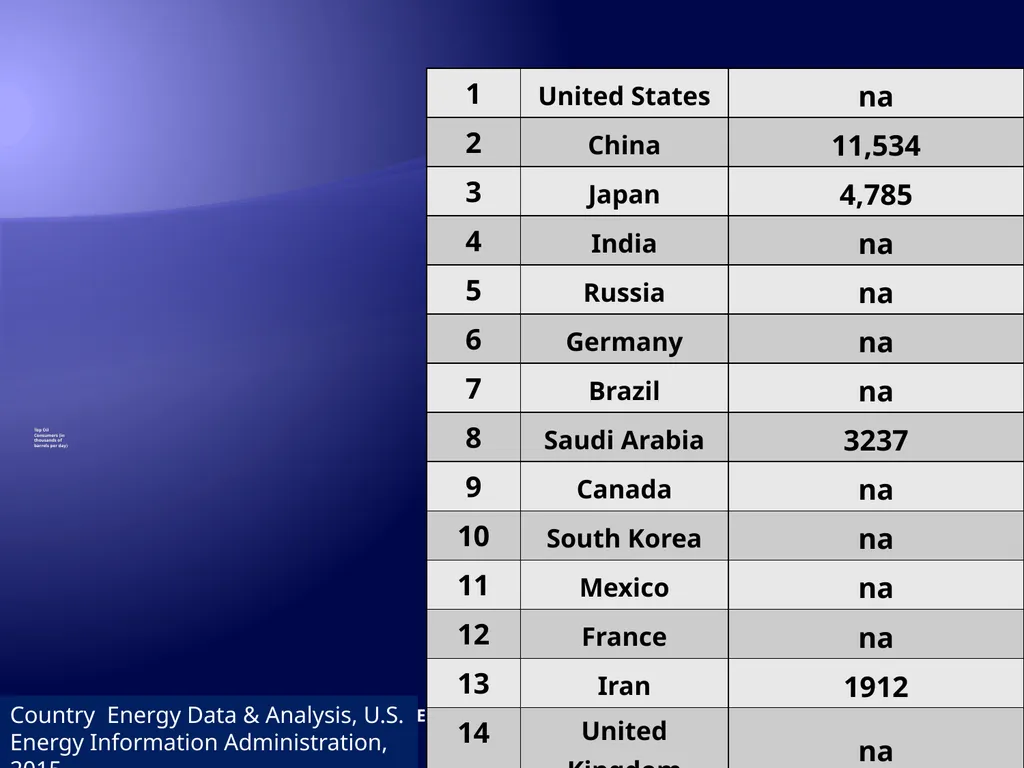
Top Oil Consumers (in thousands of barrels per day) Country Energy Data & Analysis, U.S. Energy Information Administration, 2015<br>
11
Top Oil Importers (in thousands of barrels per day) Country Energy Data & Analysis, U.S. Energy Information Administration, 2015<br>
12
Top Oil Exporters (in thousands of barrels per day) Country Energy Data & Analysis, U.S. Energy Information Administration, 2015<br>
13
What Do These Numbers Mean… …economically?
…politically?
…environmentally?<br>
14
What Else Do You Need to Know? Are there undiscovered/untapped resources?
How much is left?
How long will this resource last?<br>
15
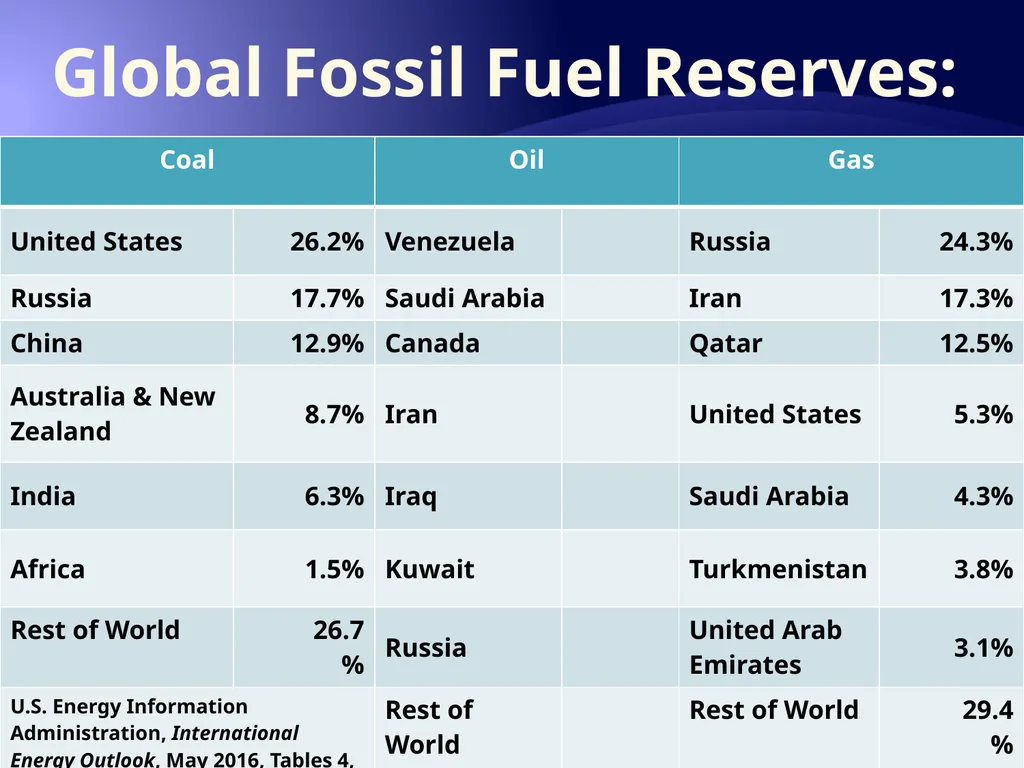
Fossil Fuel Reserves Reserves are the estimated amount of resources that still lie beneath the ground
Estimates are based on the geology of the area and engineering data<br>
16
Global Fossil Fuel Reserves:<br>
17
What Do These Numbers Mean… …economically?
…politically?
…environmentally?<br>
18
For More Information U.S. Energy Information Administration home page www.eia.gov
Short-Term Energy Outlook www.eia.gov/emeu/steo/pub/contents.html
Annual Energy Outlook www.eia.gov/oiaf/aeo/index.html
International Energy Outlook www.eia.gov/oiaf/ieo/index.html
Monthly Energy Review www.eia.gov/emeu/mer/contents.html
National Energy Information Center (202) 586-8800 Live expert from 9:00 AM – 5:00 p.m. EST Email: InfoCtr@eia.doe.gov<br>