The MOT and Venture Business Prof. Takao Ito,

Published  . 0 views
↓ Download
The MOT and Venture Business Prof. Takao Ito,
1 / 1
The MOT and Venture Business Prof. Takao Ito, - slide 1 of 63 The MOT and Venture Business Prof. Takao Ito, - slide 2 of 63 The MOT and Venture Business Prof. Takao Ito, - slide 3 of 63 The MOT and Venture Business Prof. Takao Ito, - slide 4 of 63 The MOT and Venture Business Prof. Takao Ito, - slide 5 of 63 The MOT and Venture Business Prof. Takao Ito, - slide 6 of 63 The MOT and Venture Business Prof. Takao Ito, - slide 7 of 63 The MOT and Venture Business Prof. Takao Ito, - slide 8 of 63 The MOT and Venture Business Prof. Takao Ito, - slide 9 of 63 The MOT and Venture Business Prof. Takao Ito, - slide 10 of 63 The MOT and Venture Business Prof. Takao Ito, - slide 11 of 63 The MOT and Venture Business Prof. Takao Ito, - slide 12 of 63 The MOT and Venture Business Prof. Takao Ito, - slide 13 of 63 The MOT and Venture Business Prof. Takao Ito, - slide 14 of 63 The MOT and Venture Business Prof. Takao Ito, - slide 15 of 63 The MOT and Venture Business Prof. Takao Ito, - slide 16 of 63 The MOT and Venture Business Prof. Takao Ito, - slide 17 of 63 The MOT and Venture Business Prof. Takao Ito, - slide 18 of 63 The MOT and Venture Business Prof. Takao Ito, - slide 19 of 63 The MOT and Venture Business Prof. Takao Ito, - slide 20 of 63 The MOT and Venture Business Prof. Takao Ito, - slide 21 of 63 The MOT and Venture Business Prof. Takao Ito, - slide 22 of 63 The MOT and Venture Business Prof. Takao Ito, - slide 23 of 63 The MOT and Venture Business Prof. Takao Ito, - slide 24 of 63 The MOT and Venture Business Prof. Takao Ito, - slide 25 of 63 The MOT and Venture Business Prof. Takao Ito, - slide 26 of 63 The MOT and Venture Business Prof. Takao Ito, - slide 27 of 63 The MOT and Venture Business Prof. Takao Ito, - slide 28 of 63 The MOT and Venture Business Prof. Takao Ito, - slide 29 of 63 The MOT and Venture Business Prof. Takao Ito, - slide 30 of 63 The MOT and Venture Business Prof. Takao Ito, - slide 31 of 63 The MOT and Venture Business Prof. Takao Ito, - slide 32 of 63 The MOT and Venture Business Prof. Takao Ito, - slide 33 of 63 The MOT and Venture Business Prof. Takao Ito, - slide 34 of 63 The MOT and Venture Business Prof. Takao Ito, - slide 35 of 63 The MOT and Venture Business Prof. Takao Ito, - slide 36 of 63 The MOT and Venture Business Prof. Takao Ito, - slide 37 of 63 The MOT and Venture Business Prof. Takao Ito, - slide 38 of 63 The MOT and Venture Business Prof. Takao Ito, - slide 39 of 63 The MOT and Venture Business Prof. Takao Ito, - slide 40 of 63 The MOT and Venture Business Prof. Takao Ito, - slide 41 of 63 The MOT and Venture Business Prof. Takao Ito, - slide 42 of 63 The MOT and Venture Business Prof. Takao Ito, - slide 43 of 63 The MOT and Venture Business Prof. Takao Ito, - slide 44 of 63 The MOT and Venture Business Prof. Takao Ito, - slide 45 of 63 The MOT and Venture Business Prof. Takao Ito, - slide 46 of 63 The MOT and Venture Business Prof. Takao Ito, - slide 47 of 63 The MOT and Venture Business Prof. Takao Ito, - slide 48 of 63 The MOT and Venture Business Prof. Takao Ito, - slide 49 of 63 The MOT and Venture Business Prof. Takao Ito, - slide 50 of 63 The MOT and Venture Business Prof. Takao Ito, - slide 51 of 63 The MOT and Venture Business Prof. Takao Ito, - slide 52 of 63 The MOT and Venture Business Prof. Takao Ito, - slide 53 of 63 The MOT and Venture Business Prof. Takao Ito, - slide 54 of 63 The MOT and Venture Business Prof. Takao Ito, - slide 55 of 63 The MOT and Venture Business Prof. Takao Ito, - slide 56 of 63 The MOT and Venture Business Prof. Takao Ito, - slide 57 of 63 The MOT and Venture Business Prof. Takao Ito, - slide 58 of 63 The MOT and Venture Business Prof. Takao Ito, - slide 59 of 63 The MOT and Venture Business Prof. Takao Ito, - slide 60 of 63 The MOT and Venture Business Prof. Takao Ito, - slide 61 of 63 The MOT and Venture Business Prof. Takao Ito, - slide 62 of 63 The MOT and Venture Business Prof. Takao Ito, - slide 63 of 63
Description: The MOT and Venture Business Prof. Takao Ito, Doctor of Economics, PH.D. of Engineering, Graduate School of Advanced Science and Engineering, Hiroshima University E-Mail: itotakaoHiroshima-u.ac.jp 1 5 Guiding Principles The Pursuit of

Related Topics

Download Presentation

"The MOT and Venture Business Prof. Takao Ito," is the property of its rightful owner. Permission is granted to download and print the materials on this website for personal, non-commercial use only, and to display it on your personal computer provided you do not modify the materials and that you retain all copyright notices contained in the materials. By downloading content from our website, you accept the terms of this agreement.

Presentation Transcript

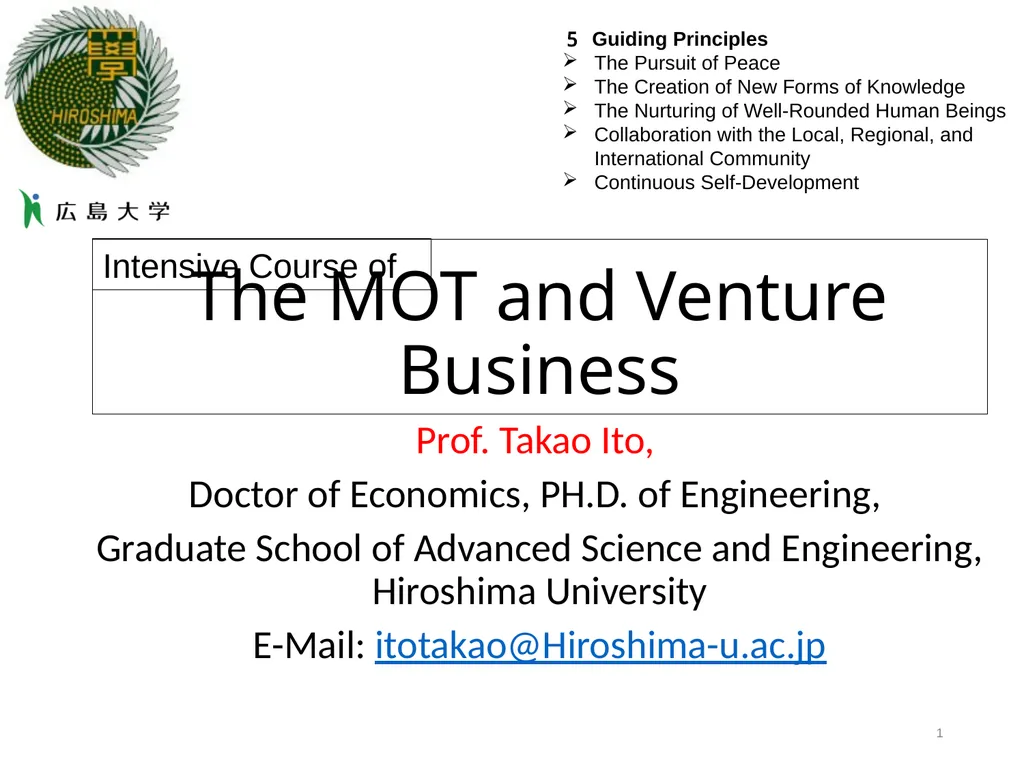
slide1. The MOT and Venture Business Prof. Takao Ito,
Doctor of Economics, PH.D. of Engineering,
Graduate School of Advanced Science and Engineering, Hiroshima University
E-Mail: itotakao@Hiroshima-u.ac.jp 1 5 Guiding Principles
The Pursuit of Peace
The Creation of New Forms of Knowledge
The Nurturing of Well-Rounded Human Beings
Collaboration with the Local, Regional, and International Community
Continuous Self-Development Intensive Course of<br>
slide2. Schedule 2<br>
slide3. The P&L statement The profit and loss (P&L) statement, also referred to as the income statement, is one of three financial statements companies regularly produce
The P&L statement is usually a very straightforward presentation of a company's revenues, costs, and net profit for the time period covered by the statement. 3<br>
slide4. Example of a P&L Statement Total Revenue $1,000,000
Less Cost of Goods Sold $378,700
Gross Profit $621,300 (62.13% Gross Profit Margin)
Less Expenses
Accounting/Legal Fees $15,500
Advertising/Marketing $27,000
Depreciation $14,000
Utility Bills $4,200
Insurance $20,200
Interest/Finance Fees $16,800
Rent for Offices $78,700
Repairs/Maintenance $15,400
Wages/Salaries/Benefits $201,500
Other Expenses $8,200
Total Expenses $401,500
Net Profit $219,800 (21.98% Net Profit Margin) 4<br>
slide5. The balance sheet The balance sheet is one of the three fundamental financial statements and is key to both financial modeling and accounting.
The balance sheet displays the company’s total assets, and how these assets are financed, through either debt or equity. It can also sometimes be referred to as a statement of net worth, or a statement of financial position.
The balance sheet is based on the fundamental equation: Assets = Liabilities + Equity 5<br>
slide6. an example of Amazon’s 2016 balance sheet. 6<br>
slide7. an example of Amazon’s 2016 balance sheet. 7<br>
slide8. A Statement of Cash Flows A Statement of Cash Flows (or Cash Flow Statement) shows the movement in the Cash account of a company.
It presents cash inflows (receipts) and outflows (payments) in the three activities of business: operating, investing, and financing. 8<br>
slide9. a sample cash flow statement 9<br>
slide10. Statement of Cash Flows presents the inflows and outflows of cash in the different activities of the business, the net increase or decrease in cash, and the resulting cash balance at the end of the period. Cash inflows refer to receipts of cash while cash outflows to payments or disbursements.
A typical cash flow statement starts with a heading which consists of three lines. The first line presents the name of the company; the second describes the title of the report; and the third states the period covered in the report.
Notice that the third line is worded "For the Year Ended..." This means that the information included in the report covers a span of time. In the illustration above, the report presents inflows and outflows of cash for 1 year, i.e. from January 1 to December 31, 2017.
Cash inflows and outflows are classified in three activities: operating, investing, and financing.
Operating activities refer to the main operations of the company such as rendering of professional services, acquisition of inventories and supplies, selling of inventories for merchandising and manufacturing concerns, collection of accounts, payment of accounts to suppliers, and others. Generally, operating activities refer to those that involve current assets and current liabilities.
Investing activities may be summed up as: "where the company puts its money for long-term purposes", such as acquisition of property, plant and equipment; and investment in long-term securities. Selling these properties are also considered investing activities. In general, investing activities include transactions that involve non-current assets.
Financing activities refer to: "where the company gets its funds", such as investment of the owner/s, and cash proceeds from bank loan and other long-term payables. The payment of such items (i.e. withdrawal of owner/s and payment of loans) are also financing activities. Generally, financing activities include those that affect non-current liabilities and capital.
All inflows are presented in positive figures while all outflows in negative (in parentheses).
After inflows and outflows are presented, the net increase or decrease in cash is computed. Then it is added to the beginning balance of cash to get the balance at the end. Easy, right? In simple sense, this report presents the cash balance at the beginning of the period, the changes during the period, and the resulting balance at the end of the period.
Notice that the cash balance at the end, $ 21,000, is the same as the cash balance presented in the company's Balance Sheet.
Good accounting form suggests that a single line is drawn every time an amount is computed. It signifies that a mathematical operation has been completed. The computed balance at the end of the report is double-ruled. 10<br>
slide11. Topic 4 Break-Even Point Analysis 11<br>
slide12. Agenda Costs
Break-Even Point Analysis
Case Studies
Economies of scale 12<br>
slide13. 1.Costs Fixed cost
In management accounting, fixed costs are defined as expenses that do not change in proportion to the activity of a business, within the relevant period or scale of production.
For example, a retailer must pay rent and utility bills irrespective of sales. 13<br>
slide14. Variable cost Variable costs are expenses that change in proportion to the activity of a business.
Variable costs are sometimes called unit-level costs as they vary with the number of units produced. 14<br>
slide15. Total cost Total cost (TC) describes the total economic cost of production and is made up of variable costs, which vary according to the quantity of a good produced and include inputs such as labor and raw materials, plus fixed costs, which are independent of the quantity of a good produced and include inputs (capital) that cannot be varied in the short term, such as buildings and machinery. 15<br>
slide16. Examples of costs
Advertising expenses
Research and development expenditure
Social expenses
Depreciation expense
Real estate tax
Fire insurance fee
Materials cost
Wages
Packing charge
Delivery fee 16<br>
slide17. 1)Fixed cost:
Managed capacity cost: 2)Variable cost: Social Expenses; Advertising Expenses; R & D Expenditure; Wages 17 Committed capacity cost: Depreciation expense; Real estate tax; Fire insurance fee Materials cost; Packing charge; Delivery fee<br>
slide18. Price will be determined by quantity.
Break-even point: Break-even (or break even) is the point of balance between making either a profit or a loss.
Break-even Point Analysis 18 2.Break-Even Point Analysis Cost-Benefit Analysis
Cost- Volume- Profit Analysis<br>
slide19. TR(Total Revenue) 19<br>
slide20. v: variable cost per unit
f: fixed cost
TC(Total Cost) 20<br>
slide21. Profit (Yield) Break-even Point : AmountsBE 21<br>
slide22. Break-even Point: Quantity
xBE p-v: marginal profit per unit, Per Unit Contribution to Fixed Costs 22<br>
slide23. Sales Revenue and Marginal Profit 23 Marginal Profit=Sales Revenue -Variable cost Sales Revenue Variable cost Margin, Marginal Profit<br>
slide24. Sales Revenue and Marginal Profit 24 Marginal Profit=Sales Revenue -Variable cost Sales Revenue Variable cost Margin, Marginal Profit<br>
slide25. Profit Sales revenue
- Cost of sales
Gross profit
- Selling, General and Administrative expenses
Operating Profit
+ Non-operating income
- Non-operating loss
Ordinary profit
+ Extraordinary Gain
- Extraordinary Loss
Current net income before tax
- Corporate tax
Net profit 25<br>
slide26. Break-even Point: Sales
SBE v/p:variable cost ratio
1-(v/p): marginal profit ratio 26<br>
slide27. 3.Case Studies 27 Case 1: Unit Price=$100, Average variable cost per unit= $60, Total fixed costs=$120,000<br>
slide28. 28 Unit Price=$100, Average variable cost per unit= $60, Total fixed costs=$120,000<br>
slide29. Case 2 Fixed cost:100,000(rental fee)
Variable cost:15Yen
sales:175,000Yen

Question:price at Break-even point 29<br>
slide30. Total cost Unit Price (Break-even point) 30<br>
slide31. Variable cost Total cost Amount Quantity Revenue: Sales Fixed cost 15 Yen 35 Yen 31<br>
slide32. Question Purpose: to get the profit of 10,000 Yen.
Calculate the unit price.(only for the case of 5,000 pcs)
2) Calculate the unit price if the quantity of your neighbor company is 3,000 pcs. 32<br>
slide33. Answer 1 33<br>
slide34. Answer 2 34<br>
slide35. Case 3 Materials: 2,465,783Yen
Wages: 4,356,892Yen
Advertisement: 765,318Yen
Rental: 1,254,876Yen
Insurance: 432,865Yen
Packing charge: 647,816Yen
Delivery fee: 346,825Yen
Commission fee: 486,593Yen 35 A hamburger shop<br>
slide36. Light and fuel: 347,581Yen
Depreciation: 648,000Yen
General & Administrative expense: 1,864,752Yen
Quantity: 70,000pcs
Unit price:210Yen
Profit per unit and total profit
The solution for obtain 1,000 (in Thousand) 36<br>
slide37. Identifying the costs Materials→
Wages→
Advertisement→
Rental→
Insurance→ Variable cost Fixed cost Fixed cost Fixed cost Fixed cost 37<br>
slide38. Identifying the costs Packing charge→
Delivery fee→
Commission fee→
Light and fuel→
Depreciation→
General & Administrative expense→ Variable cost Variable cost Variable cost Fixed cost Fixed cost 38<br>
slide39. Category of the costs Fixed cost 39 Wages: 4,356,892
Advertisement: 765,318
Rental: 1,254,876
Insurance: 432,865
Depreciation: 648,000
General & Administrative expense: 1,864,752<br>
slide40. Category of the costs 40<br>
slide41. Variable cost 41 Cost of goods sold: 2,465,783
Packing charges: 647,816
Transportation fee: 346,825
Commission fee: 486,593
Expenses for light and fuel: 347,581<br>
slide42. Variable cost 42<br>
slide43. Profit and Profit Per Unit 43<br>
slide44. Profit and Profit Per Unit Profit=Revenue-Expense
=Number of sales*Unit price-
(Fixed cost + Variable cost)
=70,000*210-
(9,322,703+4,294,598)
=1,082,699
Profit per unit
=Profit/Number of sales
=1,082,699/70,000
=15(Yen/Unit) 44<br>
slide45. The solutions to obtain 10 Millions 1) Price increasing
Let Price=x 337/210=1.605! 45 Then x=337(Yen)<br>
slide46. The solutions to obtain 10 Millions 1) Price increasing
Let Price=x
Profit=Revenue-Expense
=Number of sales*Unit price-
(Fixed cost + Variable cost)
=70,000*x-
(9,322,703+4,294,598)
=10,000,000
Then x=337(Yen) 337/210=1.605! 46<br>
slide47. The solutions to obtain 10 Millions 2)Quantity increasing
Quantity=x 129682/70000=1.853! 47 Then x=129,682 (Unit)<br>
slide48. The solutions to obtain 10 Millions 2)Quantity increasing
Number of sales=x
Profit=Revenue-Expense
=Number of sales*Unit price-
(Fixed cost + Variable cost)
=x*210-(9,322,703+61*x)
=10,000,000
Then x=129,682 (pcs) 129682/70000=1.853! 48<br>
slide49. The solutions to obtain 10 Millions 3) Number of sales increasing and price decreasing (less than half price)
Let Unit price=100 and Numbers of sales=x 49 Then x=495,454(Unit)<br>
slide50. The solutions to obtain 10 Millions 3) Number of sales increasing and price decreasing (less than half price)
Let Unit price=100 and Numbers of sales=x
Profit=Revenue-Expense
=Number of sales*Unit price-
(Fixed cost + Variable cost)
=x*100-(9,322,703+61*x)
=10,000,000
Then x=495,454(pcs) 50<br>
slide51. Unit profit calculation 0) Price=210: 15 Yen/Unit 51<br>
slide52. Unit profit calculation 0) Price=210: 15Yen Unit Profit
   =Profit/Quantity
=1,082,699/70,000
=15.467≒15(Yen/pc) 52<br>
slide53. Unit profit calculation 1)Price=337: 142 Yen/Unit 53<br>
slide54. Unit profit calculation 1)Price=337: 142Yen/pc Profit=Revenue-Cost(expenditure)
=Quantity*Price-(Fixed cost + Variable cost)
=70,000*337-(9,322,703+4,294,598)
=9,972,699(Yen)
Unit Profit=Profit/Quantity
=9,972,699/70,000=142.47(Yen/pc) 54<br>
slide55. Unit profit calculation 2)Quantity=129,682: 77 Yen/Unit 55<br>
slide56. Unit profit calculation 2)Quantity=129,682: 77Yen/pc Profit=Revenue-Cost(expenditure)
=Quantity*Price-(Fixed cost + Variable cost)
=129,682*210-(9,322,703+61*129,682)
=9,999,915(Yen)
Unit Profit=Profit/Quantity
=9,999,915/129,682=77.11(Yen/pc) 56<br>
slide57. Unit profit calculation 3)Price=100: 20Yen/Unit 57<br>
slide58. Unit profit calculation 3)Price=100: 20Yen/pc Profit=Revenue-Cost(expenditure)
=Quantity*Price-(Fixed cost + Variable cost)
=495,454*100-(9,322,703+61*495,454)
=10,000,003(Yen)
Unit Profit=Profit/Quantity
=10,000,003/495,454=20.18Yen/pc 58<br>
slide59. 3) Price=100: Unit profit calculation 0)Price=210:
1)Price=337:
2) Quantity=129,682: 77Yen/Unit 142Yen/Unit 15Yen/Unit 20Yen/Unit 59<br>
slide60. Reason:
Price=100; Quantity=x 60 Then x=495,454(Unit)<br>
slide61. Reason:
Price=100; Quantity=x
Profit=Revenue-Cost(expenditure)
=Quantity*Price-(Fixed cost + Variable cost)
=x*100-(9,322,703+61*x)
=10,000,000(Yen)
x=495,454(PCS)
Fixed cost per unit=Fixed cost/Quantity
=9,322,703/495,454=18.82(Yen/pc) 61<br>
slide62. Fixed cost per unit 1)Price=210:
2)Price=337:
3) Price=100: 18Yen/Unit 133Yen/Unit 133Yen/Unit Fixed cost per unit is decreasing when the quantity is increasing. 62<br>
slide63. The decrease in unit cost of a product or service resulting from large-scale operations, as in mass production. 63 4.Economies of Scale<br>
slide64. Scale Economies Economies of scale are advantages that arise for a firm because of its larger size, or scale of operation. These advantages translate into lower unit costs (or improved productive/efficiency.<br>
slide65. Internal economies of scale Purchasing – firms producing on a larger scale: to bulk buy raw materials or products for resale in larger quantities.
Technical – cost-effective to invest in more advanced production machinery, IT and software when operating on a larger scale.<br>
slide66. Managerial – larger firms can afford to have specialist managers for different functions within a business – such as Marketing, Finance and Human Resources.
Specialization – with a larger workforce, the firm may be better able to divide up the work and recruit people whose skills very closely match the requirements of the job.<br>
slide67. Marketing – more options are available for larger firms, such as television and other national media, which would not be cost-effective for smaller producers.
Financial – a wider range of finance options available to larger firms, such as the stock market, bonds and other kinds of bank lending.<br>
slide68. Risk bearing – a larger firm can be safer from the risk of failure if it has a more diversified product range.
Social and welfare – larger firms are more likely to be able to justify additional benefits for employees such as pension funds, healthcare, sports and social facilities, which in turn can help attract and retain good employees.<br>
slide69. External economies of scale External economies of scale arise from firms in related industries operating in a concentrated geographical area; suppliers of services and raw materials to all these firms can do so more efficiently.<br>
slide70. Diseconomies of scale Lack of motivation – in larger firms, workers can feel that they are not appreciated or valued as individuals
Poor communication – it can be easier for smaller firms to communicate with all staff in a personal way.<br>
slide71. Coordination – a very large business takes a lot of organizing, leading to an increase in meetings and planning to ensure that all staff know what they are supposed to be doing.
Evaluation – is bigger better than smaller?<br>
slide72. Thank you for your attention! 72<br>