
The Vertical Spread Advantage: Achieve Above
DP
Published · 54 slides · 0 views

1 / 1







Description
The Vertical Spread Advantage: Achieve Above Average Returns, Higher Win Rates with Minimal Cash Jared A Levy Senior Options Specialist, Zacks.com Jaredlevy.com 1. SMB TRAINING is NOT a Broker Dealer. SMB TRAINING engages in trader
Related Topics
Share
Embed code
Download this presentation From Below
"The Vertical Spread Advantage: Achieve Above" is the property of its rightful owner. Permission is granted to download and print the materials on this website for personal, non-commercial use only, and to display it on your personal computer provided you do not modify the materials and that you retain all copyright notices contained in the materials. By downloading content from our website, you accept the terms of this agreement.
Presentation Transcript
01
The Vertical Spread Advantage:
Achieve Above Average Returns, Higher Win Rates with Minimal Cash
Jared A Levy
Senior Options Specialist, Zacks.com
Jaredlevy.com<br>
Achieve Above Average Returns, Higher Win Rates with Minimal Cash
Jared A Levy
Senior Options Specialist, Zacks.com
Jaredlevy.com<br>
02
1. SMB TRAINING is NOT a Broker Dealer. SMB TRAINING engages in trader education and training. SMB TRAINING offers a number of products and services, both electronically (over the internet through Smbtraining.com) and in person. Through Smbtraining.com, SMB TRAINING offers the “Virtual Trading Floor”, a community through which independent traders (subscribers), as well as T3 Trading Group, LLC traders, observe a virtual trading floor environment (as described below) for educational purposes. SMB TRAINING also offers web-based, interactive training courses on demand.
2. The seminars given by SMB TRAINING are for educational purposes only. This information neither is, nor should be construed, as an offer, or a solicitation of an offer, to buy or sell securities. You shall be fully responsible for any investment decisions you make, and such decisions will be based solely on your evaluation of your financial circumstances, investment objectives, risk tolerance, and liquidity needs.
3. This material is being provided to you for educational purposes only. No information presented constitutes a recommendation by SMB TRAINING or its affiliates to buy, sell or hold any security, financial product or instrument discussed therein or to engage in any specific investment strategy. The content neither is, nor should be construed as, an offer, or a solicitation of an offer, to buy, sell, or hold any securities. You are fully responsible for any investment decisions you make. Such decisions should be based solely on your evaluation of your financial circumstances, investment objectives, risk tolerance and liquidity needs.
4. SMB Training and SMB Capital Management, LLC are separate but affiliated companies.
5. T3 Trading Group, LLC is a Registered SEC Broker-Dealer and Member of the CBOE Stock Exchange (CBSX www.CBOE.com). All trading conducted by contributors on Virtual Trading Floor is done through T3 Trading Group, LLC. 7. The risk of loss in trading securities, options, futures and forex can be substantial. Customers must consider all relevant risk factors, including their own personal financial situation, before trading. Options involve risk and are not suitable for all investors.
See the Options Disclosure Document: Characteristics and Risks of Standardized Options. Trading foreign exchange on margin carries a high level of risk, as well as its own unique risk factors. Please read the following risk disclosure before considering the trading of this product: Forex Risk Disclosure. Futures and forex accounts are not protected by the Securities Investor Protection Corporation (SIPC).
6. No Relevant Positions Disclaimer<br>
2. The seminars given by SMB TRAINING are for educational purposes only. This information neither is, nor should be construed, as an offer, or a solicitation of an offer, to buy or sell securities. You shall be fully responsible for any investment decisions you make, and such decisions will be based solely on your evaluation of your financial circumstances, investment objectives, risk tolerance, and liquidity needs.
3. This material is being provided to you for educational purposes only. No information presented constitutes a recommendation by SMB TRAINING or its affiliates to buy, sell or hold any security, financial product or instrument discussed therein or to engage in any specific investment strategy. The content neither is, nor should be construed as, an offer, or a solicitation of an offer, to buy, sell, or hold any securities. You are fully responsible for any investment decisions you make. Such decisions should be based solely on your evaluation of your financial circumstances, investment objectives, risk tolerance and liquidity needs.
4. SMB Training and SMB Capital Management, LLC are separate but affiliated companies.
5. T3 Trading Group, LLC is a Registered SEC Broker-Dealer and Member of the CBOE Stock Exchange (CBSX www.CBOE.com). All trading conducted by contributors on Virtual Trading Floor is done through T3 Trading Group, LLC. 7. The risk of loss in trading securities, options, futures and forex can be substantial. Customers must consider all relevant risk factors, including their own personal financial situation, before trading. Options involve risk and are not suitable for all investors.
See the Options Disclosure Document: Characteristics and Risks of Standardized Options. Trading foreign exchange on margin carries a high level of risk, as well as its own unique risk factors. Please read the following risk disclosure before considering the trading of this product: Forex Risk Disclosure. Futures and forex accounts are not protected by the Securities Investor Protection Corporation (SIPC).
6. No Relevant Positions Disclaimer<br>
03
Please note: Hypothetical computer simulated performance results are believed to be accurately presented. However, they are not guaranteed as to accuracy or completeness and are subject to change without any notice. Hypothetical or simulated performance results have certain inherent limitations. Unlike an actual performance record, simulated results do not represent actual trading. Since, also, the trades have not actually been executed; the results may have been under or over compensated for the impact, if any, of certain market factors such as liquidity, slippage and commissions. Simulated trading programs in general are also subject to the fact that they are designed with the benefit of hindsight. No representation is being made that any portfolio will, or is likely to achieve profits or losses similar to those shown. All investments and trades carry risks. Hypothetical Trades Disclaimer<br>
04
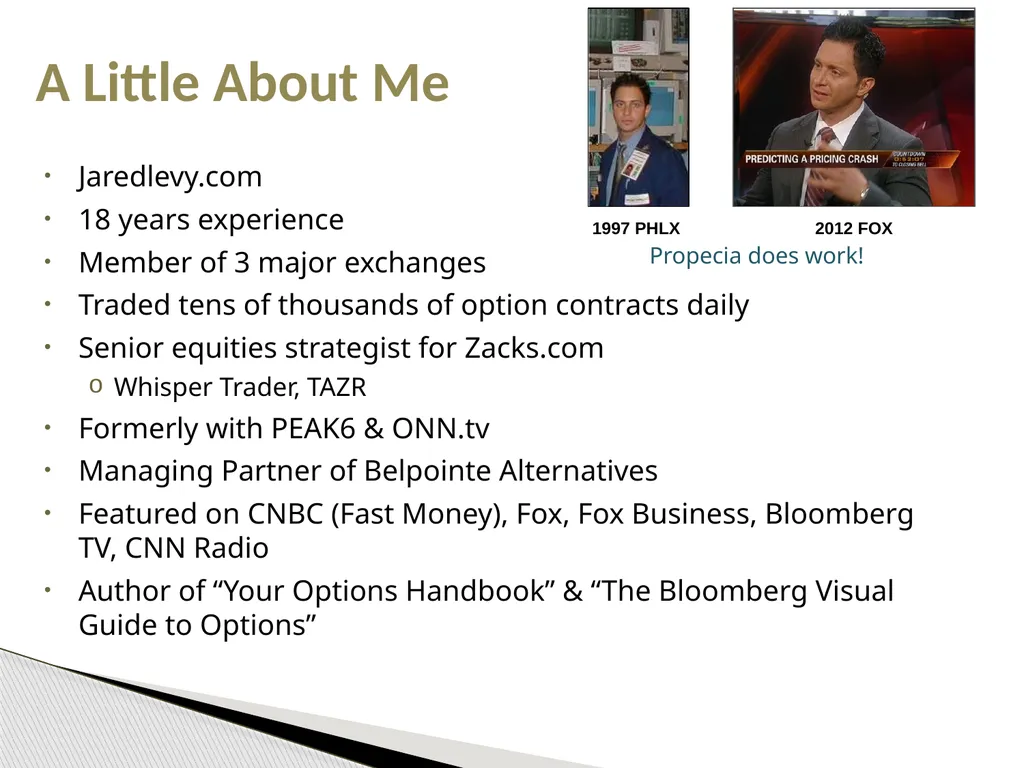
Jaredlevy.com
18 years experience
Member of 3 major exchanges
Traded tens of thousands of option contracts daily
Senior equities strategist for Zacks.com
Whisper Trader, TAZR
Formerly with PEAK6 & ONN.tv
Managing Partner of Belpointe Alternatives
Featured on CNBC (Fast Money), Fox, Fox Business, Bloomberg TV, CNN Radio
Author of “Your Options Handbook” & “The Bloomberg Visual Guide to Options” A Little About Me 1997 PHLX 2012 FOX Propecia does work!<br>
18 years experience
Member of 3 major exchanges
Traded tens of thousands of option contracts daily
Senior equities strategist for Zacks.com
Whisper Trader, TAZR
Formerly with PEAK6 & ONN.tv
Managing Partner of Belpointe Alternatives
Featured on CNBC (Fast Money), Fox, Fox Business, Bloomberg TV, CNN Radio
Author of “Your Options Handbook” & “The Bloomberg Visual Guide to Options” A Little About Me 1997 PHLX 2012 FOX Propecia does work!<br>
05
“Trading appears deceptively easy. When a beginner wins, he feels brilliant and invincible. Then he takes wild risks and loses everything.”
Dr. Alexander Elder
Trading for a Living
Know your strategy
Control your Risk
Keep your Discipline!
Paper Trade Trading Psychology<br>
Dr. Alexander Elder
Trading for a Living
Know your strategy
Control your Risk
Keep your Discipline!
Paper Trade Trading Psychology<br>
06
You will receive a ton of information
You will have a large checklist
(it goes quicker than you think)
Don’t get analysis paralysis
Go with your gut, as long as it’s supported by logical, objective data Warning!<br>
You will have a large checklist
(it goes quicker than you think)
Don’t get analysis paralysis
Go with your gut, as long as it’s supported by logical, objective data Warning!<br>
07
The quick and dirty… What are Options?<br>
08
Are legitimate financial products
Are not mysterious or magic
Perform “as advertised”
Require work to be properly understood Options<br>
Are not mysterious or magic
Perform “as advertised”
Require work to be properly understood Options<br>
09
Derivatives ‘derive’ their value from properties of the underlying
Underlyings - equities, bonds, indices, FX, commodities
Basic principles are the same regardless of the underlying Derivatives<br>
Underlyings - equities, bonds, indices, FX, commodities
Basic principles are the same regardless of the underlying Derivatives<br>
10
Floor trading slowly fading away
Retail trader has ready access to analytics
Black box trading systems
Formulas and algorithms fully automate and execute trades
Grey box trading systems
Combine Black Box algorithms with human interaction The Evolution of Trading<br>
Retail trader has ready access to analytics
Black box trading systems
Formulas and algorithms fully automate and execute trades
Grey box trading systems
Combine Black Box algorithms with human interaction The Evolution of Trading<br>
11
Computers & Models creating more efficient and faster moving markets
No real advantage to being ‘on the floor’ in some markets
Many professional tools are available to average investors
Spreads in some products are very small The Evolution of Trading<br>
No real advantage to being ‘on the floor’ in some markets
Many professional tools are available to average investors
Spreads in some products are very small The Evolution of Trading<br>
12
Homework
Experience (pitfalls and advantages)
Statistics
Technicals
Strategy Selection
Money Management
Exit Strategies (profit and loss)
USE A DAMN CHECKLIST!! Increasing Trade Success<br>
Experience (pitfalls and advantages)
Statistics
Technicals
Strategy Selection
Money Management
Exit Strategies (profit and loss)
USE A DAMN CHECKLIST!! Increasing Trade Success<br>
13
The Trade Process<br>
14
Step 1 : Form Your Macro Thesis<br>
15
Economic Environment
Where are We in the Economic Cycle?
Earnings Trends /Corporate Fundamentals
Technical patterns
News /Blog Flow
What are the Talking Heads Saying?
What are your peers saying? Determine Macro Climate<br>
Where are We in the Economic Cycle?
Earnings Trends /Corporate Fundamentals
Technical patterns
News /Blog Flow
What are the Talking Heads Saying?
What are your peers saying? Determine Macro Climate<br>
16
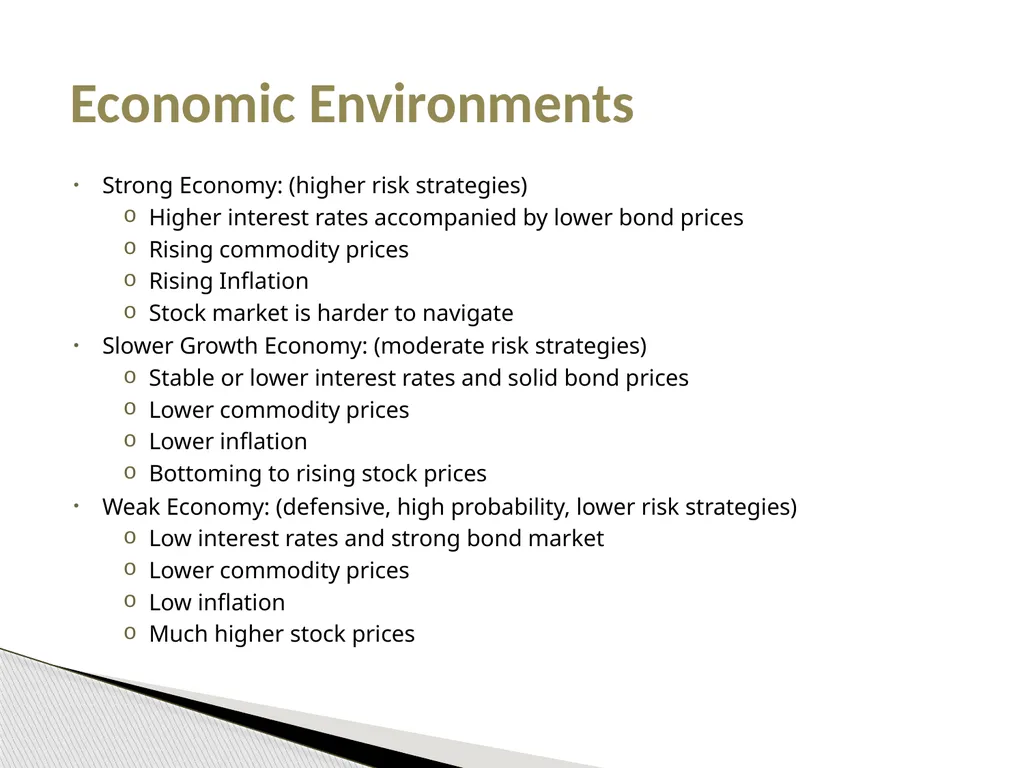
Strong Economy: (higher risk strategies)
Higher interest rates accompanied by lower bond prices
Rising commodity prices
Rising Inflation
Stock market is harder to navigate
Slower Growth Economy: (moderate risk strategies)
Stable or lower interest rates and solid bond prices
Lower commodity prices
Lower inflation
Bottoming to rising stock prices
Weak Economy: (defensive, high probability, lower risk strategies)
Low interest rates and strong bond market
Lower commodity prices
Low inflation
Much higher stock prices Economic Environments<br>
Higher interest rates accompanied by lower bond prices
Rising commodity prices
Rising Inflation
Stock market is harder to navigate
Slower Growth Economy: (moderate risk strategies)
Stable or lower interest rates and solid bond prices
Lower commodity prices
Lower inflation
Bottoming to rising stock prices
Weak Economy: (defensive, high probability, lower risk strategies)
Low interest rates and strong bond market
Lower commodity prices
Low inflation
Much higher stock prices Economic Environments<br>
17
Relationships between the indicators help predict the future financial (and market) cycles.
They fall into three categories:
1.) Leading
2.) Coincident
3.) Lagging Economic Indicators<br>
They fall into three categories:
1.) Leading
2.) Coincident
3.) Lagging Economic Indicators<br>
18
Leading:
Stock prices, slope of the yield curve, and the strength or weakness of the US Dollar. Economic Indicators<br>
Stock prices, slope of the yield curve, and the strength or weakness of the US Dollar. Economic Indicators<br>
19
Stock prices:
Specifically look at the S&P 500. It represents the 500 largest companies on the NYSE.
The stock market closely relates to the growth in liquidity. Increasing growth reflects increasing liquidity, which directly benefits stock prices.
For example, the Fed lending more money to distressed financial firms. Leading<br>
Specifically look at the S&P 500. It represents the 500 largest companies on the NYSE.
The stock market closely relates to the growth in liquidity. Increasing growth reflects increasing liquidity, which directly benefits stock prices.
For example, the Fed lending more money to distressed financial firms. Leading<br>
20
Slope of the yield curve:
Confirms trends in the growth of money supply and the dollar.
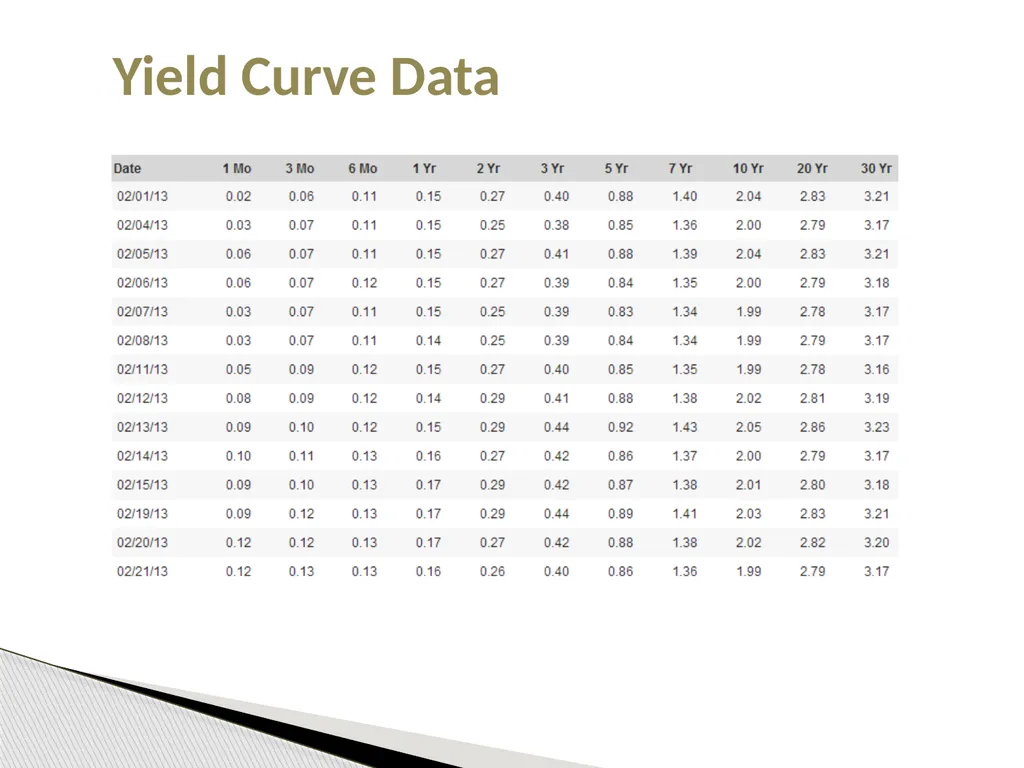
Computed by subtracting the 13-week Treasury bills (^IRX) from the yield on the 10-year Treasury bond. (See the Federal Reserve website for weekly numbers: http://www.federalreserve.gov/releases/h15/Current/)
If the difference increases = yield steepens
Decrease = flattens
Inversion = negative difference between the two. Leading continued<br>
Confirms trends in the growth of money supply and the dollar.
Computed by subtracting the 13-week Treasury bills (^IRX) from the yield on the 10-year Treasury bond. (See the Federal Reserve website for weekly numbers: http://www.federalreserve.gov/releases/h15/Current/)
If the difference increases = yield steepens
Decrease = flattens
Inversion = negative difference between the two. Leading continued<br>
21
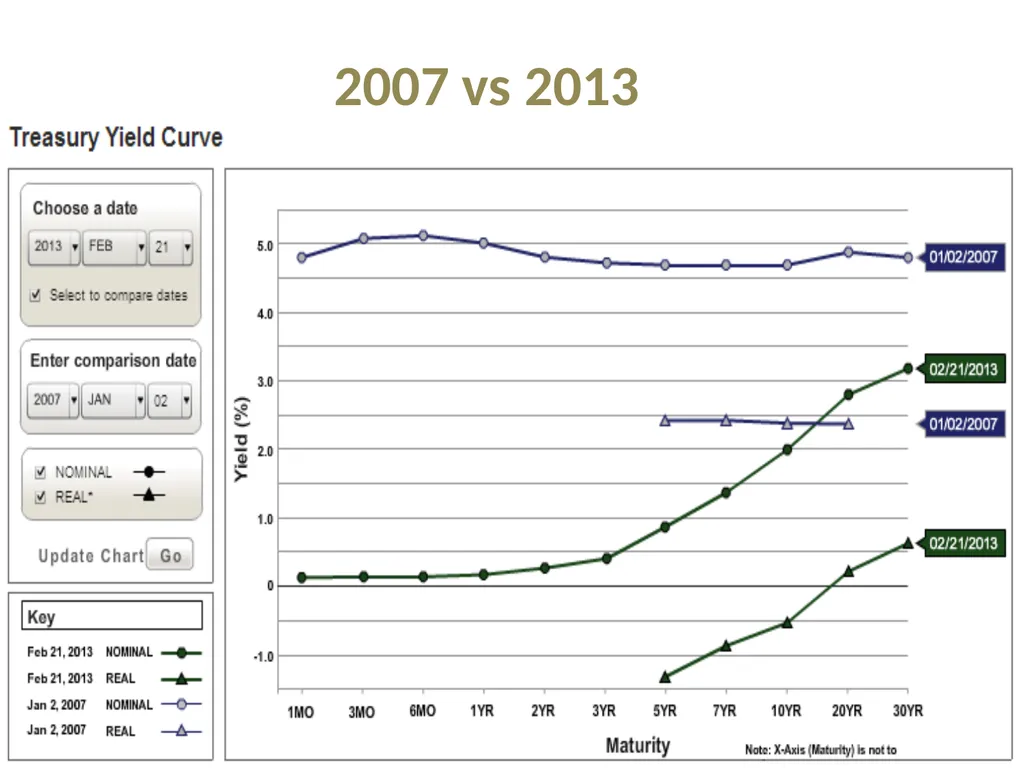
When it steepens, the Fed is loosening credit and real short-term interest rates (difference between short-term interest rates and the inflation rate) decline.
When it flattens, the Fed is tightening credit and trying to catch an overheating economy while keeping inflation under control.
When it inverts, the yield on the 13-week Treasury Bill is the same or higher than the yield on the 10-year Treasury bond. This is typical in times of tight credit control and indicates a future recession. Yield curve<br>
When it flattens, the Fed is tightening credit and trying to catch an overheating economy while keeping inflation under control.
When it inverts, the yield on the 13-week Treasury Bill is the same or higher than the yield on the 10-year Treasury bond. This is typical in times of tight credit control and indicates a future recession. Yield curve<br>
22
2007 vs 2013<br>
23
Yield Curve Data<br>
24
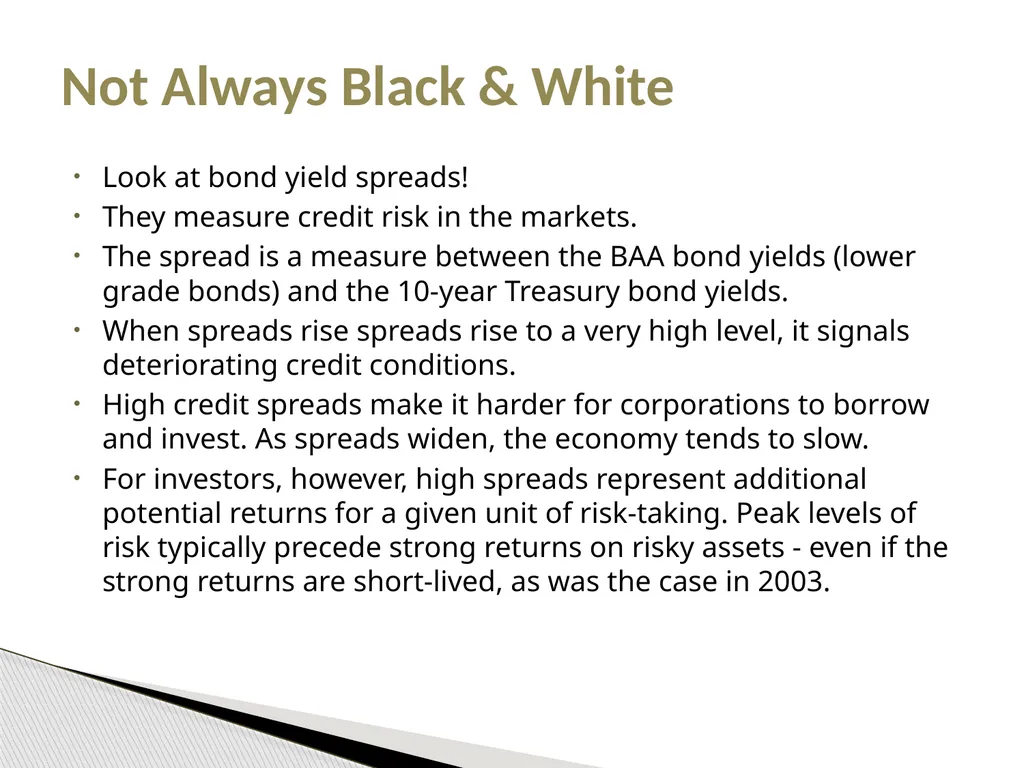
Look at bond yield spreads!
They measure credit risk in the markets.
The spread is a measure between the BAA bond yields (lower grade bonds) and the 10-year Treasury bond yields.
When spreads rise spreads rise to a very high level, it signals deteriorating credit conditions.
High credit spreads make it harder for corporations to borrow and invest. As spreads widen, the economy tends to slow.
For investors, however, high spreads represent additional potential returns for a given unit of risk-taking. Peak levels of risk typically precede strong returns on risky assets - even if the strong returns are short-lived, as was the case in 2003. Not Always Black & White<br>
They measure credit risk in the markets.
The spread is a measure between the BAA bond yields (lower grade bonds) and the 10-year Treasury bond yields.
When spreads rise spreads rise to a very high level, it signals deteriorating credit conditions.
High credit spreads make it harder for corporations to borrow and invest. As spreads widen, the economy tends to slow.
For investors, however, high spreads represent additional potential returns for a given unit of risk-taking. Peak levels of risk typically precede strong returns on risky assets - even if the strong returns are short-lived, as was the case in 2003. Not Always Black & White<br>
25
Coincident Indicators<br>
26
Employment numbers, production, housing activity, retail sales, car sales, Purchasing Manager Index, ISM reports, Sentiment.
These are most often reported and sometimes distorted by the media. Coincident Indicators<br>
These are most often reported and sometimes distorted by the media. Coincident Indicators<br>
27
To indicate if economic growth is rising or falling.
Indicate whether growth is above or below the average.
Indicate when growth reaches a peak or trough.
Use as checkpoints while you’re in a longer duration trade
The coincident indicators often follow 6-18 months after a decline in leading indicators. Using Coincident Indicators<br>
Indicate whether growth is above or below the average.
Indicate when growth reaches a peak or trough.
Use as checkpoints while you’re in a longer duration trade
The coincident indicators often follow 6-18 months after a decline in leading indicators. Using Coincident Indicators<br>
28
Institute for Supply Management, Purchasing Managers
The number reported reflects trends in the manufacturing and non-manufacturing sectors.
The index oscillates around 50%.
Business activity is strong when the reading is above 50. ISM – PMI (coincident)<br>
The number reported reflects trends in the manufacturing and non-manufacturing sectors.
The index oscillates around 50%.
Business activity is strong when the reading is above 50. ISM – PMI (coincident)<br>
29
Bureau of Labor Statistics
Reported on the First Friday of every month.
It gives investors a report of employment figures for the previous month.
ADP precedes that Wednesday and has historically been more “positive” BLS (coincident)<br>
Reported on the First Friday of every month.
It gives investors a report of employment figures for the previous month.
ADP precedes that Wednesday and has historically been more “positive” BLS (coincident)<br>
30
When car sales and goods are robust, the economy is growing.
When they are flat the economy is running out of energy.
Look for trends greater than 3 months Car sales / Durable Goods<br>
When they are flat the economy is running out of energy.
Look for trends greater than 3 months Car sales / Durable Goods<br>
31
When housing starts are increasing, the economy is strong.
The home is not only the larges personal asset, but inflation protection
Home prices falling has far reaching ramifications Housing Starts /Building Permits (coincident)<br>
The home is not only the larges personal asset, but inflation protection
Home prices falling has far reaching ramifications Housing Starts /Building Permits (coincident)<br>
32
Lagging Indicators<br>
33
Real short-term interest rates, inflation at the consumer and producer levels, and the growth in commodities.
When these start to move, major change has already happened Lagging Indicators<br>
When these start to move, major change has already happened Lagging Indicators<br>
34
Measures the difference between short-term interest rates and the inflation rate.
High real short-term interest rates are associated with periods of declining inflation rates, higher bond prices, and lower precious metal stocks.
Low real interest rates create a volatile stock market. REAL Short-term Interest Rates (lagging)<br>
High real short-term interest rates are associated with periods of declining inflation rates, higher bond prices, and lower precious metal stocks.
Low real interest rates create a volatile stock market. REAL Short-term Interest Rates (lagging)<br>
35
Inflation (deflation) at the consumer level
Look at trends
Often misleading and hard to read
Break the reports apart to find where prices really are moving CPI / PPI (lagging)<br>
Look at trends
Often misleading and hard to read
Break the reports apart to find where prices really are moving CPI / PPI (lagging)<br>
36
The economy is expanding at an above average rate. Employees demand a rise in income.
Consumers borrow more money. More borrowed money raises interest rates.
Moderately higher interest rates cause the consumer to re-think buying more.
Producers then cut back on their production, and the economy slows to a more manageable growth rate. A Perfect World Example:<br>
Consumers borrow more money. More borrowed money raises interest rates.
Moderately higher interest rates cause the consumer to re-think buying more.
Producers then cut back on their production, and the economy slows to a more manageable growth rate. A Perfect World Example:<br>
37
Do you account for macro risk?
Are you able to quantify it? Forming the Macro Scenario<br>
Are you able to quantify it? Forming the Macro Scenario<br>
38
Some are more easily identified than others.
For example, if short-term interest rates drop, commodities drop, then the money supply may grow for a few months before stock prices grow.
Another scenario is a weak economy with stable or lower rates with firm bond prices. Commodities are heading lower, and inflationary fears start to subside. What’s the “Scenario?”<br>
For example, if short-term interest rates drop, commodities drop, then the money supply may grow for a few months before stock prices grow.
Another scenario is a weak economy with stable or lower rates with firm bond prices. Commodities are heading lower, and inflationary fears start to subside. What’s the “Scenario?”<br>
39
These are the typical turning points in the business and financial cycles.
The leading, coincident and lagging indicators all play off each other in different ways.
Each scenario forecasts the next; this helps you get an idea of what’s to come and adjust your risk accordingly Scenarios Identified<br>
The leading, coincident and lagging indicators all play off each other in different ways.
Each scenario forecasts the next; this helps you get an idea of what’s to come and adjust your risk accordingly Scenarios Identified<br>
40
The leading indicators have risen sharply but are growing more slowly. The coincident indicators rise sharply, and the lagging indicators spike.
Stock prices are in a bull market.
The Dollar is strong but trading in a range.
The yield curve has been steepening for a while and is flattening out.
Industrial production is expanding with the ISM well above 50%.
Employment and retail are rising.
Inflation is creeping up along with the strong economy, forcing commodities to strengthen. Scenario 1:<br>
Stock prices are in a bull market.
The Dollar is strong but trading in a range.
The yield curve has been steepening for a while and is flattening out.
Industrial production is expanding with the ISM well above 50%.
Employment and retail are rising.
Inflation is creeping up along with the strong economy, forcing commodities to strengthen. Scenario 1:<br>
41
The leading indicators decline, the coincident indicators rise rapidly then slow, and the lagging indicators rise.
Consumers are borrowing less and trim their purchases.
Rising inflation reflects rising costs for business.
Bond yields are moving higher because of rising inflation.
The Dollar is weakening dramatically. Scenario 2:<br>
Consumers are borrowing less and trim their purchases.
Rising inflation reflects rising costs for business.
Bond yields are moving higher because of rising inflation.
The Dollar is weakening dramatically. Scenario 2:<br>
42
The leading indicators continue to decline, the coincident indicators are still heading lower, and the lagging indicators have stopped rising.
The economy has weakened enough due to slower growth in demand.
Interest rates are low.
Commodities are lower due to less demand on the consumer and manufacturer levels.
The yield curve flattens.
The Dollar remains weak. Scenario 3:<br>
The economy has weakened enough due to slower growth in demand.
Interest rates are low.
Commodities are lower due to less demand on the consumer and manufacturer levels.
The yield curve flattens.
The Dollar remains weak. Scenario 3:<br>
43
The leading indicators bottomed, the coincident indicators decline and the lagging indicators decline.
Costs are declining and margins are improving.
More money is borrowed.
Due to remaining low interest rates, the yield curve steepens.
Stock prices gain renewed strength.
Foreign investors recognize new prospects and bid up the dollar. (Bond auction results?) Scenario 4:<br>
Costs are declining and margins are improving.
More money is borrowed.
Due to remaining low interest rates, the yield curve steepens.
Stock prices gain renewed strength.
Foreign investors recognize new prospects and bid up the dollar. (Bond auction results?) Scenario 4:<br>
44
The leading indicators continue to rise, the coincident indicators stop dropping and rise slowly and the lagging indicators are still in a downtrend.
Commodity prices are still moving lower.
Lower interest rates and inflation prompt consumers to borrow and purchase goods.
The economy stops slowing. Scenario 5: Rinse & Repeat<br>
Commodity prices are still moving lower.
Lower interest rates and inflation prompt consumers to borrow and purchase goods.
The economy stops slowing. Scenario 5: Rinse & Repeat<br>
45
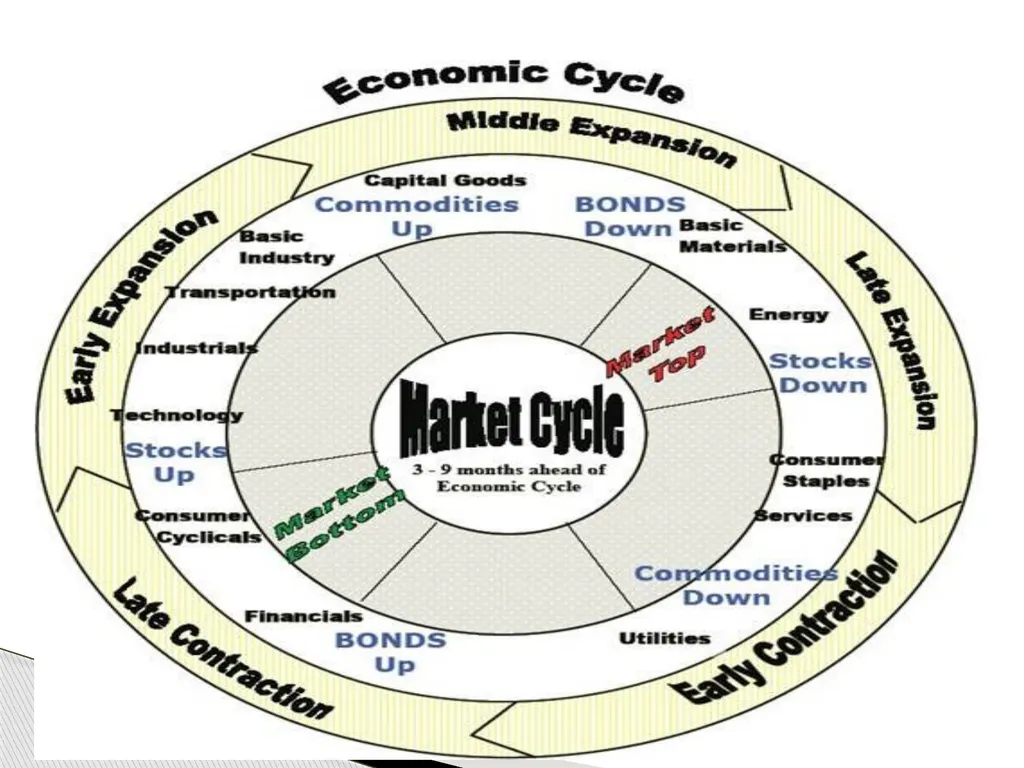
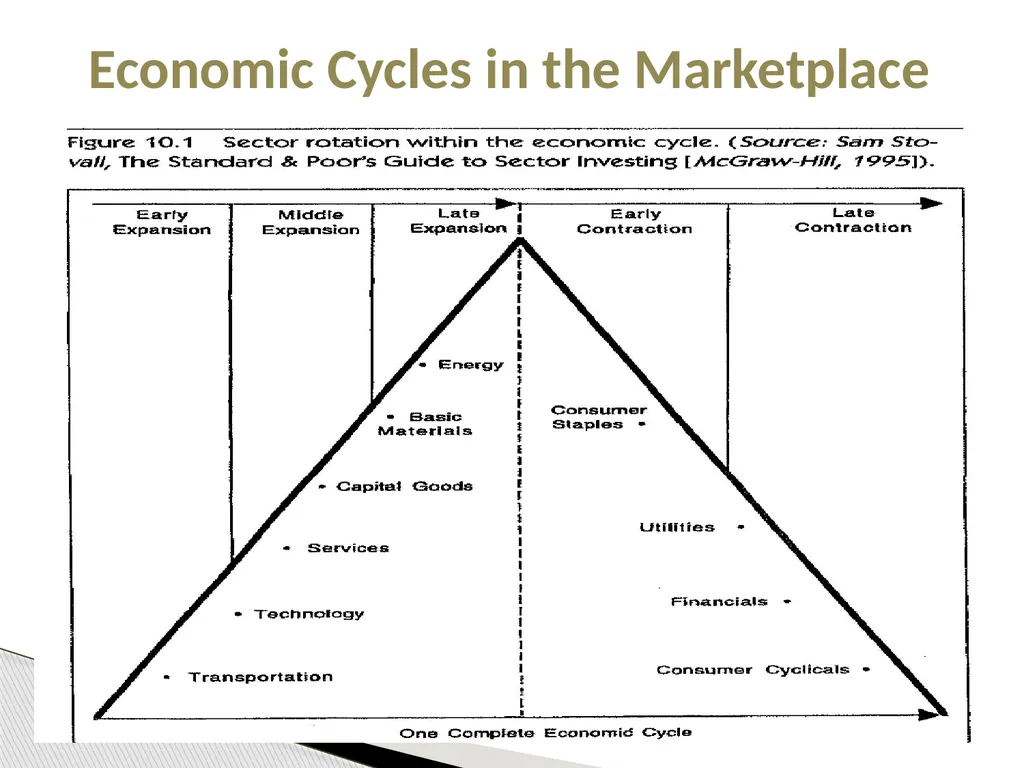
Economic Cycles in the Marketplace<br>
46
Depends on the level of risk.
When risk rises, the chances of making a profitable return drops.
IS RISK HIGH OR LOW?
What is your trade horizon?
This is the critical planning stage. Poor planning can hurt. Macro Timing Right?<br>
When risk rises, the chances of making a profitable return drops.
IS RISK HIGH OR LOW?
What is your trade horizon?
This is the critical planning stage. Poor planning can hurt. Macro Timing Right?<br>
47
Step 2 : Finding Your Target<br>
48
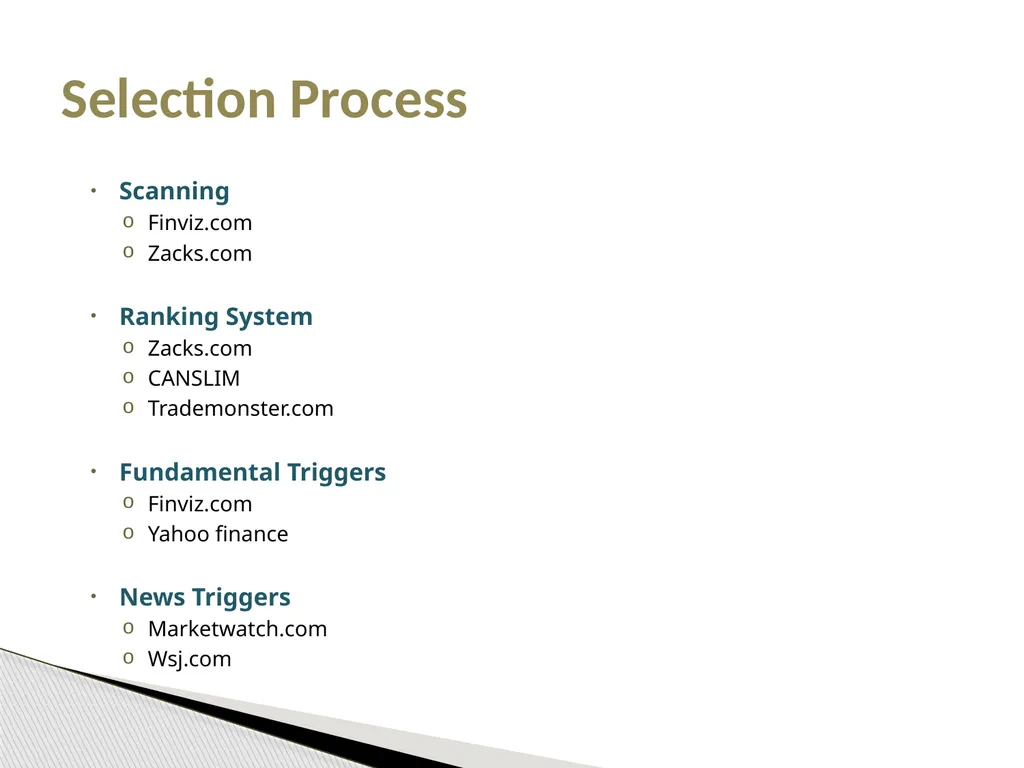
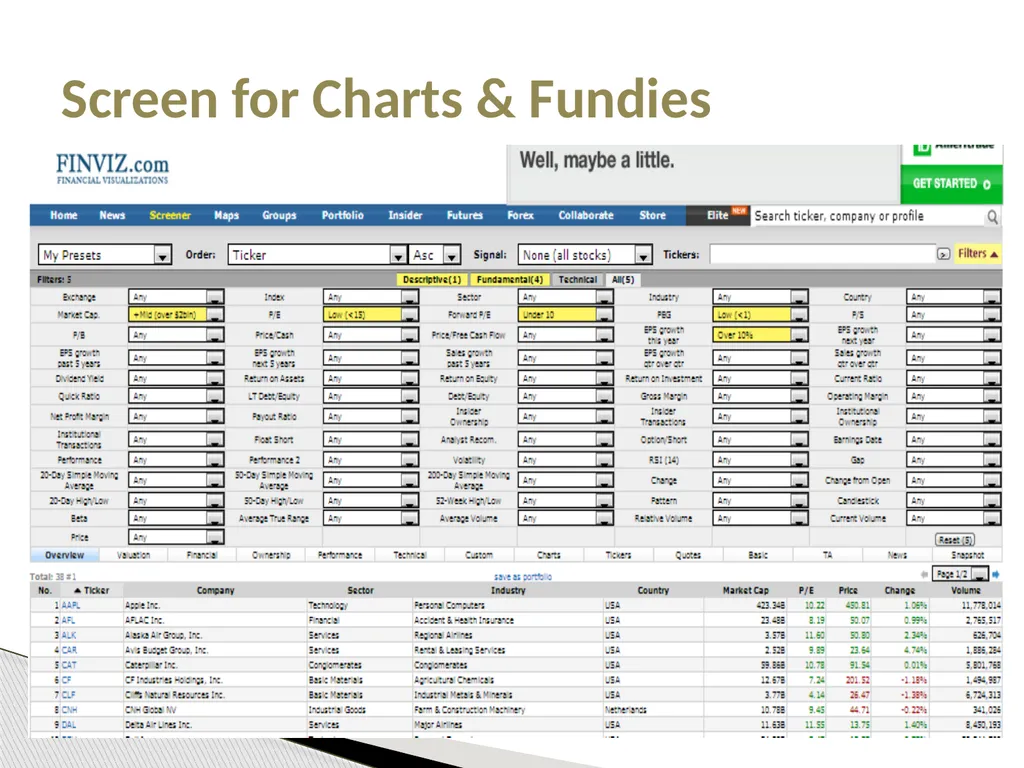
Scanning
Finviz.com
Zacks.com
Ranking System
Zacks.com
CANSLIM
Trademonster.com
Fundamental Triggers
Finviz.com
Yahoo finance
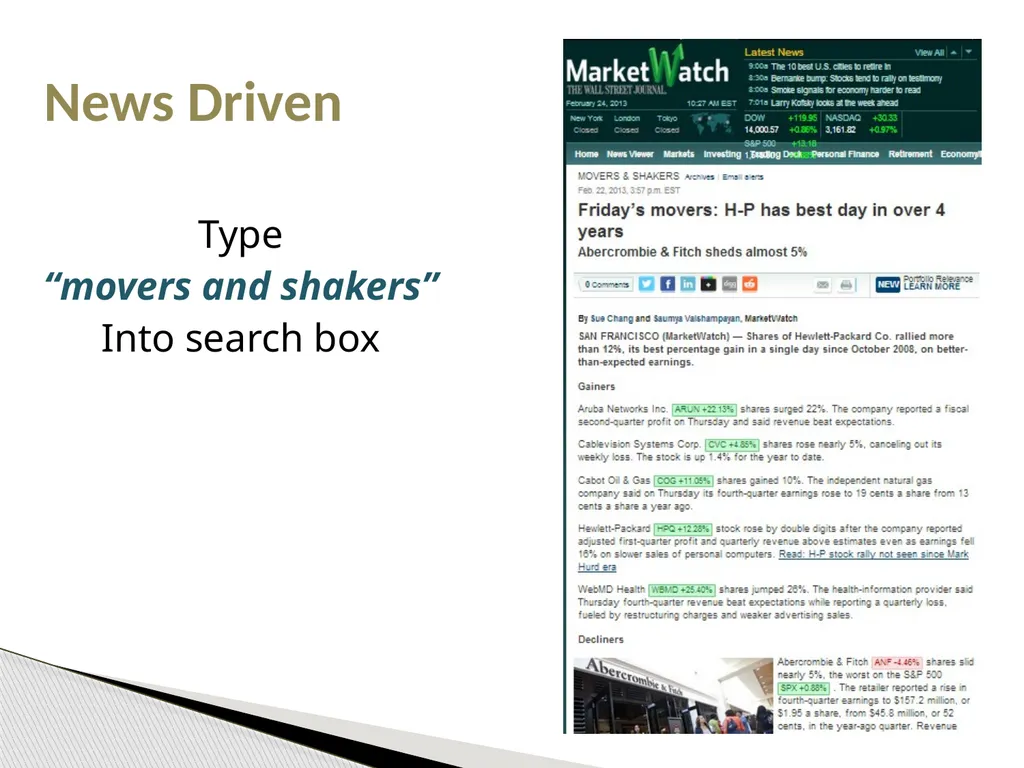
News Triggers
Marketwatch.com
Wsj.com Selection Process<br>
Finviz.com
Zacks.com
Ranking System
Zacks.com
CANSLIM
Trademonster.com
Fundamental Triggers
Finviz.com
Yahoo finance
News Triggers
Marketwatch.com
Wsj.com Selection Process<br>
49
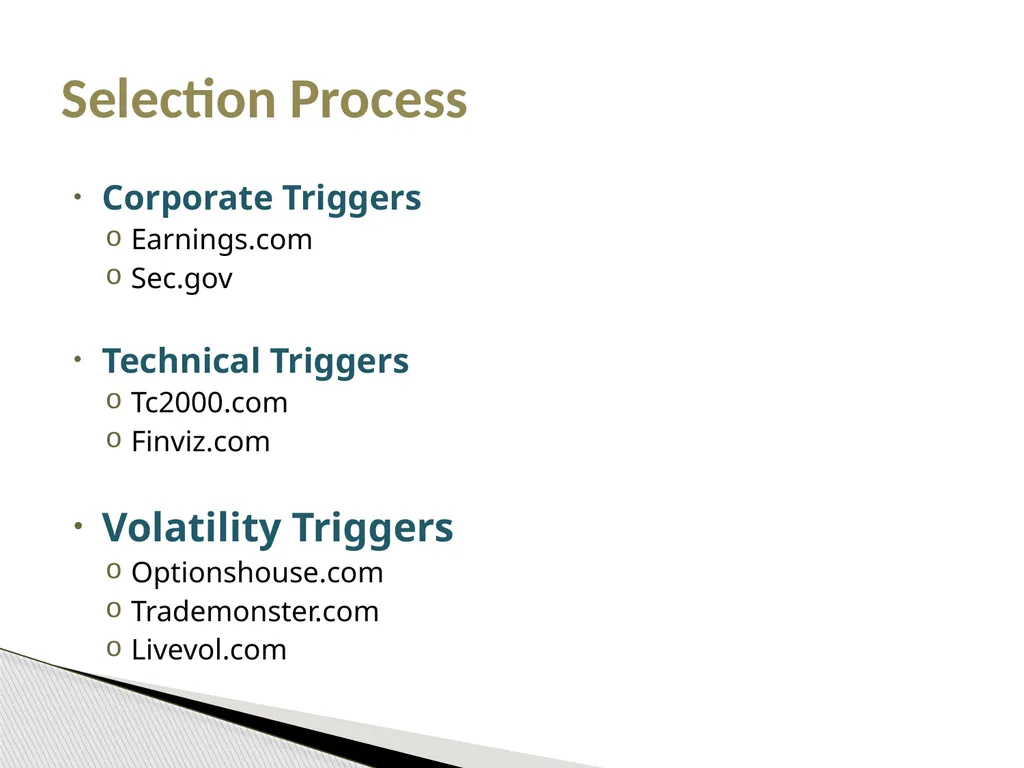
Corporate Triggers
Earnings.com
Sec.gov
Technical Triggers
Tc2000.com
Finviz.com
Volatility Triggers
Optionshouse.com
Trademonster.com
Livevol.com Selection Process<br>
Earnings.com
Sec.gov
Technical Triggers
Tc2000.com
Finviz.com
Volatility Triggers
Optionshouse.com
Trademonster.com
Livevol.com Selection Process<br>
50
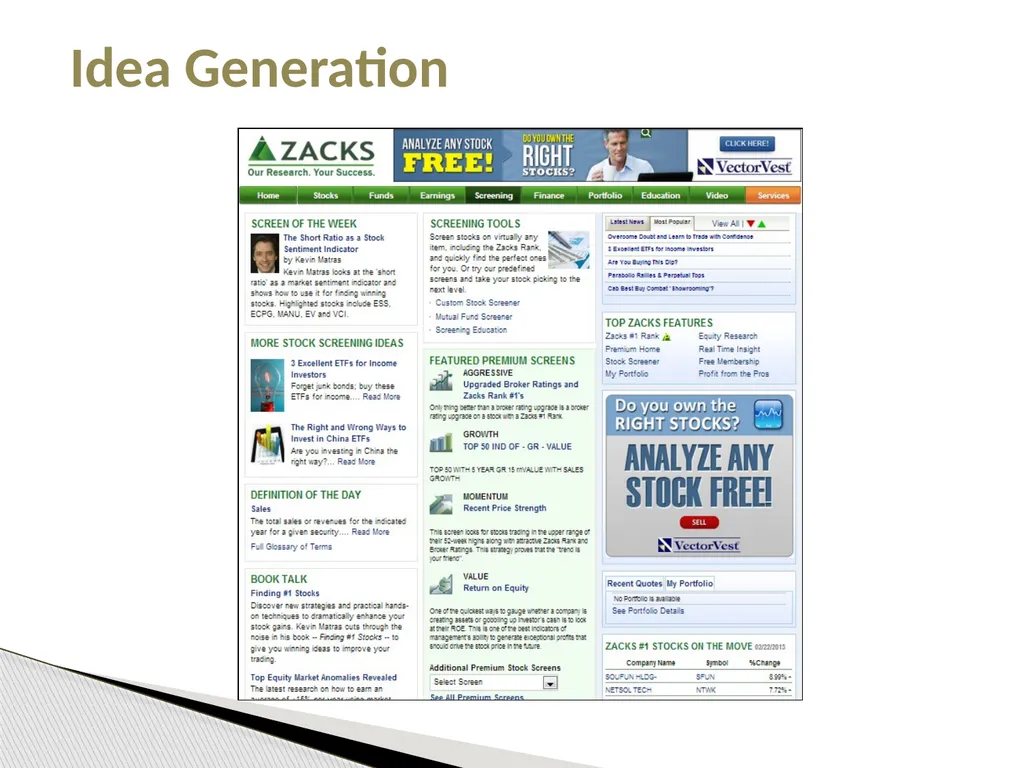
Idea Generation<br>
51
Screen for Charts & Fundies<br>
52
Type
“movers and shakers”
Into search box News Driven<br>
“movers and shakers”
Into search box News Driven<br>
53
More Advanced Concepts
Standard Deviation as a form of a stocks typical movement
Target “normal” range of stock
Sell call outside that range Taking the Trade a Step Further<br>
Standard Deviation as a form of a stocks typical movement
Target “normal” range of stock
Sell call outside that range Taking the Trade a Step Further<br>