
Three Rivers Local School District Five Year
Description: Three Rivers Local School District Five Year Financial Forecast Key Indicators Analysis Teri Riesenberg, Treasurer May 28, 2024 CURRENT FISCAL YEAR Financial Forecast Key Indicators Analysis Three Rivers Local SD Current Fiscal Year
Related Topics
Download Presentation
"Three Rivers Local School District Five Year" is the property of its rightful owner. Permission is granted to download and print the materials on this website for personal, non-commercial use only, and to display it on your personal computer provided you do not modify the materials and that you retain all copyright notices contained in the materials. By downloading content from our website, you accept the terms of this agreement.
Presentation Transcript
slide1. Three Rivers Local School District Five Year Financial Forecast
Key Indicators & Analysis
Teri Riesenberg, Treasurer
May 28, 2024<br>
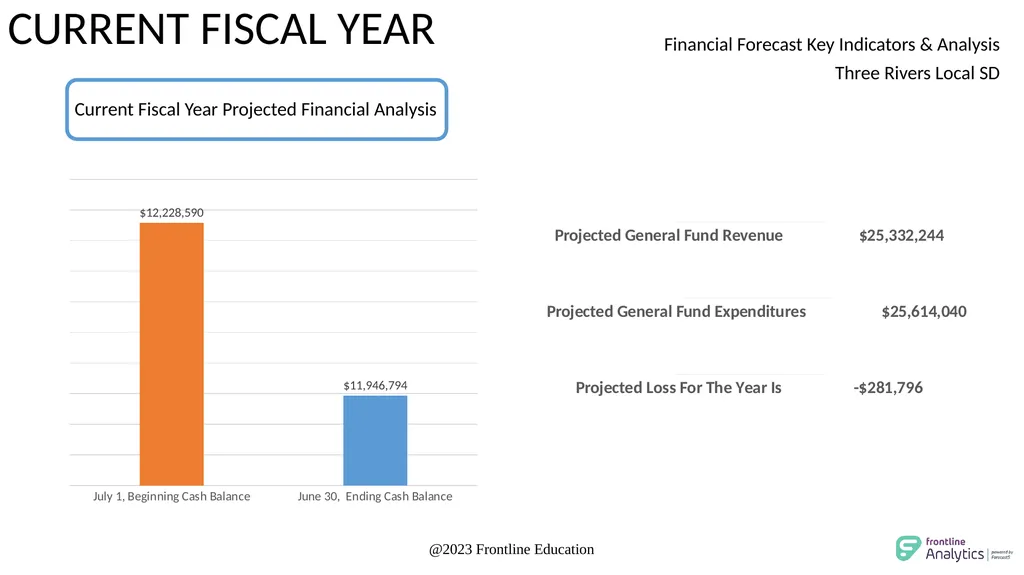
slide2. CURRENT FISCAL YEAR Financial Forecast Key Indicators & Analysis Three Rivers Local SD Current Fiscal Year Projected Financial Analysis @2023 Frontline Education<br>
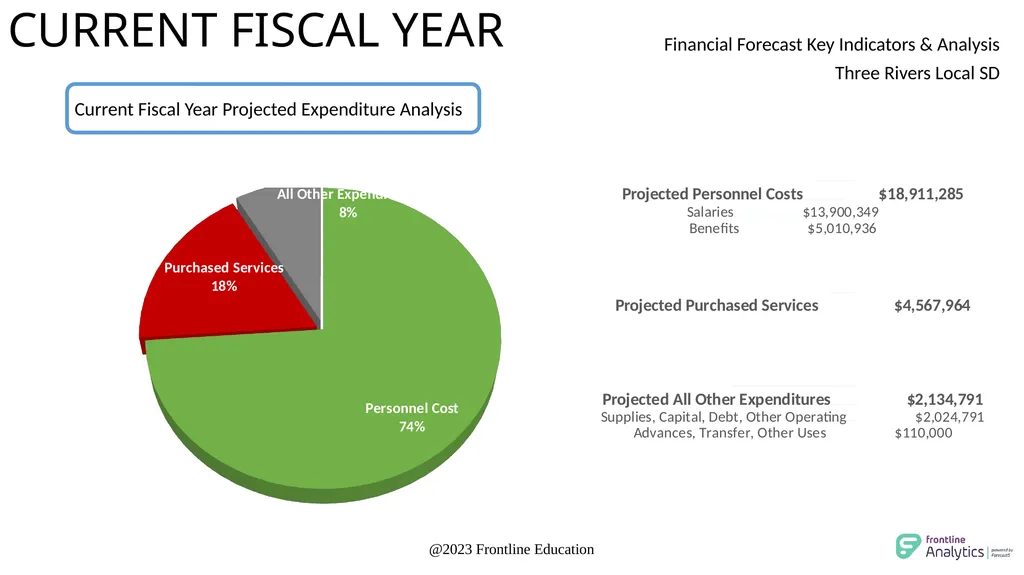
slide3. CURRENT FISCAL YEAR Financial Forecast Key Indicators & Analysis Three Rivers Local SD Current Fiscal Year Projected Expenditure Analysis @2023 Frontline Education<br>
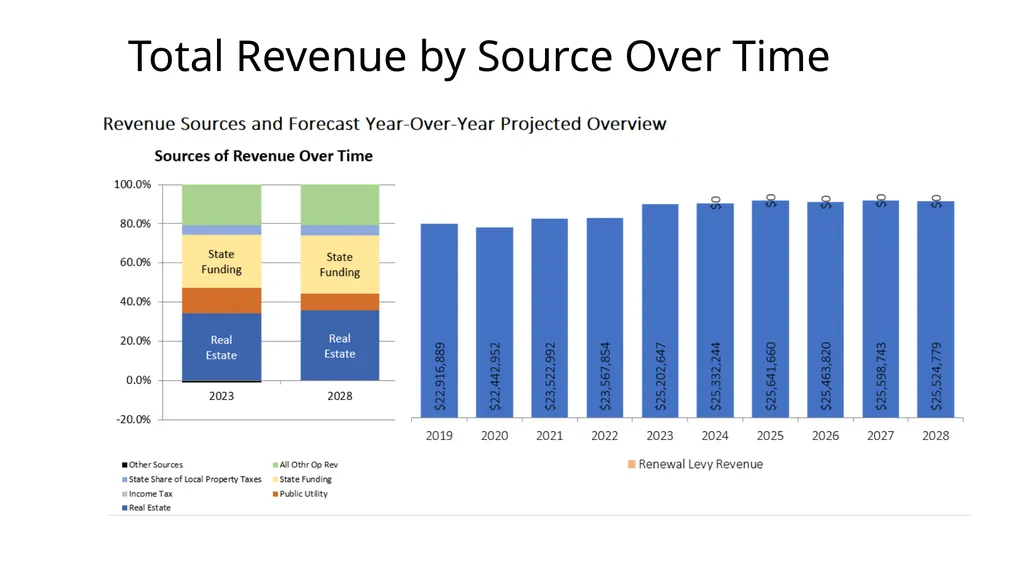
slide4. Total Revenue by Source Over Time<br>
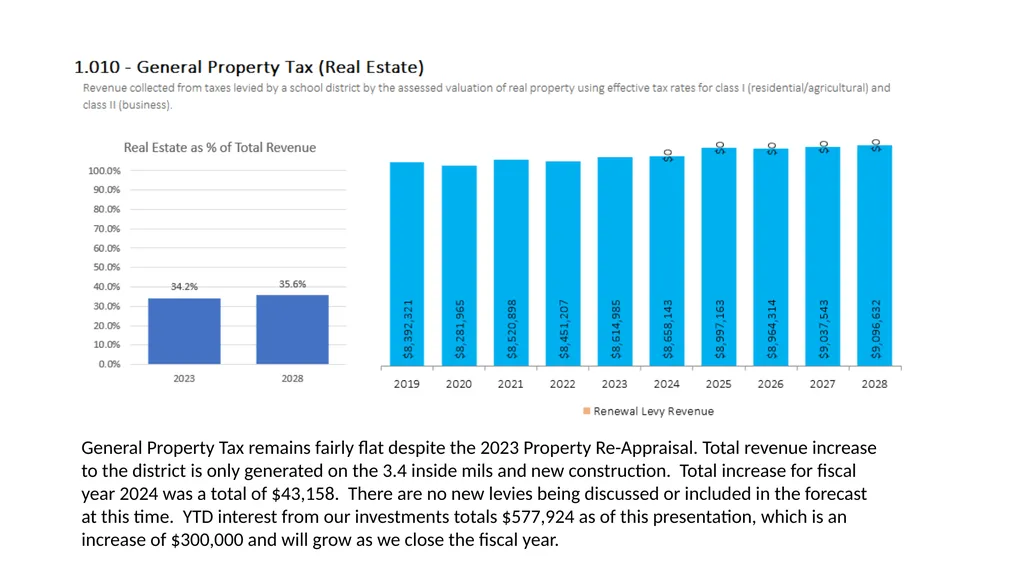
slide5. General Property Tax remains fairly flat despite the 2023 Property Re-Appraisal. Total revenue increase to the district is only generated on the 3.4 inside mils and new construction. Total increase for fiscal year 2024 was a total of $43,158. There are no new levies being discussed or included in the forecast at this time. YTD interest from our investments totals $577,924 as of this presentation, which is an increase of $300,000 and will grow as we close the fiscal year.<br>
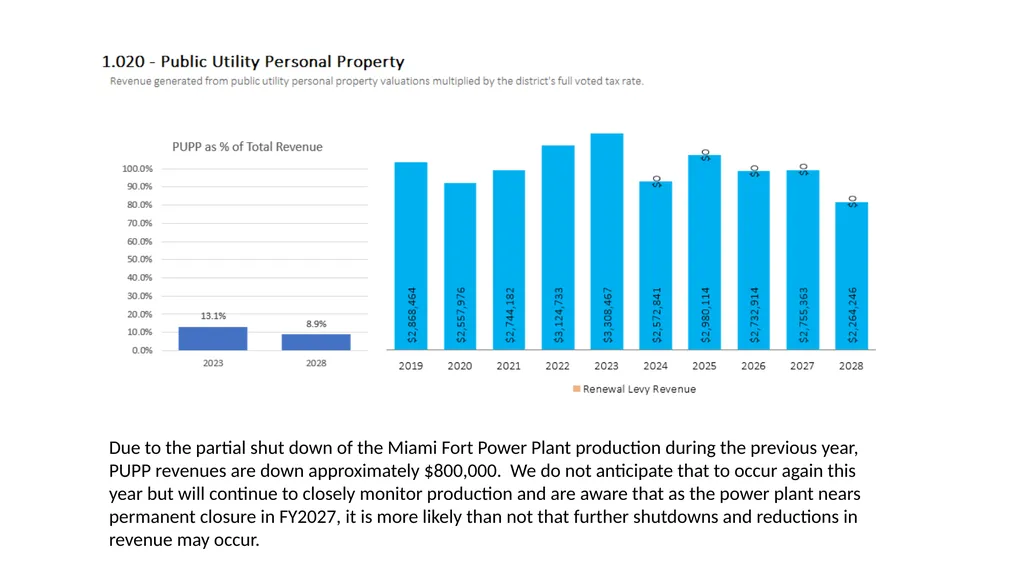
slide6. Due to the partial shut down of the Miami Fort Power Plant production during the previous year, PUPP revenues are down approximately $800,000. We do not anticipate that to occur again this year but will continue to closely monitor production and are aware that as the power plant nears permanent closure in FY2027, it is more likely than not that further shutdowns and reductions in revenue may occur.<br>
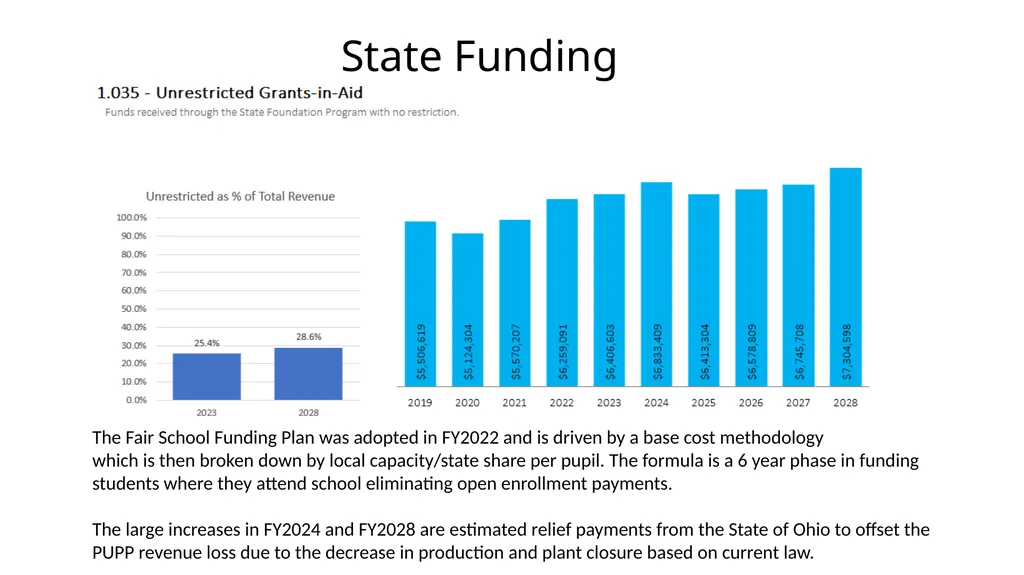
slide7. State Funding The Fair School Funding Plan was adopted in FY2022 and is driven by a base cost methodology
which is then broken down by local capacity/state share per pupil. The formula is a 6 year phase in funding students where they attend school eliminating open enrollment payments.
The large increases in FY2024 and FY2028 are estimated relief payments from the State of Ohio to offset the PUPP revenue loss due to the decrease in production and plant closure based on current law.<br>
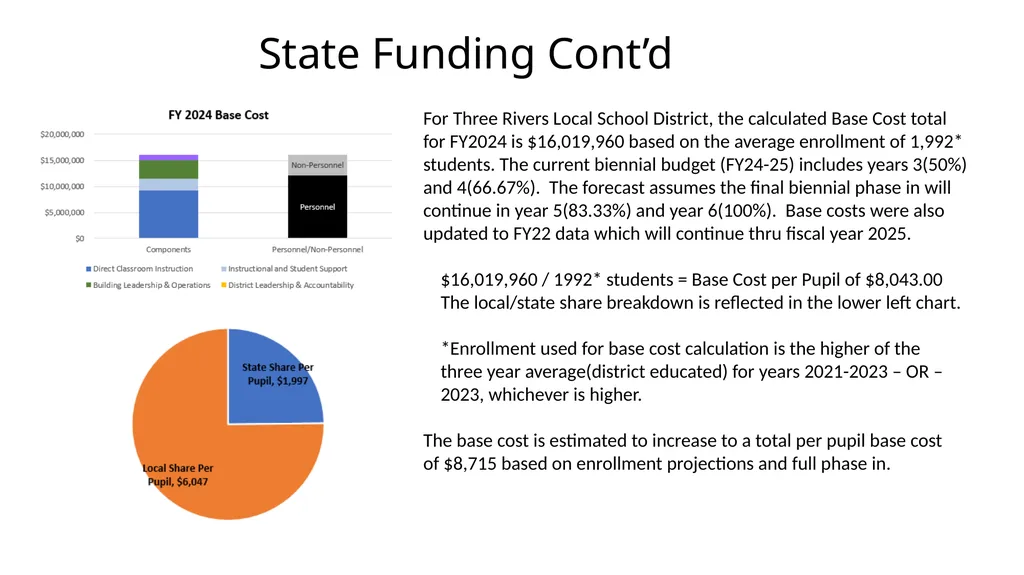
slide8. State Funding Cont’d For Three Rivers Local School District, the calculated Base Cost total for FY2024 is $16,019,960 based on the average enrollment of 1,992* students. The current biennial budget (FY24-25) includes years 3(50%) and 4(66.67%). The forecast assumes the final biennial phase in will continue in year 5(83.33%) and year 6(100%). Base costs were also updated to FY22 data which will continue thru fiscal year 2025.
$16,019,960 / 1992* students = Base Cost per Pupil of $8,043.00
The local/state share breakdown is reflected in the lower left chart.
*Enrollment used for base cost calculation is the higher of the
three year average(district educated) for years 2021-2023 – OR –
2023, whichever is higher.
The base cost is estimated to increase to a total per pupil base cost
of $8,715 based on enrollment projections and full phase in.<br>
slide9. Summary Revenue Assumptions
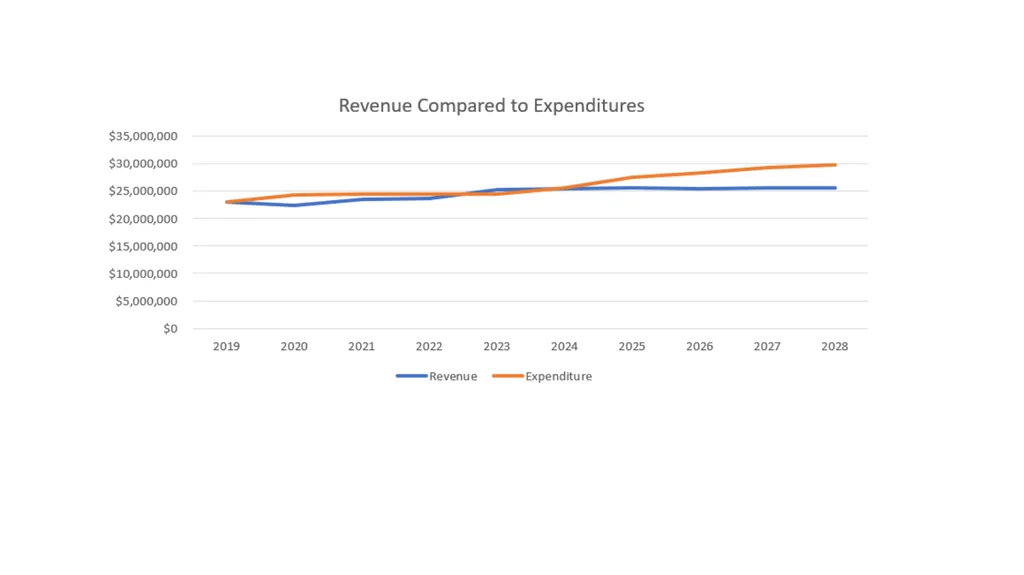
Revenue remains fairly flat throughout the Forecast
We will continue to communicate with and monitor the Miami Fort Power Plant production closely to identify any loss of production. The Miami Fort Power Plant
remains scheduled for permanent closure no later than FY2027.
We will continue to monitor student enrollment projections and changes to estimate future state funding. The forecast assumes the FSFP phase in will continue through the next biennium.
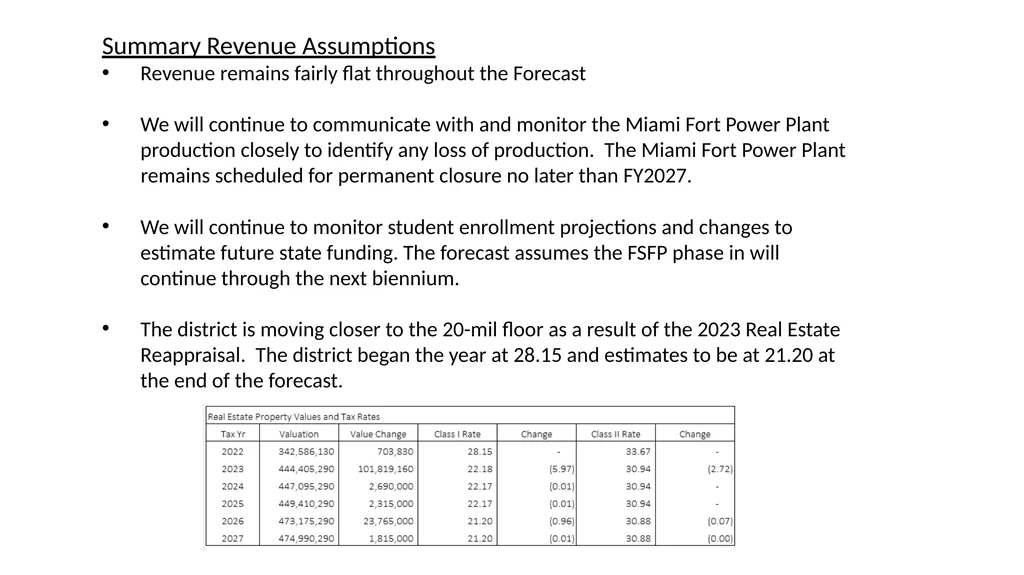
The district is moving closer to the 20-mil floor as a result of the 2023 Real Estate Reappraisal. The district began the year at 28.15 and estimates to be at 21.20 at the end of the forecast.<br>
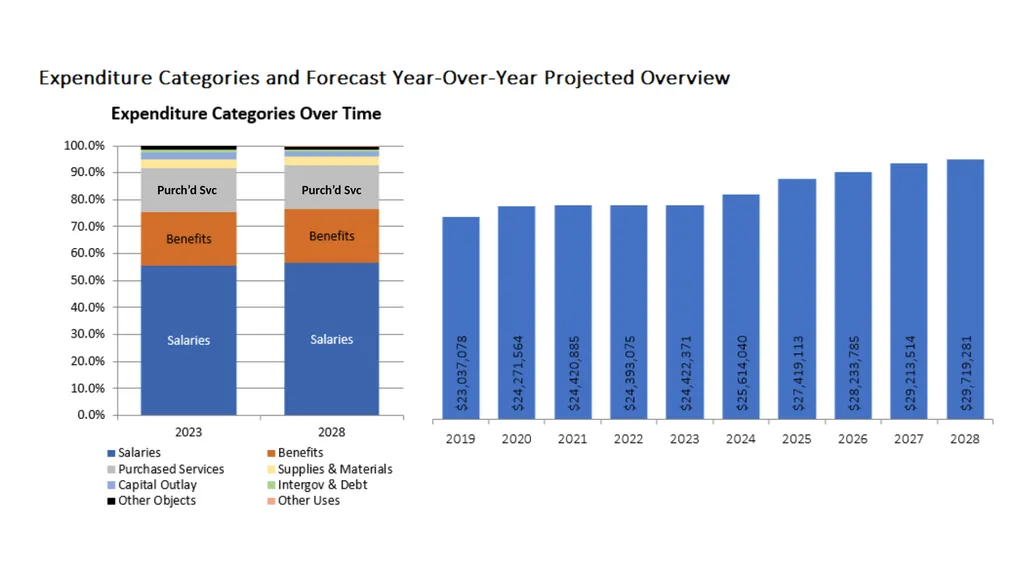
slide10. Purch’d Svc Purch’d Svc<br>
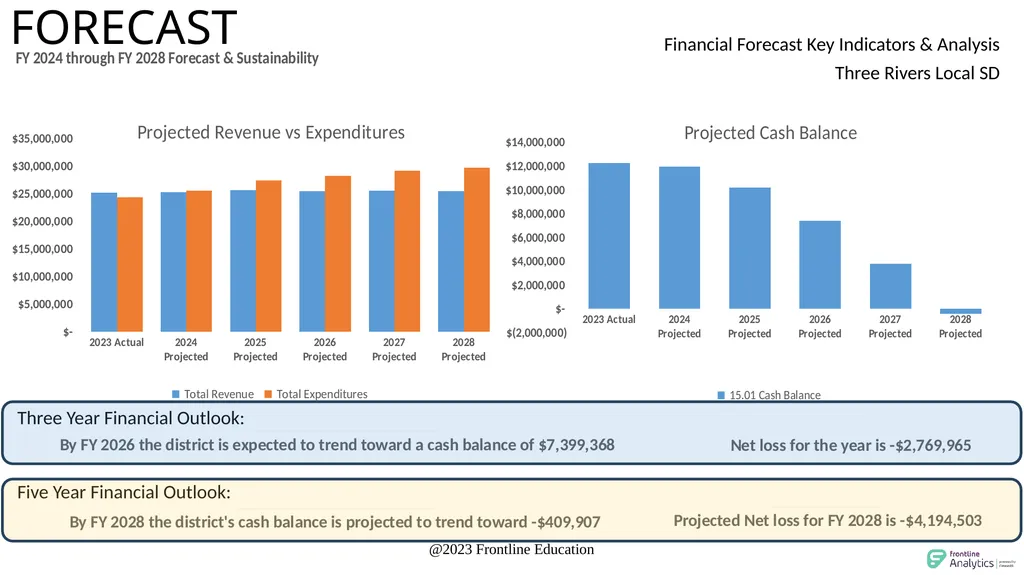
slide11. FORECAST Financial Forecast Key Indicators & Analysis Three Rivers Local SD Three Year Financial Outlook: Five Year Financial Outlook: @2023 Frontline Education<br>
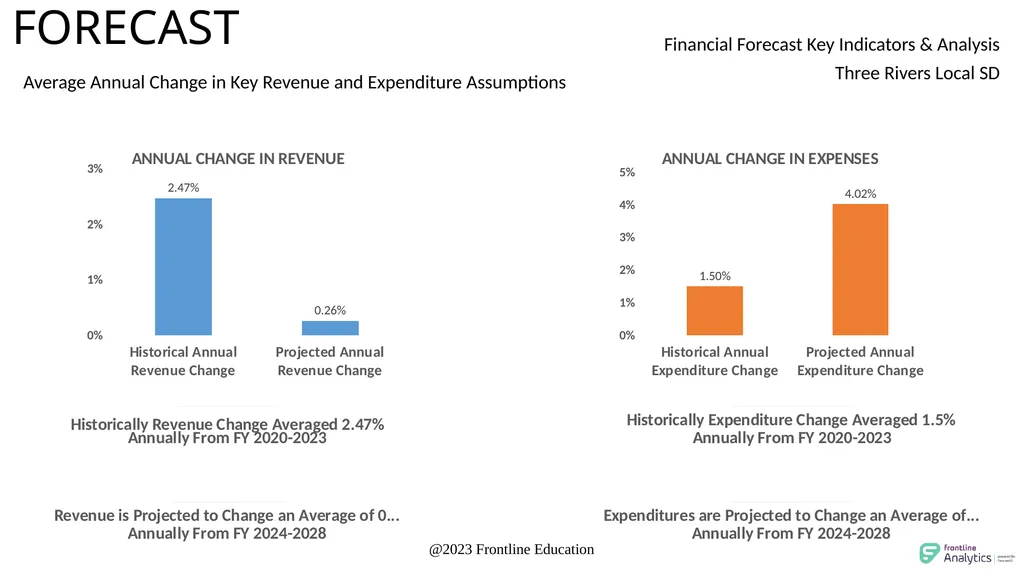
slide12. FORECAST Financial Forecast Key Indicators & Analysis Three Rivers Local SD Average Annual Change in Key Revenue and Expenditure Assumptions @2023 Frontline Education<br>
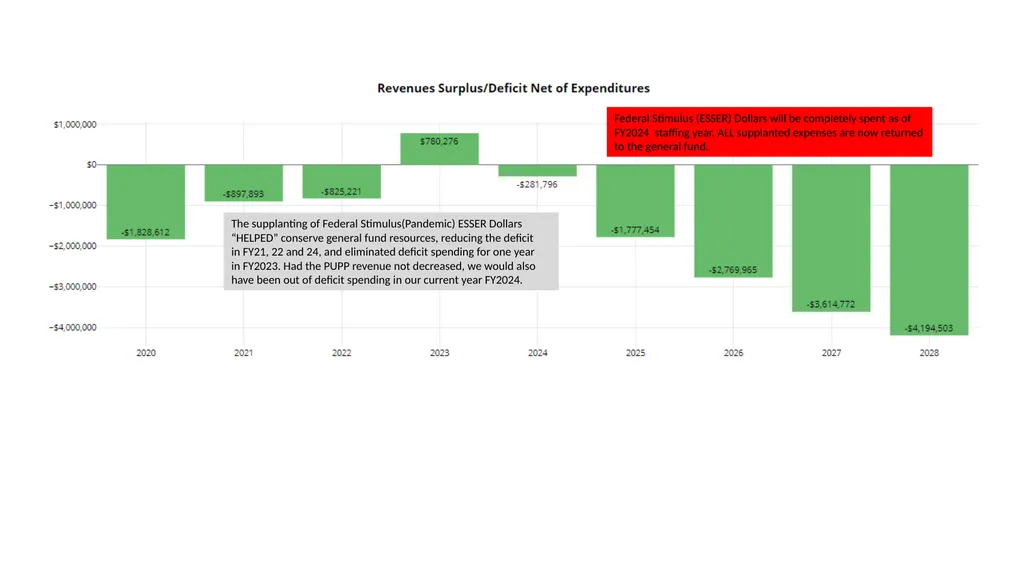
slide14. The supplanting of Federal Stimulus(Pandemic) ESSER Dollars
“HELPED” conserve general fund resources, reducing the deficit
in FY21, 22 and 24, and eliminated deficit spending for one year
in FY2023. Had the PUPP revenue not decreased, we would also
have been out of deficit spending in our current year FY2024. Federal Stimulus (ESSER) Dollars will be completely spent as of FY2024 staffing year. ALL supplanted expenses are now returned to the general fund.<br>
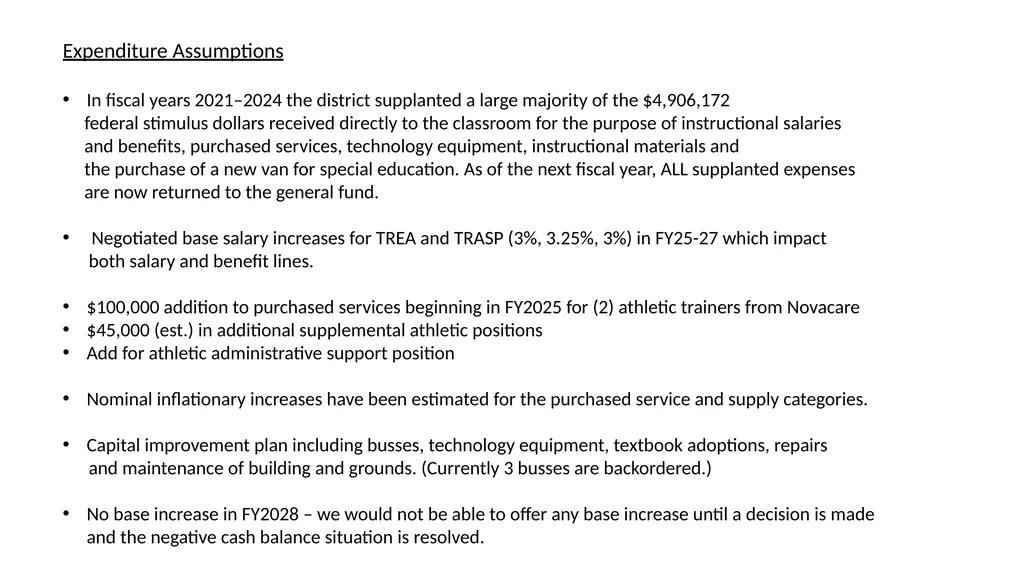
slide15. Expenditure Assumptions
In fiscal years 2021–2024 the district supplanted a large majority of the $4,906,172
federal stimulus dollars received directly to the classroom for the purpose of instructional salaries
and benefits, purchased services, technology equipment, instructional materials and
the purchase of a new van for special education. As of the next fiscal year, ALL supplanted expenses
are now returned to the general fund.
Negotiated base salary increases for TREA and TRASP (3%, 3.25%, 3%) in FY25-27 which impact
both salary and benefit lines.
$100,000 addition to purchased services beginning in FY2025 for (2) athletic trainers from Novacare
$45,000 (est.) in additional supplemental athletic positions
Add for athletic administrative support position
Nominal inflationary increases have been estimated for the purchased service and supply categories.
Capital improvement plan including busses, technology equipment, textbook adoptions, repairs
and maintenance of building and grounds. (Currently 3 busses are backordered.)
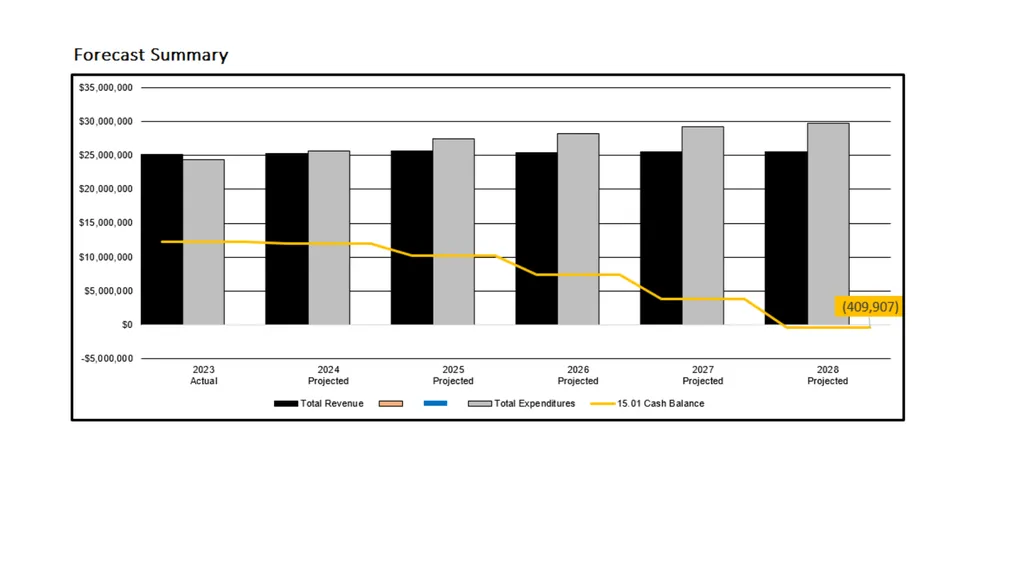
No base increase in FY2028 – we would not be able to offer any base increase until a decision is made and the negative cash balance situation is resolved.<br>
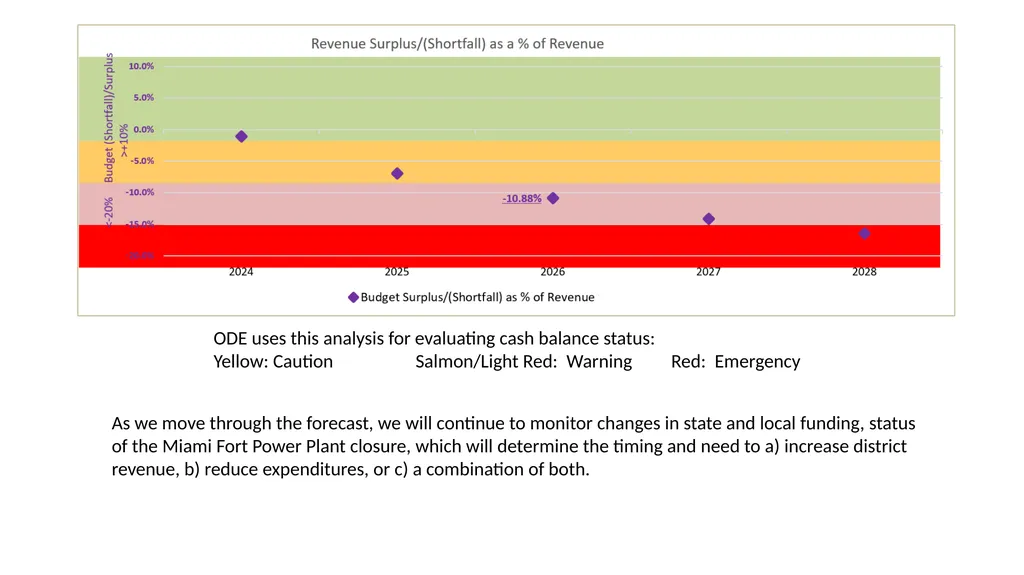
slide16. ODE uses this analysis for evaluating cash balance status:
Yellow: Caution Salmon/Light Red: Warning Red: Emergency As we move through the forecast, we will continue to monitor changes in state and local funding, status of the Miami Fort Power Plant closure, which will determine the timing and need to a) increase district revenue, b) reduce expenditures, or c) a combination of both.<br>
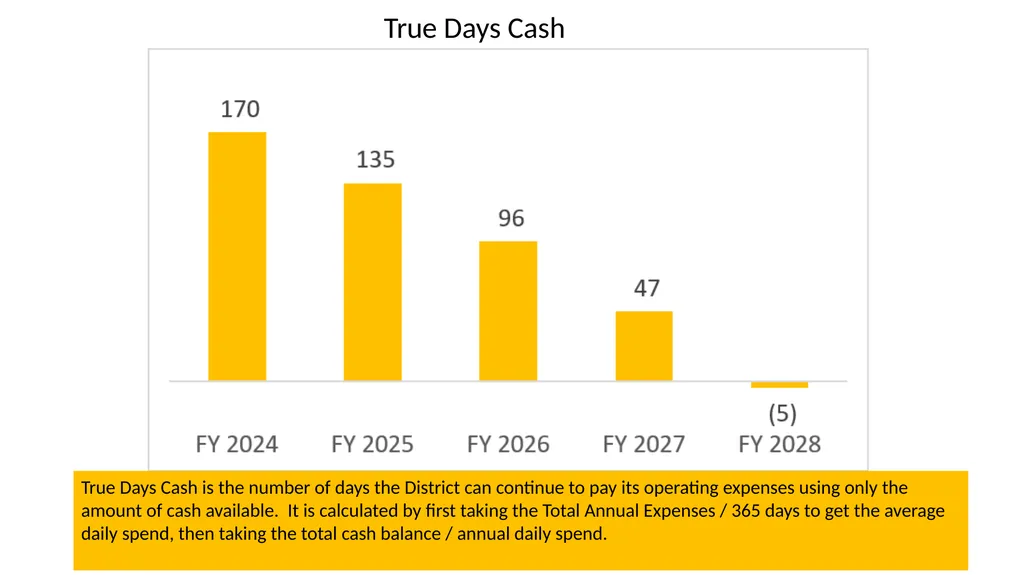
slide18. True Days Cash is the number of days the District can continue to pay its operating expenses using only the amount of cash available. It is calculated by first taking the Total Annual Expenses / 365 days to get the average daily spend, then taking the total cash balance / annual daily spend. True Days Cash<br>
Key Indicators & Analysis
Teri Riesenberg, Treasurer
May 28, 2024<br>
slide2. CURRENT FISCAL YEAR Financial Forecast Key Indicators & Analysis Three Rivers Local SD Current Fiscal Year Projected Financial Analysis @2023 Frontline Education<br>
slide3. CURRENT FISCAL YEAR Financial Forecast Key Indicators & Analysis Three Rivers Local SD Current Fiscal Year Projected Expenditure Analysis @2023 Frontline Education<br>
slide4. Total Revenue by Source Over Time<br>
slide5. General Property Tax remains fairly flat despite the 2023 Property Re-Appraisal. Total revenue increase to the district is only generated on the 3.4 inside mils and new construction. Total increase for fiscal year 2024 was a total of $43,158. There are no new levies being discussed or included in the forecast at this time. YTD interest from our investments totals $577,924 as of this presentation, which is an increase of $300,000 and will grow as we close the fiscal year.<br>
slide6. Due to the partial shut down of the Miami Fort Power Plant production during the previous year, PUPP revenues are down approximately $800,000. We do not anticipate that to occur again this year but will continue to closely monitor production and are aware that as the power plant nears permanent closure in FY2027, it is more likely than not that further shutdowns and reductions in revenue may occur.<br>
slide7. State Funding The Fair School Funding Plan was adopted in FY2022 and is driven by a base cost methodology
which is then broken down by local capacity/state share per pupil. The formula is a 6 year phase in funding students where they attend school eliminating open enrollment payments.
The large increases in FY2024 and FY2028 are estimated relief payments from the State of Ohio to offset the PUPP revenue loss due to the decrease in production and plant closure based on current law.<br>
slide8. State Funding Cont’d For Three Rivers Local School District, the calculated Base Cost total for FY2024 is $16,019,960 based on the average enrollment of 1,992* students. The current biennial budget (FY24-25) includes years 3(50%) and 4(66.67%). The forecast assumes the final biennial phase in will continue in year 5(83.33%) and year 6(100%). Base costs were also updated to FY22 data which will continue thru fiscal year 2025.
$16,019,960 / 1992* students = Base Cost per Pupil of $8,043.00
The local/state share breakdown is reflected in the lower left chart.
*Enrollment used for base cost calculation is the higher of the
three year average(district educated) for years 2021-2023 – OR –
2023, whichever is higher.
The base cost is estimated to increase to a total per pupil base cost
of $8,715 based on enrollment projections and full phase in.<br>
slide9. Summary Revenue Assumptions
Revenue remains fairly flat throughout the Forecast
We will continue to communicate with and monitor the Miami Fort Power Plant production closely to identify any loss of production. The Miami Fort Power Plant
remains scheduled for permanent closure no later than FY2027.
We will continue to monitor student enrollment projections and changes to estimate future state funding. The forecast assumes the FSFP phase in will continue through the next biennium.
The district is moving closer to the 20-mil floor as a result of the 2023 Real Estate Reappraisal. The district began the year at 28.15 and estimates to be at 21.20 at the end of the forecast.<br>
slide10. Purch’d Svc Purch’d Svc<br>
slide11. FORECAST Financial Forecast Key Indicators & Analysis Three Rivers Local SD Three Year Financial Outlook: Five Year Financial Outlook: @2023 Frontline Education<br>
slide12. FORECAST Financial Forecast Key Indicators & Analysis Three Rivers Local SD Average Annual Change in Key Revenue and Expenditure Assumptions @2023 Frontline Education<br>
slide14. The supplanting of Federal Stimulus(Pandemic) ESSER Dollars
“HELPED” conserve general fund resources, reducing the deficit
in FY21, 22 and 24, and eliminated deficit spending for one year
in FY2023. Had the PUPP revenue not decreased, we would also
have been out of deficit spending in our current year FY2024. Federal Stimulus (ESSER) Dollars will be completely spent as of FY2024 staffing year. ALL supplanted expenses are now returned to the general fund.<br>
slide15. Expenditure Assumptions
In fiscal years 2021–2024 the district supplanted a large majority of the $4,906,172
federal stimulus dollars received directly to the classroom for the purpose of instructional salaries
and benefits, purchased services, technology equipment, instructional materials and
the purchase of a new van for special education. As of the next fiscal year, ALL supplanted expenses
are now returned to the general fund.
Negotiated base salary increases for TREA and TRASP (3%, 3.25%, 3%) in FY25-27 which impact
both salary and benefit lines.
$100,000 addition to purchased services beginning in FY2025 for (2) athletic trainers from Novacare
$45,000 (est.) in additional supplemental athletic positions
Add for athletic administrative support position
Nominal inflationary increases have been estimated for the purchased service and supply categories.
Capital improvement plan including busses, technology equipment, textbook adoptions, repairs
and maintenance of building and grounds. (Currently 3 busses are backordered.)
No base increase in FY2028 – we would not be able to offer any base increase until a decision is made and the negative cash balance situation is resolved.<br>
slide16. ODE uses this analysis for evaluating cash balance status:
Yellow: Caution Salmon/Light Red: Warning Red: Emergency As we move through the forecast, we will continue to monitor changes in state and local funding, status of the Miami Fort Power Plant closure, which will determine the timing and need to a) increase district revenue, b) reduce expenditures, or c) a combination of both.<br>
slide18. True Days Cash is the number of days the District can continue to pay its operating expenses using only the amount of cash available. It is calculated by first taking the Total Annual Expenses / 365 days to get the average daily spend, then taking the total cash balance / annual daily spend. True Days Cash<br>