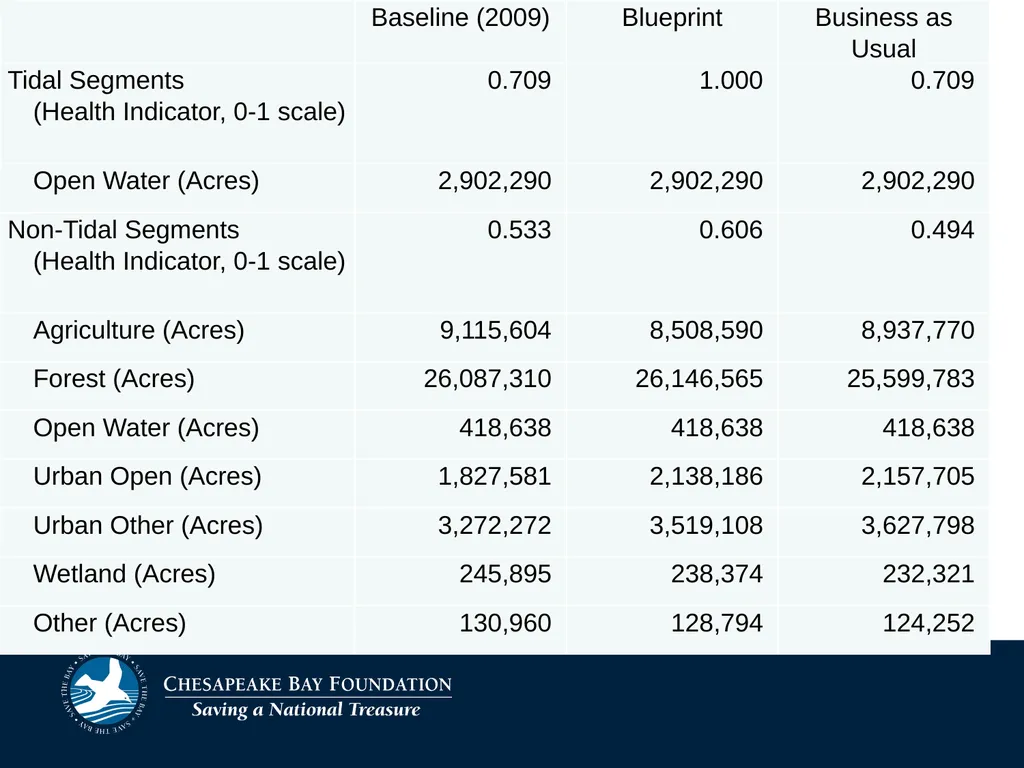
Title Text for Slide The regions environmental and economic health will improve when we fully implement the Blueprint. The cleanup plan was designed with the understanding that all people and communities in the watershed can contribute to
"Title Text for Slide “The region’s environmental" is the property of its rightful owner. Permission is granted to
download and print the materials on this website for personal, non-commercial use only, and to display it
on your personal computer provided you do not modify the materials and that you retain all copyright
notices contained in the materials. By downloading content from our website, you accept the terms of this
agreement.
Presentation Transcript
01
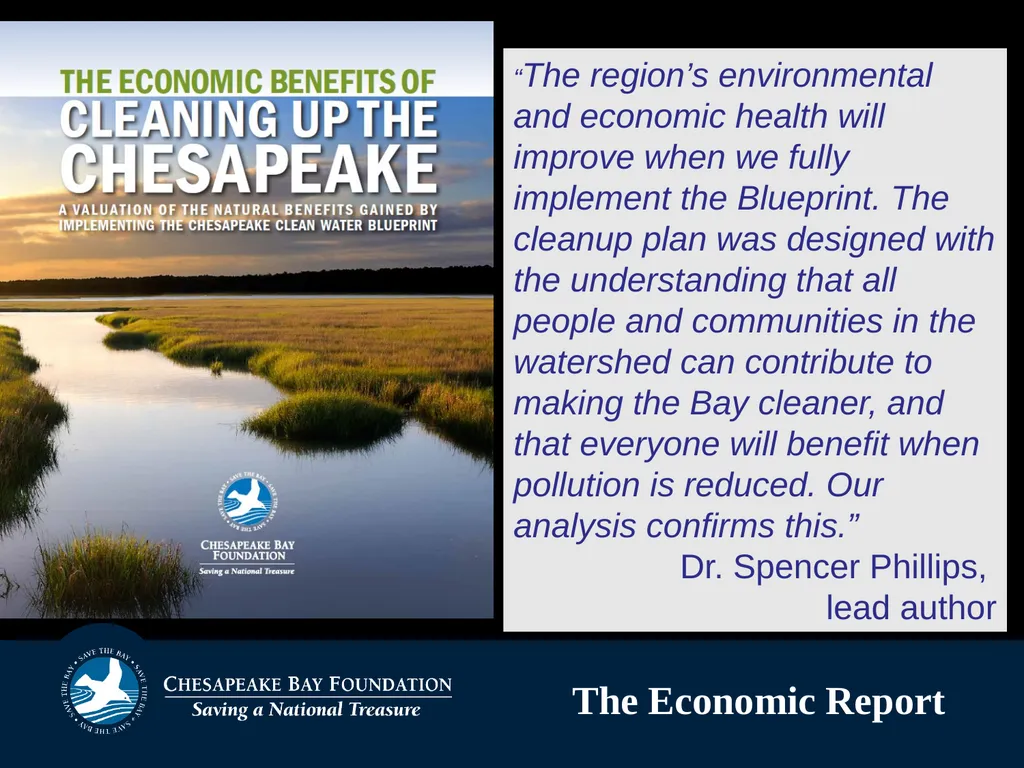
Title Text for Slide “The region’s environmental and economic health will improve when we fully implement the Blueprint. The cleanup plan was designed with the understanding that all people and communities in the watershed can contribute to making the Bay cleaner, and that everyone will benefit when pollution is reduced. Our analysis confirms this.”
Dr. Spencer Phillips,
lead author The Economic Report<br>
02
Outline What are ecosystem services?
What types of ecosystem services does the Bay and its watershed provide?
How will the Chesapeake Clean Water Blueprint affect them?
Study results<br>
03
“Ecosystem Services” Our lands, waters, and associated plants and animals provide natural benefits that economists call ecosystem services. These benefits include production of goods such as food and timber; life-supporting processes such as water and air purification and flood protection; and life-enhancing assets such as beautiful places to recreate and live.<br>
04
Three Scenarios The present-day dollar value of natural benefits for the watershed (based on 2009 pre-Blueprint)
The dollar value of the same services post-Blueprint
Estimate of what we lose if we don’t fully implement the Blueprint (“Business as usual”)<br>
05
We chose 8 natural benefits that are most likely to be affected by the Blueprint: Water Supply Water regulation Waste Treatment Climate Stability Food Production Air Pollution Trt Recreation Aesthetics Examples Reduced treatment facility costs, (less to filter) Improved soil health and yield (drought resistance), more fish and shellfish Reduced energy costs due to moderated urban temperatures Reduction in asthma cases and other public health benefits Increased property values Eco-tourism, fishing trips, hiking Reduced flood damage<br>
06
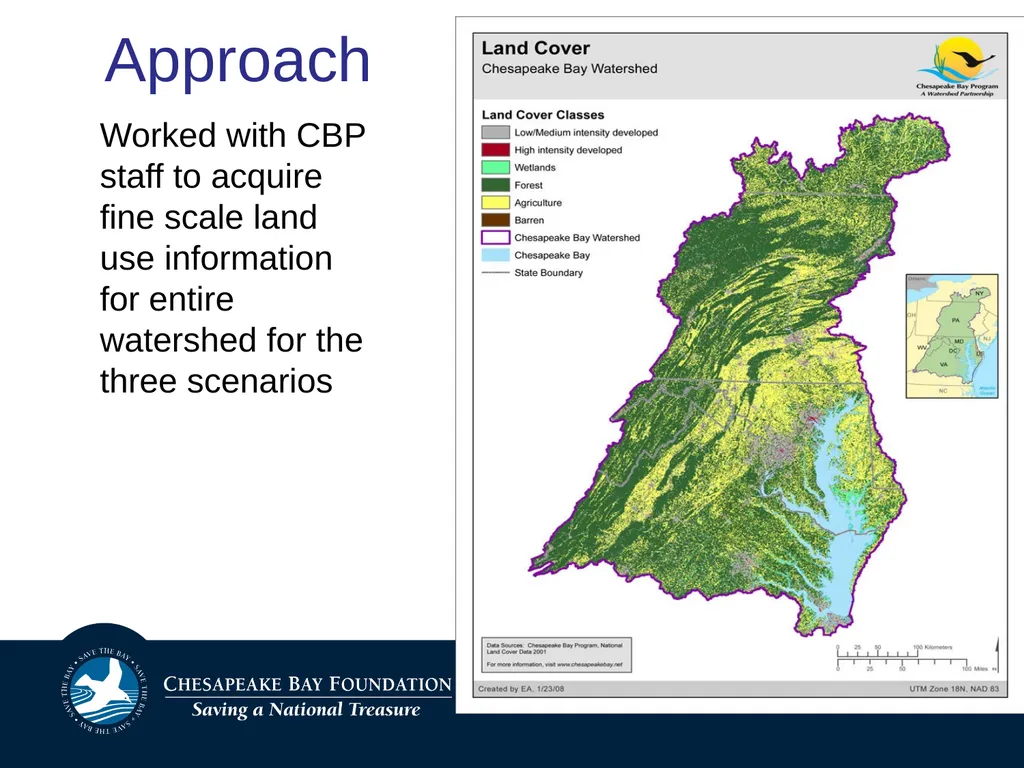
Approach Worked with CBP staff to acquire fine scale land use information for entire watershed for the three scenarios<br>
07
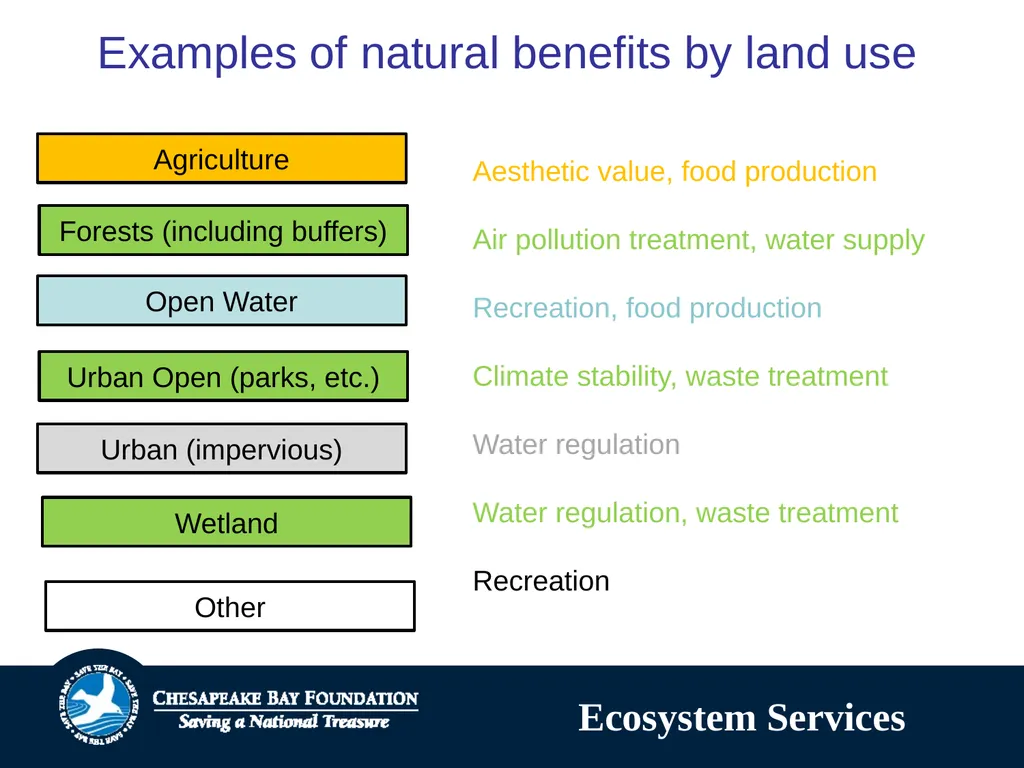
Examples of natural benefits by land use Ecosystem Services Agriculture Forests (including buffers) Open Water Wetland Urban (impervious) Other Urban Open (parks, etc.) Aesthetic value, food production
Air pollution treatment, water supply
Recreation, food production
Climate stability, waste treatment
Water regulation
Water regulation, waste treatment
Recreation<br>
08
Do these benefits have real value?<br>
09
Approach Implementation of Blueprint will have 2 primary effects:
Changes in acres of the various habitats e.g., increases in higher value habitats like forests
2. Improved condition of existing habitats and their services (e.g., increased Bay DO results in more food production, reduced nitrogen pollution means healthier wetlands that can better reduce flooding)<br>
10
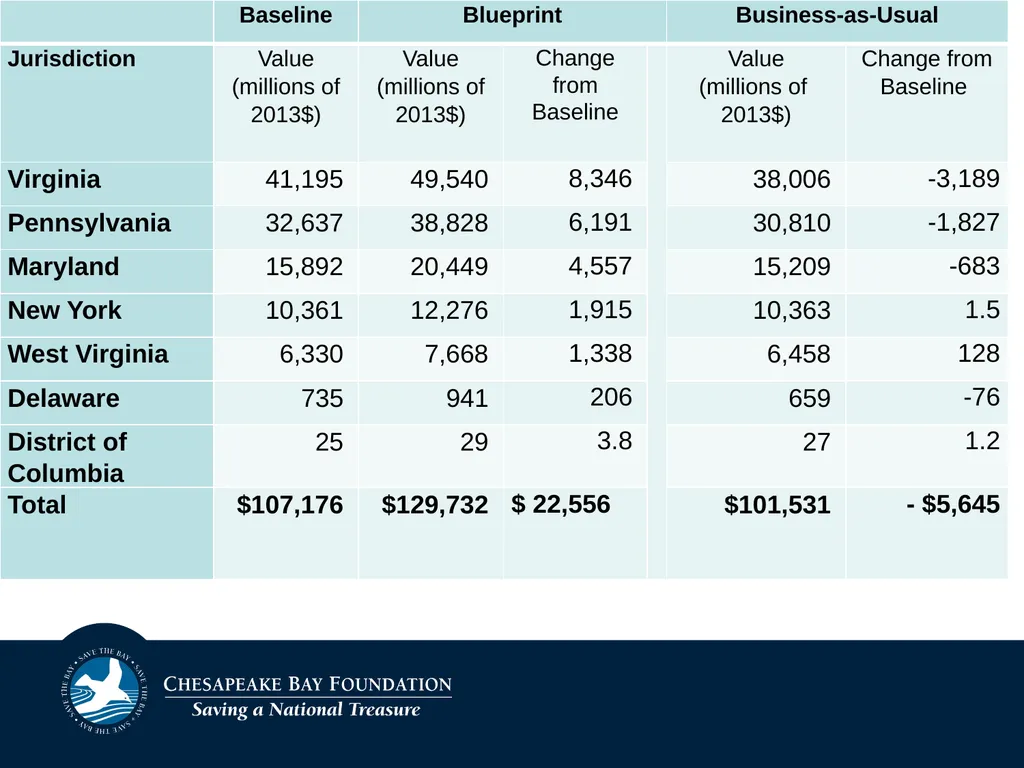
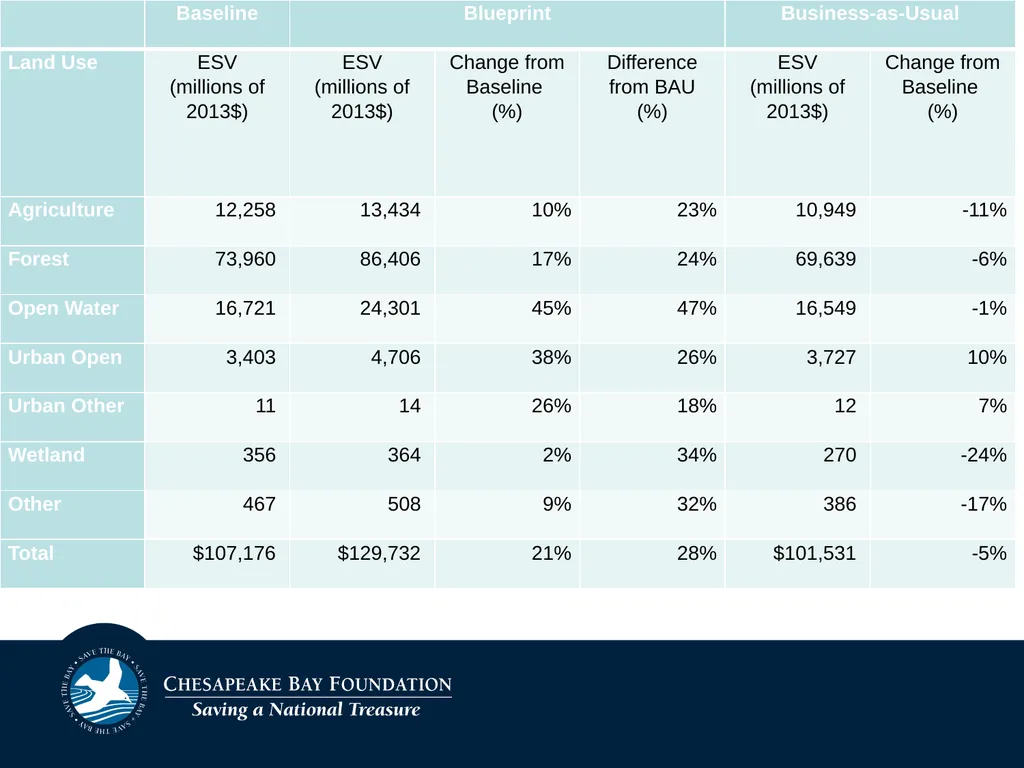
Present-day Benefits $107 billion annually –
spread across entire watershed<br>
11
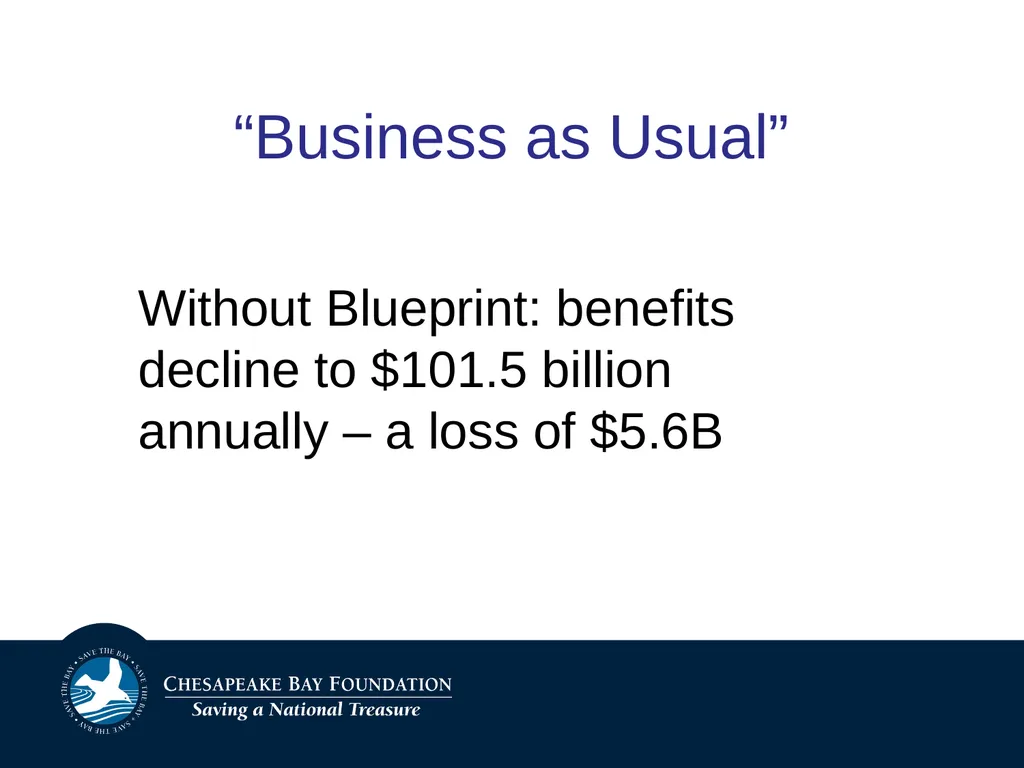
“Business as Usual” Without Blueprint: benefits decline to $101.5 billion annually – a loss of $5.6B<br>
12
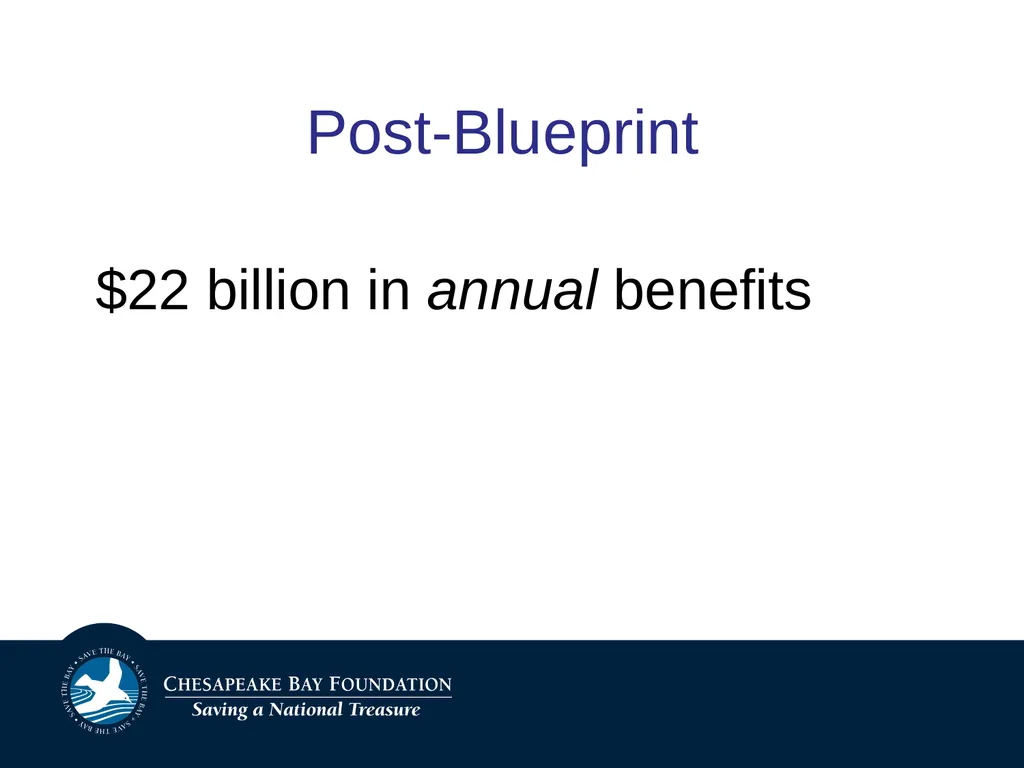
Post-Blueprint $22 billion in annual benefits<br>
13
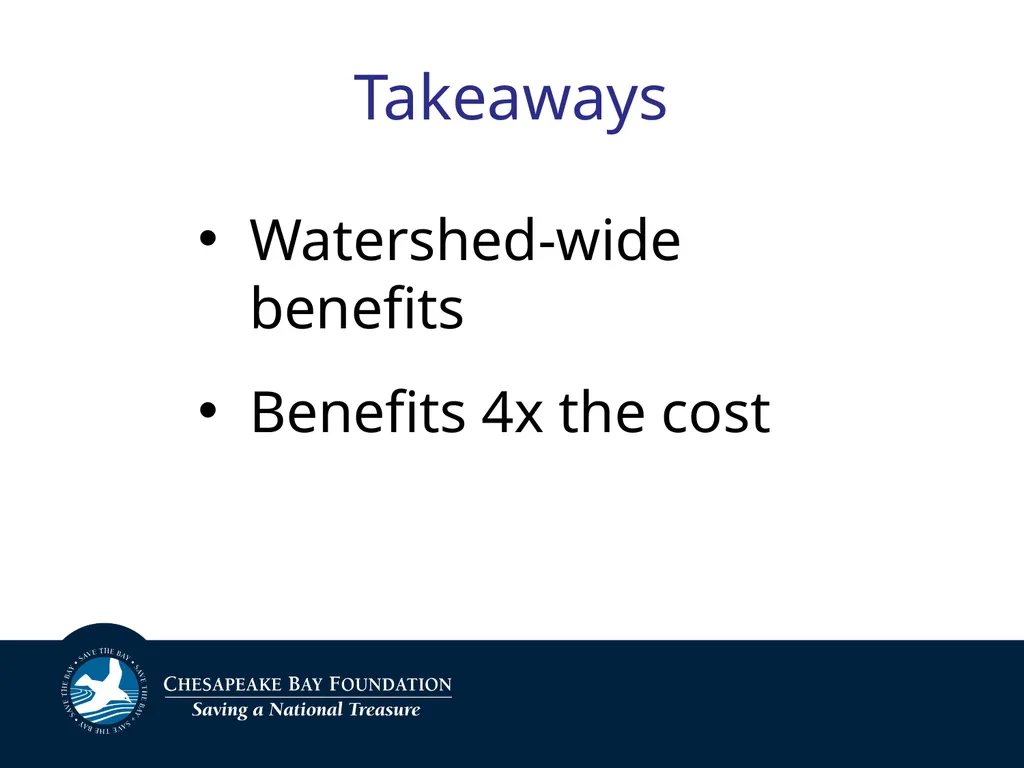
Takeaways Watershed-wide benefits
Benefits 4x the cost<br>
14
The End THANK YOU
QUESTIONS?<br>
15
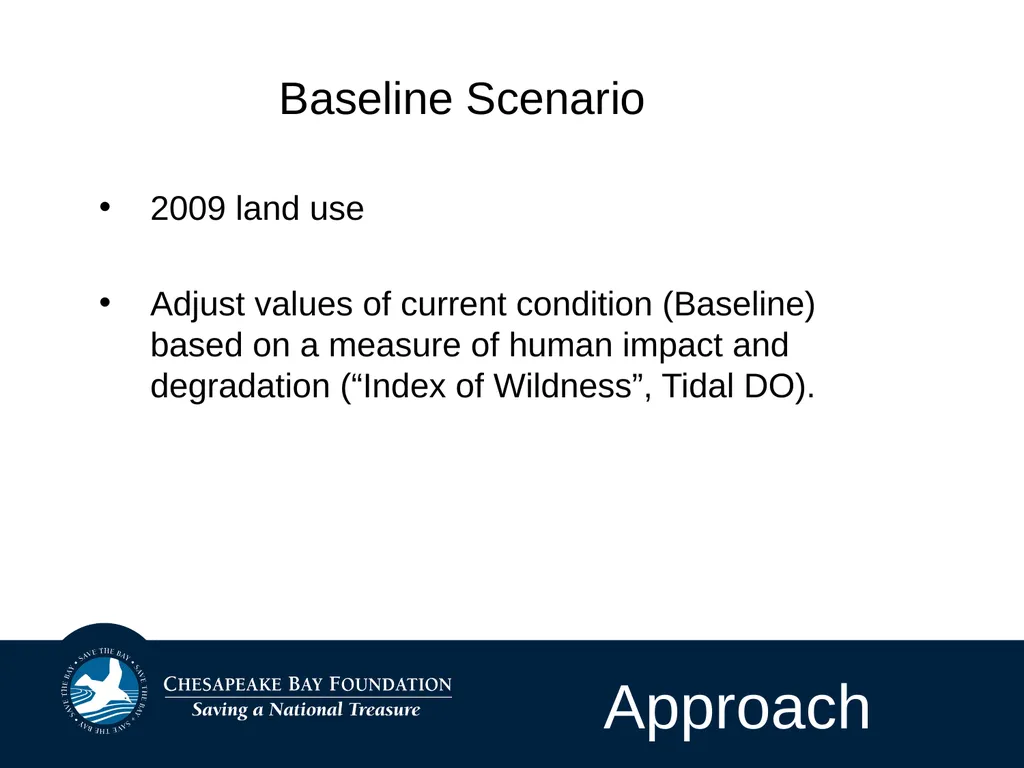
Approach Baseline Scenario
2009 land use
Adjust values of current condition (Baseline) based on a measure of human impact and degradation (“Index of Wildness”, Tidal DO).<br>
16
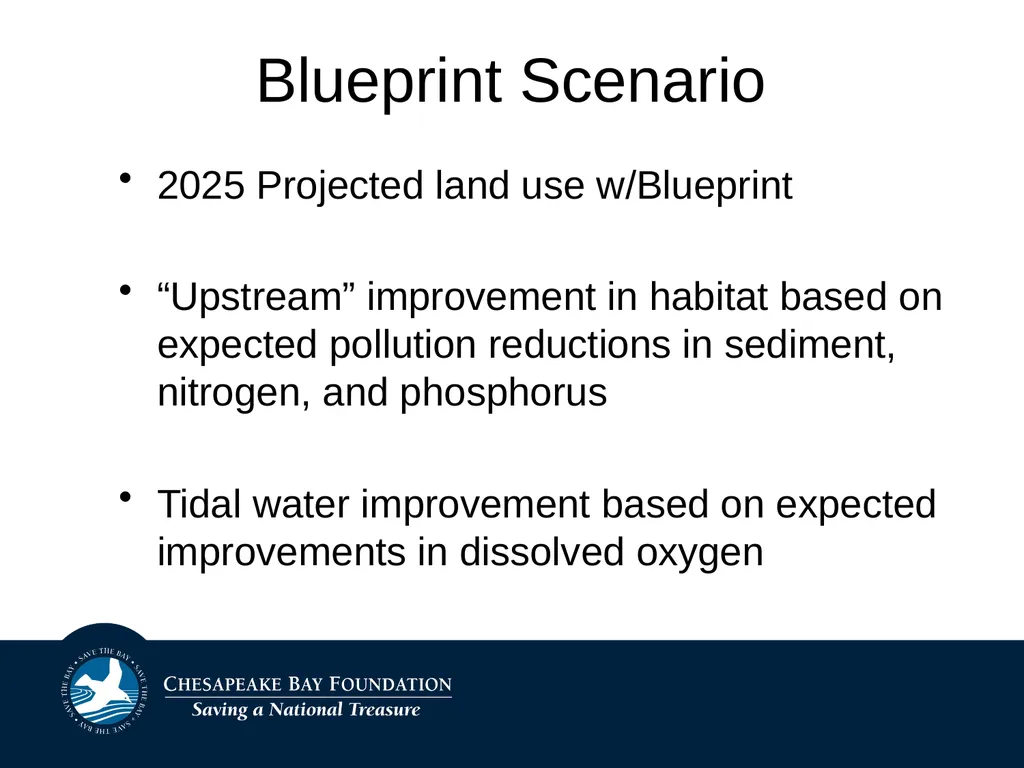
2025 Projected land use w/Blueprint
“Upstream” improvement in habitat based on expected pollution reductions in sediment, nitrogen, and phosphorus
Tidal water improvement based on expected improvements in dissolved oxygen Blueprint Scenario<br>
17
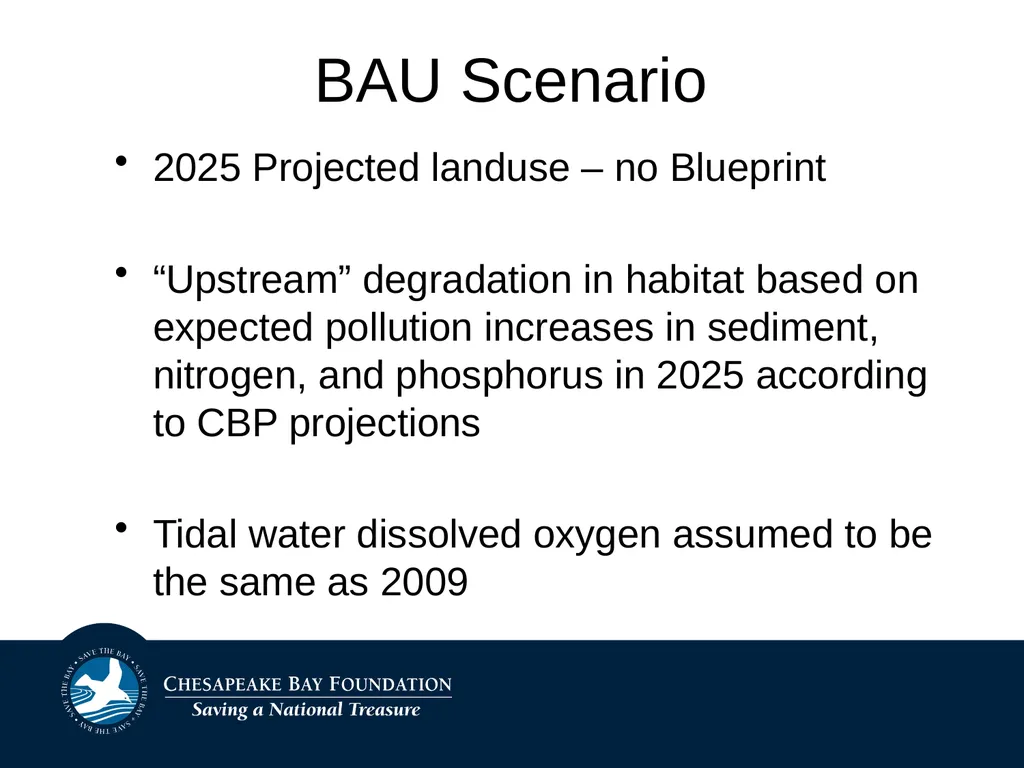
2025 Projected landuse – no Blueprint
“Upstream” degradation in habitat based on expected pollution increases in sediment, nitrogen, and phosphorus in 2025 according to CBP projections
Tidal water dissolved oxygen assumed to be the same as 2009 BAU Scenario<br>
18
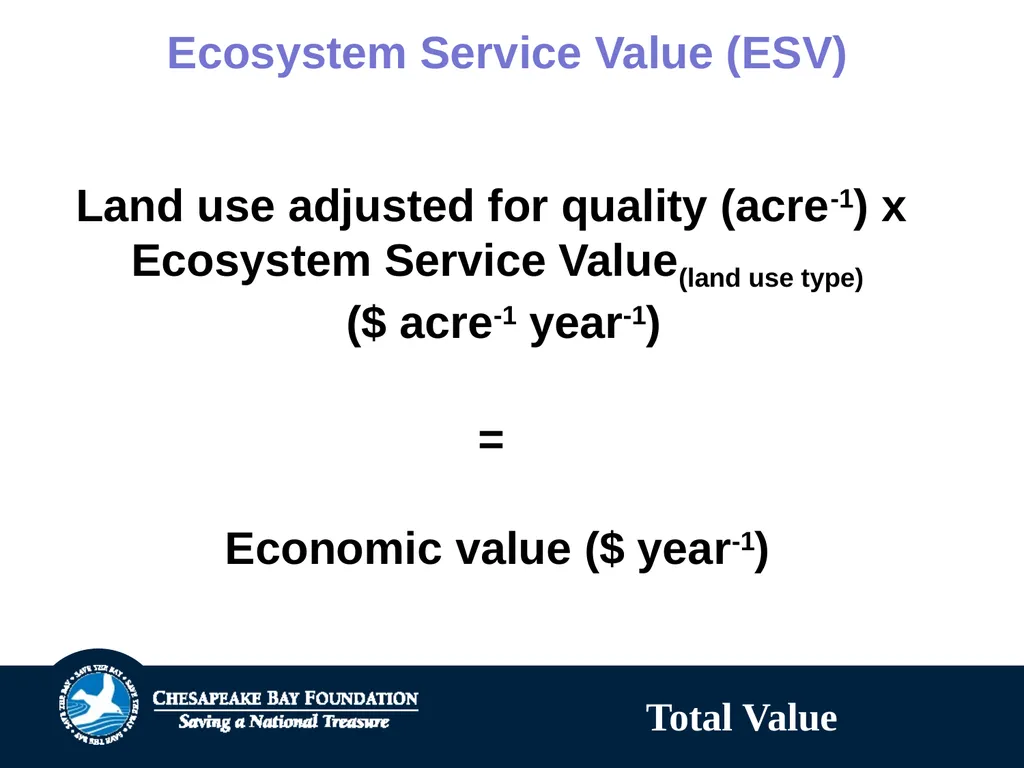
Ecosystem Service Value (ESV) Total Value Land use adjusted for quality (acre-1) x
Ecosystem Service Value(land use type)
($ acre-1 year-1)