
Topics in Clinical Trials (2) - 2012 J. Jack Lee,
YM
Published · 39 slides · 0 views

1 / 1

Description
Topics in Clinical Trials (2) - 2012 J. Jack Lee, Ph.D. Department of Biostatistics University of Texas M. D. Anderson Cancer Center 1: Study Population Definition of study population What is population of interest? Generalization,
Related Topics
Share
Embed code
Download this presentation From Below
"Topics in Clinical Trials (2) - 2012 J. Jack Lee," is the property of its rightful owner. Permission is granted to download and print the materials on this website for personal, non-commercial use only, and to display it on your personal computer provided you do not modify the materials and that you retain all copyright notices contained in the materials. By downloading content from our website, you accept the terms of this agreement.
Presentation Transcript
01
Topics in Clinical Trials (2) - 2012 J. Jack Lee, Ph.D.
Department of Biostatistics
University of Texas
M. D. Anderson Cancer Center<br>
Department of Biostatistics
University of Texas
M. D. Anderson Cancer Center<br>
02
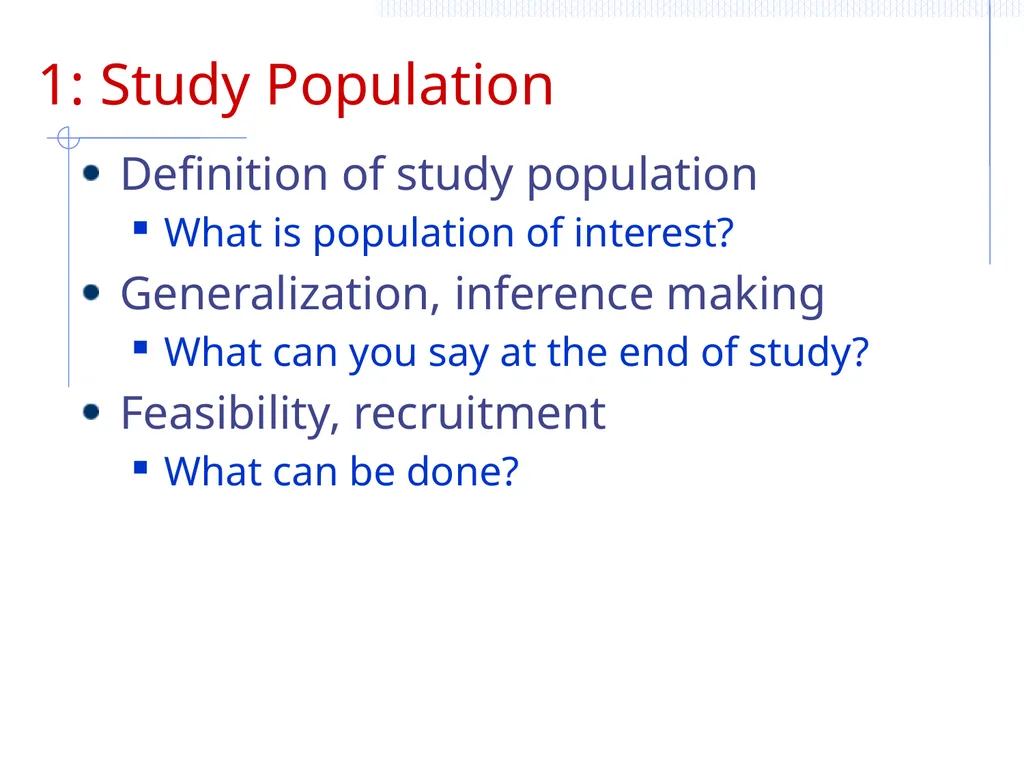
1: Study Population Definition of study population
What is population of interest?
Generalization, inference making
What can you say at the end of study?
Feasibility, recruitment
What can be done?<br>
What is population of interest?
Generalization, inference making
What can you say at the end of study?
Feasibility, recruitment
What can be done?<br>
03
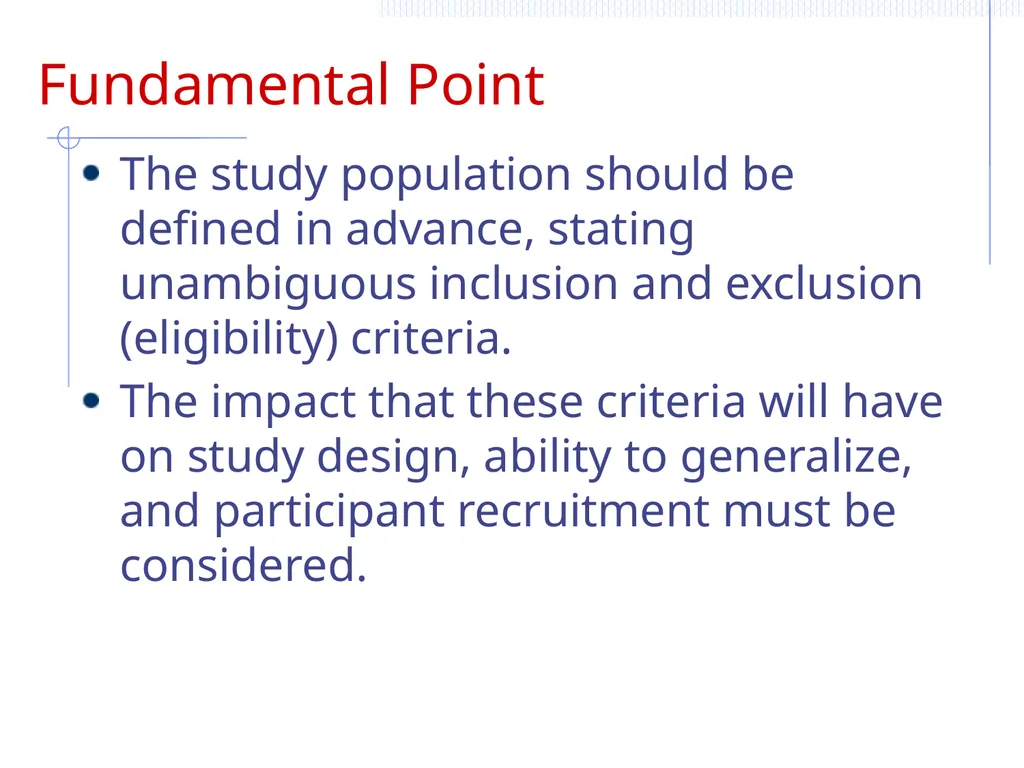
Fundamental Point The study population should be defined in advance, stating unambiguous inclusion and exclusion (eligibility) criteria.
The impact that these criteria will have on study design, ability to generalize, and participant recruitment must be considered.<br>
The impact that these criteria will have on study design, ability to generalize, and participant recruitment must be considered.<br>
04
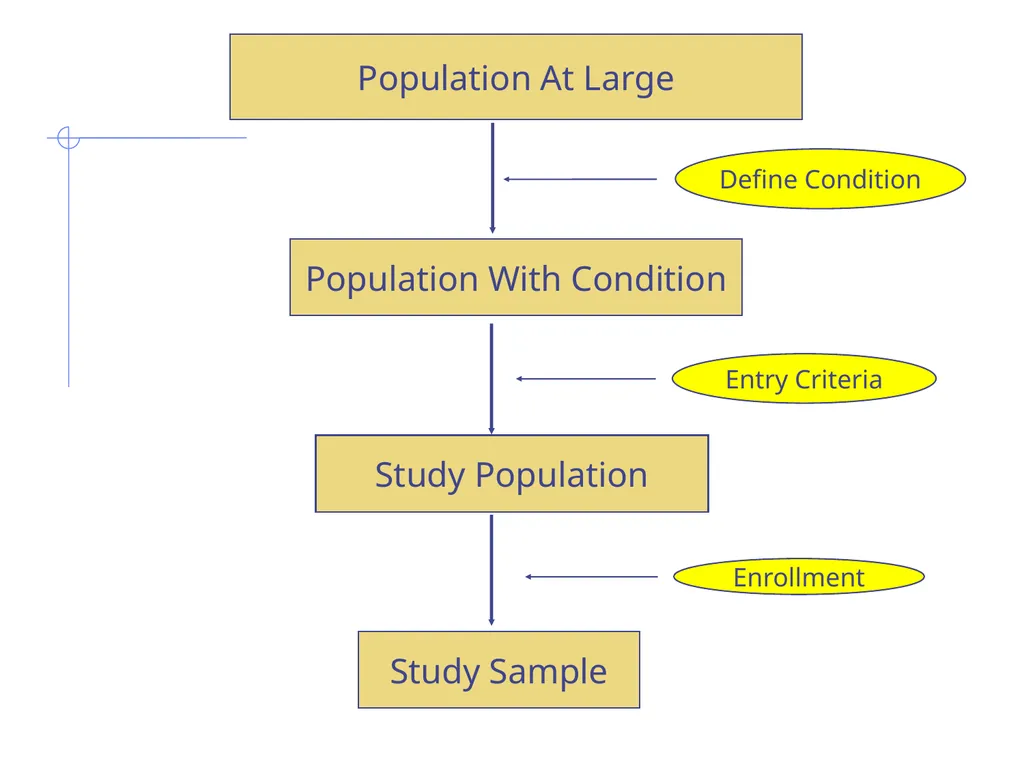
Population At Large Population With Condition Study Population Study Sample<br>
05
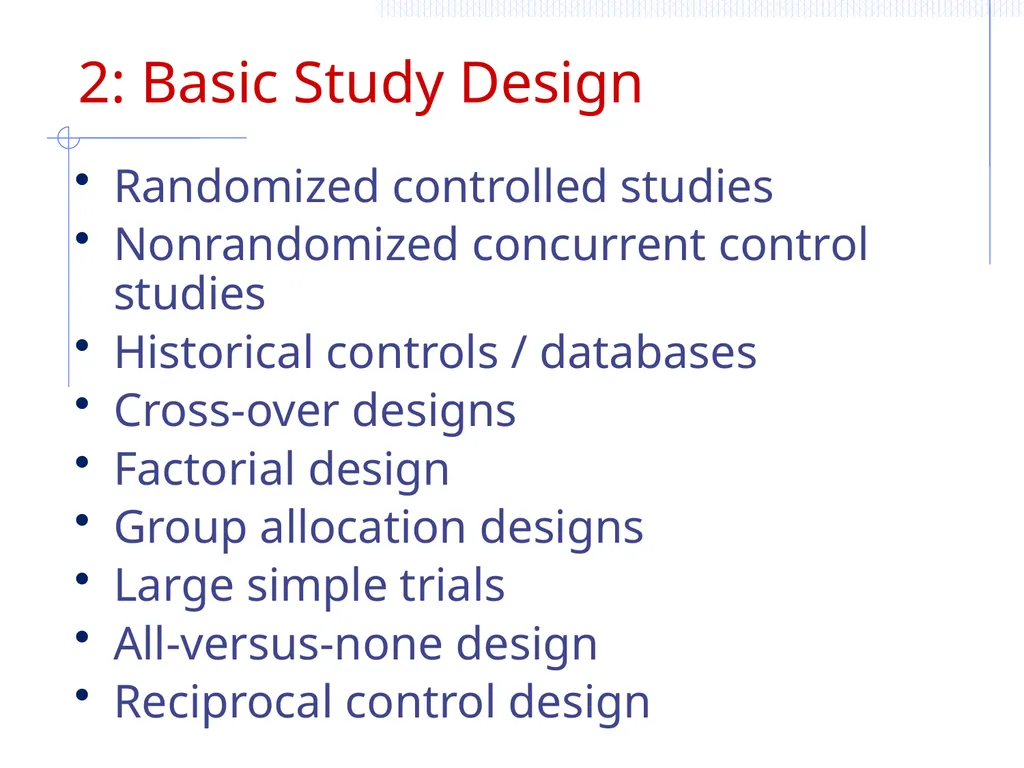
2: Basic Study Design Randomized controlled studies
Nonrandomized concurrent control studies
Historical controls / databases
Cross-over designs
Factorial design
Group allocation designs
Large simple trials
All-versus-none design
Reciprocal control design<br>
Nonrandomized concurrent control studies
Historical controls / databases
Cross-over designs
Factorial design
Group allocation designs
Large simple trials
All-versus-none design
Reciprocal control design<br>
06
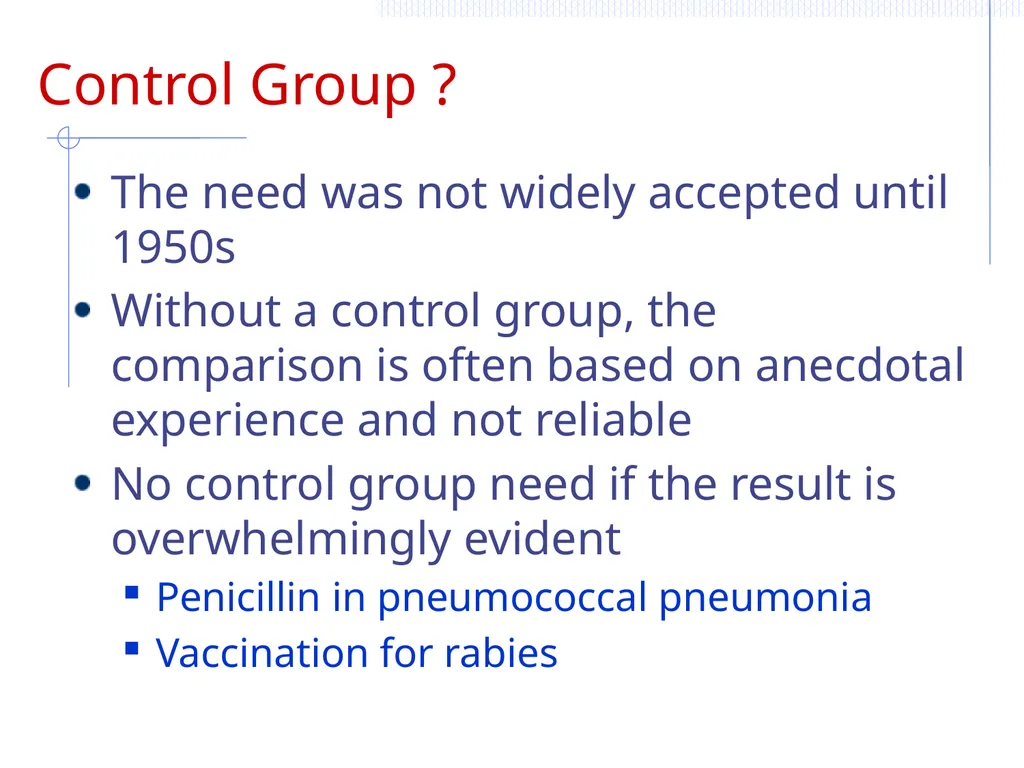
Control Group ? The need was not widely accepted until 1950s
Without a control group, the comparison is often based on anecdotal experience and not reliable
No control group need if the result is overwhelmingly evident
Penicillin in pneumococcal pneumonia
Vaccination for rabies<br>
Without a control group, the comparison is often based on anecdotal experience and not reliable
No control group need if the result is overwhelmingly evident
Penicillin in pneumococcal pneumonia
Vaccination for rabies<br>
07
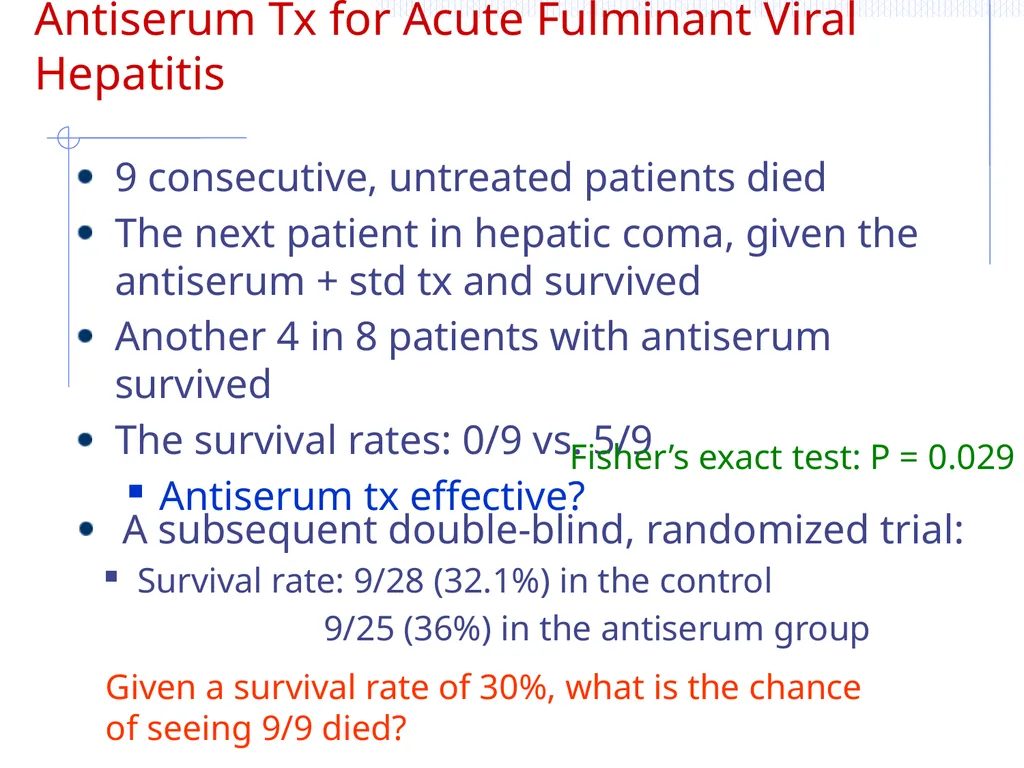
Antiserum Tx for Acute Fulminant Viral Hepatitis 9 consecutive, untreated patients died
The next patient in hepatic coma, given the antiserum + std tx and survived
Another 4 in 8 patients with antiserum survived
The survival rates: 0/9 vs. 5/9
Antiserum tx effective? Fisher’s exact test: P = 0.029 A subsequent double-blind, randomized trial:
Survival rate: 9/28 (32.1%) in the control
9/25 (36%) in the antiserum group Given a survival rate of 30%, what is the chance of seeing 9/9 died?<br>
08
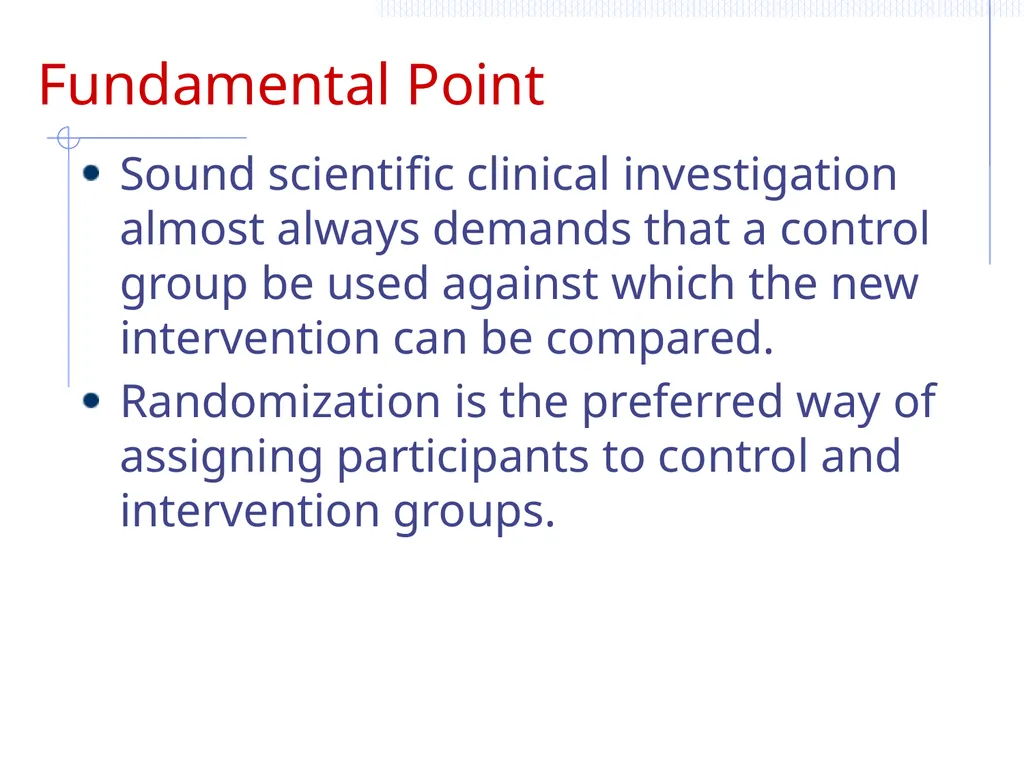
Fundamental Point Sound scientific clinical investigation almost always demands that a control group be used against which the new intervention can be compared.
Randomization is the preferred way of assigning participants to control and intervention groups.<br>
Randomization is the preferred way of assigning participants to control and intervention groups.<br>
09
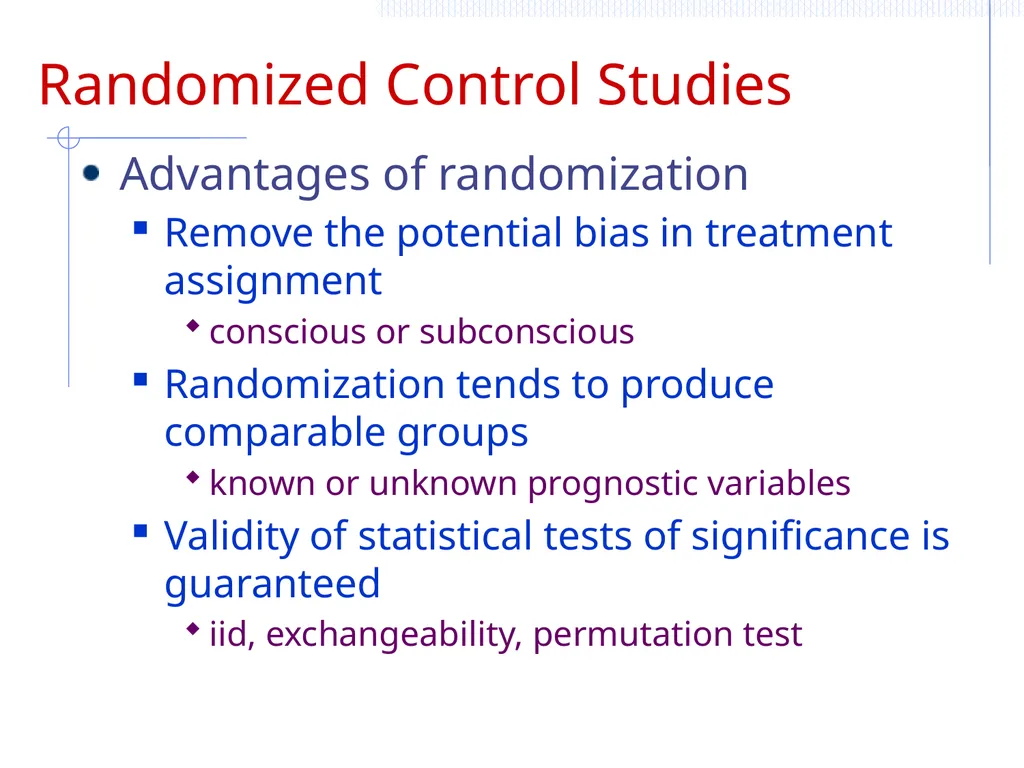
Randomized Control Studies Advantages of randomization
Remove the potential bias in treatment assignment
conscious or subconscious
Randomization tends to produce comparable groups
known or unknown prognostic variables
Validity of statistical tests of significance is guaranteed
iid, exchangeability, permutation test<br>
Remove the potential bias in treatment assignment
conscious or subconscious
Randomization tends to produce comparable groups
known or unknown prognostic variables
Validity of statistical tests of significance is guaranteed
iid, exchangeability, permutation test<br>
10
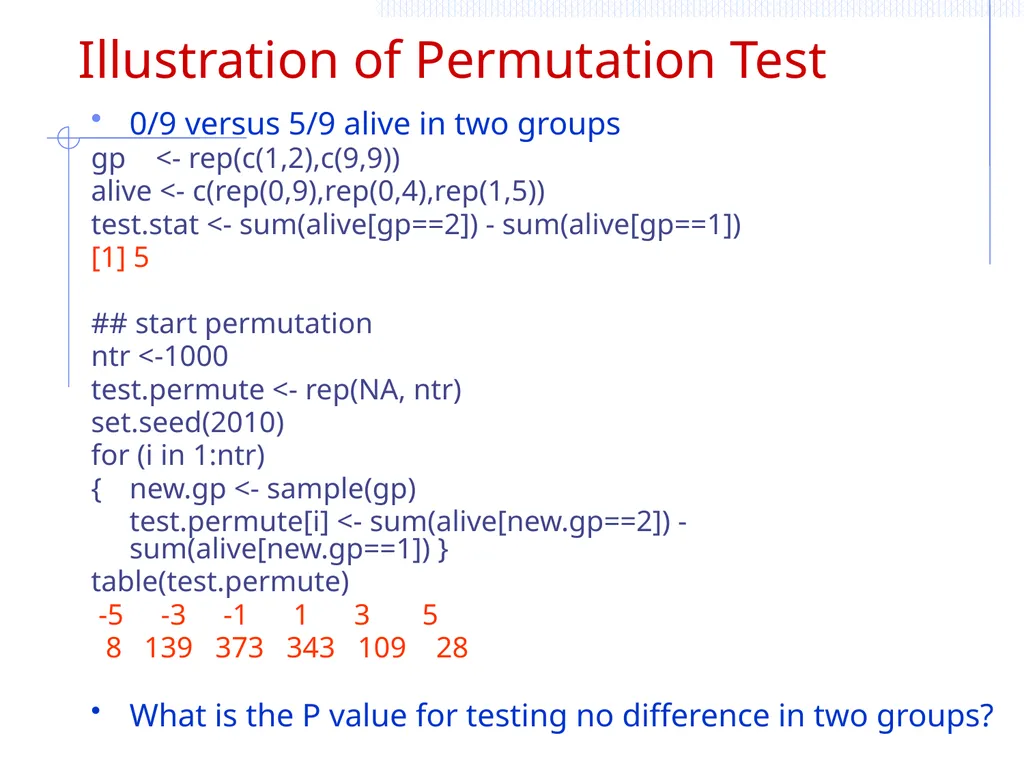
Illustration of Permutation Test 0/9 versus 5/9 alive in two groups
gp <- rep(c(1,2),c(9,9))
alive <- c(rep(0,9),rep(0,4),rep(1,5))
test.stat <- sum(alive[gp==2]) - sum(alive[gp==1])
[1] 5
## start permutation
ntr <-1000
test.permute <- rep(NA, ntr)
set.seed(2010)
for (i in 1:ntr)
{ new.gp <- sample(gp)
test.permute[i] <- sum(alive[new.gp==2]) - sum(alive[new.gp==1]) }
table(test.permute)
-5 -3 -1 1 3 5
8 139 373 343 109 28
What is the P value for testing no difference in two groups?<br>
11
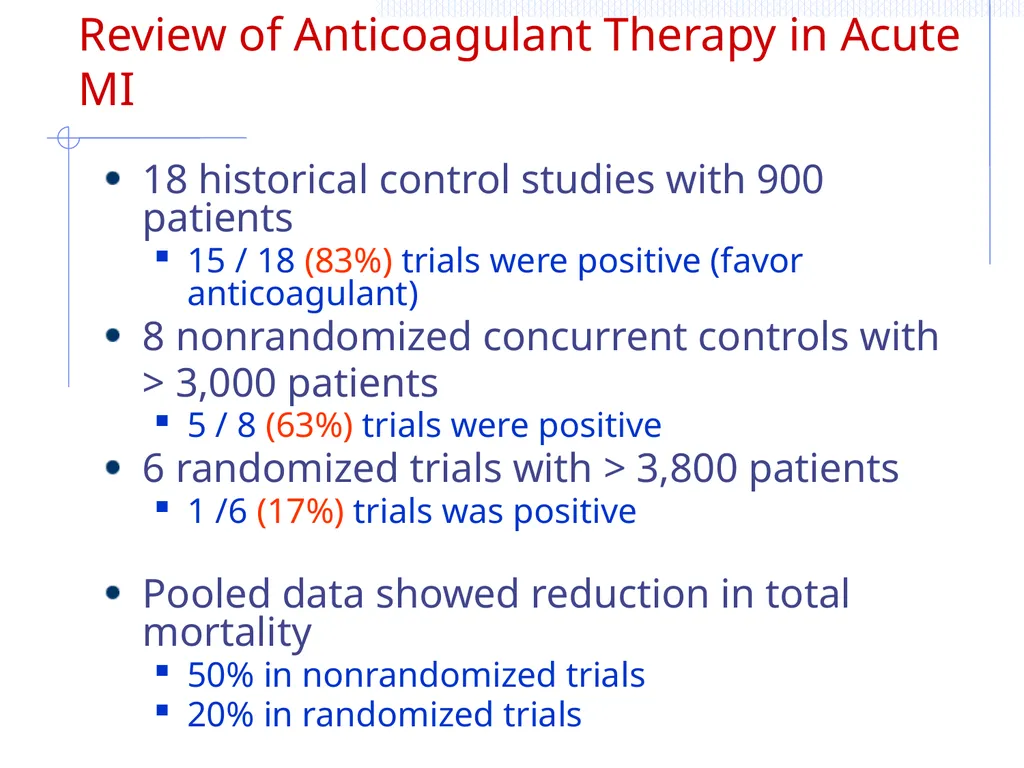
Review of Anticoagulant Therapy in Acute MI 18 historical control studies with 900 patients
15 / 18 (83%) trials were positive (favor anticoagulant)
8 nonrandomized concurrent controls with
> 3,000 patients
5 / 8 (63%) trials were positive
6 randomized trials with > 3,800 patients
1 /6 (17%) trials was positive
Pooled data showed reduction in total mortality
50% in nonrandomized trials
20% in randomized trials<br>
12
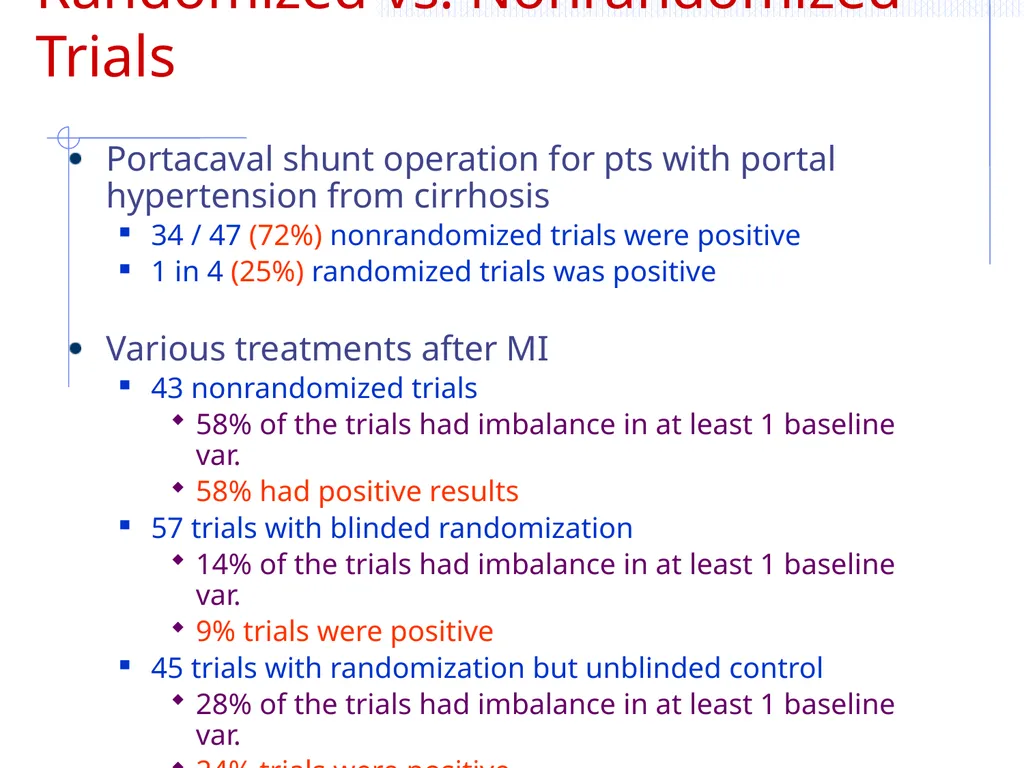
Randomized vs. Nonrandomized Trials Portacaval shunt operation for pts with portal hypertension from cirrhosis
34 / 47 (72%) nonrandomized trials were positive
1 in 4 (25%) randomized trials was positive
Various treatments after MI
43 nonrandomized trials
58% of the trials had imbalance in at least 1 baseline var.
58% had positive results
57 trials with blinded randomization
14% of the trials had imbalance in at least 1 baseline var.
9% trials were positive
45 trials with randomization but unblinded control
28% of the trials had imbalance in at least 1 baseline var.
24% trials were positive<br>
13
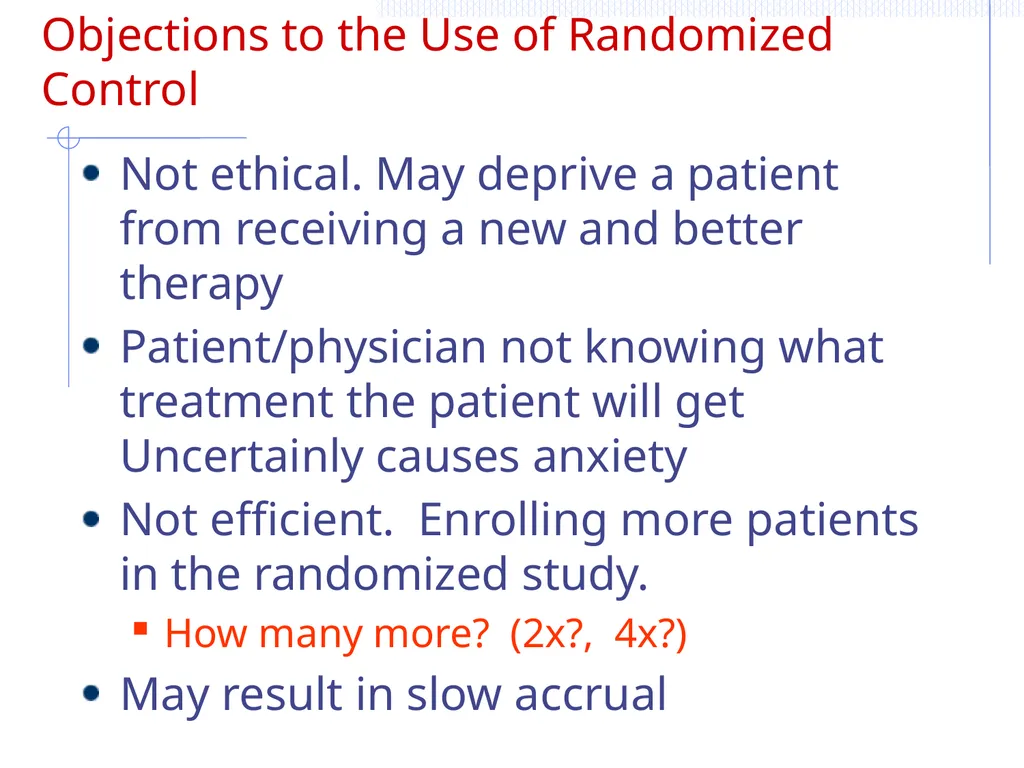
Objections to the Use of Randomized Control Not ethical. May deprive a patient from receiving a new and better therapy
Patient/physician not knowing what treatment the patient will get Uncertainly causes anxiety
Not efficient. Enrolling more patients in the randomized study.
How many more? (2x?, 4x?)
May result in slow accrual<br>
Patient/physician not knowing what treatment the patient will get Uncertainly causes anxiety
Not efficient. Enrolling more patients in the randomized study.
How many more? (2x?, 4x?)
May result in slow accrual<br>
14
Case-Control Study Widely used in epidemiology studies
Study the association between exposure and disease, e.g.: smoking and lung cancer
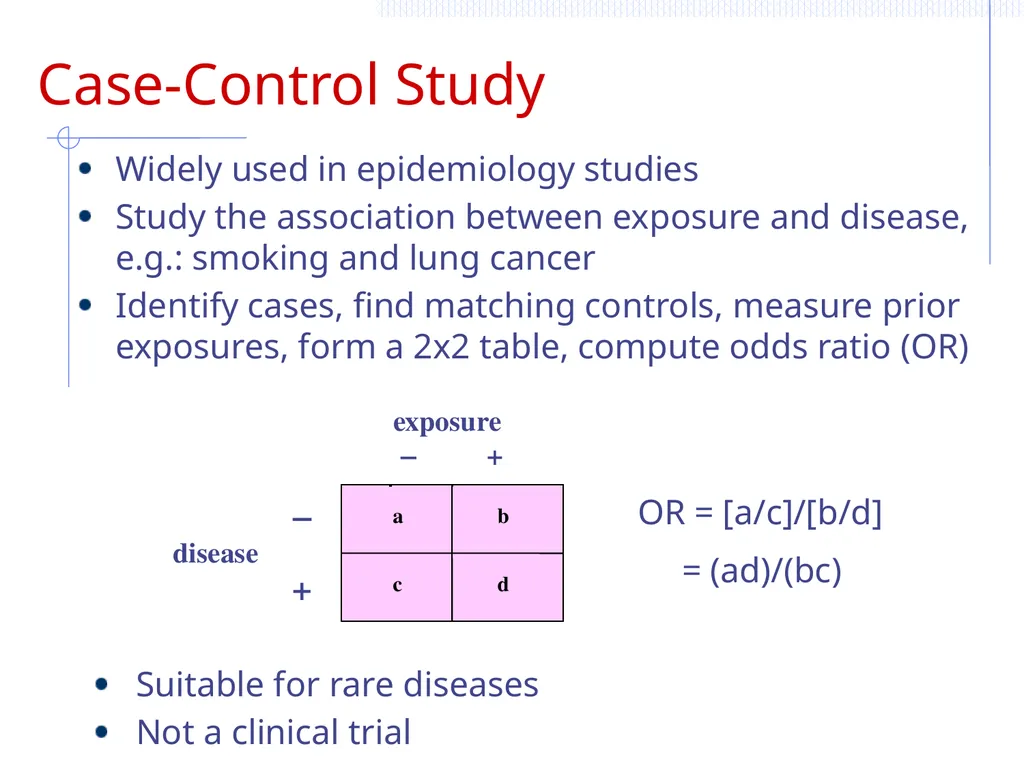
Identify cases, find matching controls, measure prior exposures, form a 2x2 table, compute odds ratio (OR) Suitable for rare diseases
Not a clinical trial OR = [a/c]/[b/d]
= (ad)/(bc)<br>
Study the association between exposure and disease, e.g.: smoking and lung cancer
Identify cases, find matching controls, measure prior exposures, form a 2x2 table, compute odds ratio (OR) Suitable for rare diseases
Not a clinical trial OR = [a/c]/[b/d]
= (ad)/(bc)<br>
15
Nonrandomized Concurrent Control Studies E.g.: compare survival between 2 institutions using 2 surgical procedures
Advantage: no randomization needed: surgeons use familiar procedure perceived as the best; pts know what to get. Simple, reduce the cost
Disadvantage: intervention and control groups are not strictly comparable
When there is a difference, how to attribute the difference? To
Surgical procedures?
Institution factors?
Different patient populations?<br>
16
Historical Controls / Databases No participants should be deprived of the chance to receive new therapy
More efficient, less N, shorter time to complete, more economical
Disadvantage:
Prone to selection bias
Prone to evaluation bias
Prone to time trend difference (e.g. decrease trend in heart disease, stage shift)
When computerized databases are well constructed, HC may be less prone to bias if the control groups are properly chosen.<br>
17
Cross-over Designs Two-period cross-over design: Participants are randomized to receive
A – washout period – B
B – washout period – A
Advantage:
More efficient, pt serves as own control
(2.4 times savings in 59 trials)
Everyone receives both tx
Based on the assumptions
No carry over effect
No drug interaction
No period effect (time effect)
Pt returned to the same baseline status after the first intervention
No treatment-period interaction<br>
18
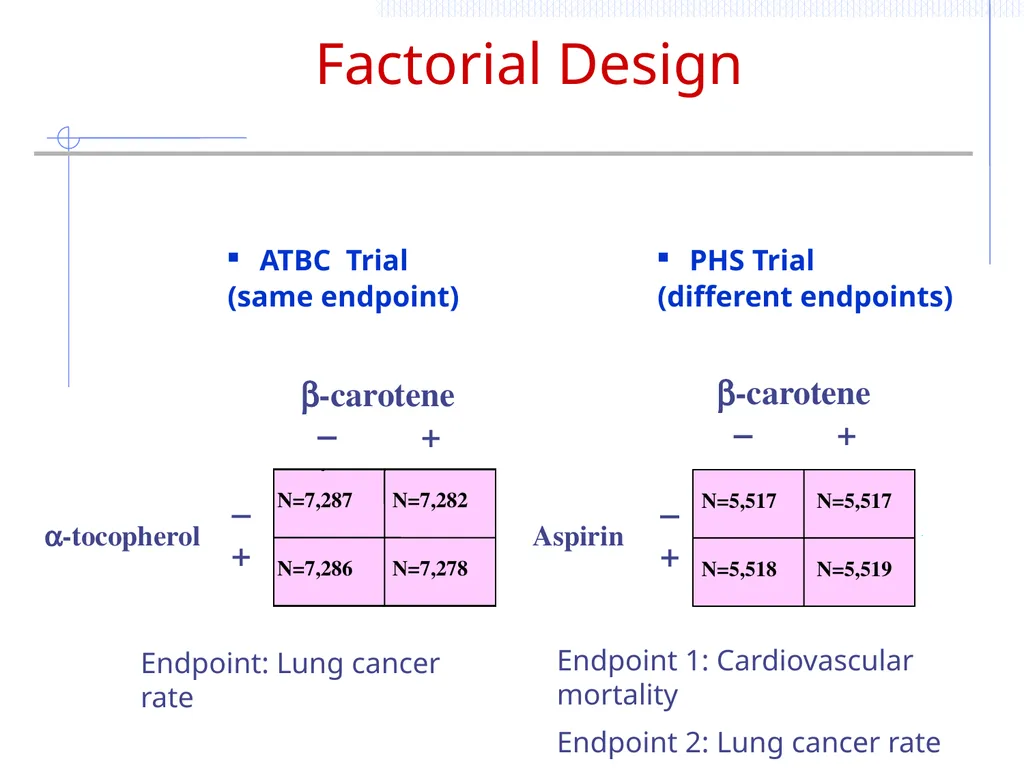
Factorial Design ATBC Trial
(same endpoint) PHS Trial
(different endpoints) Endpoint: Lung cancer rate Endpoint 1: Cardiovascular mortality
Endpoint 2: Lung cancer rate<br>
(same endpoint) PHS Trial
(different endpoints) Endpoint: Lung cancer rate Endpoint 1: Cardiovascular mortality
Endpoint 2: Lung cancer rate<br>
19
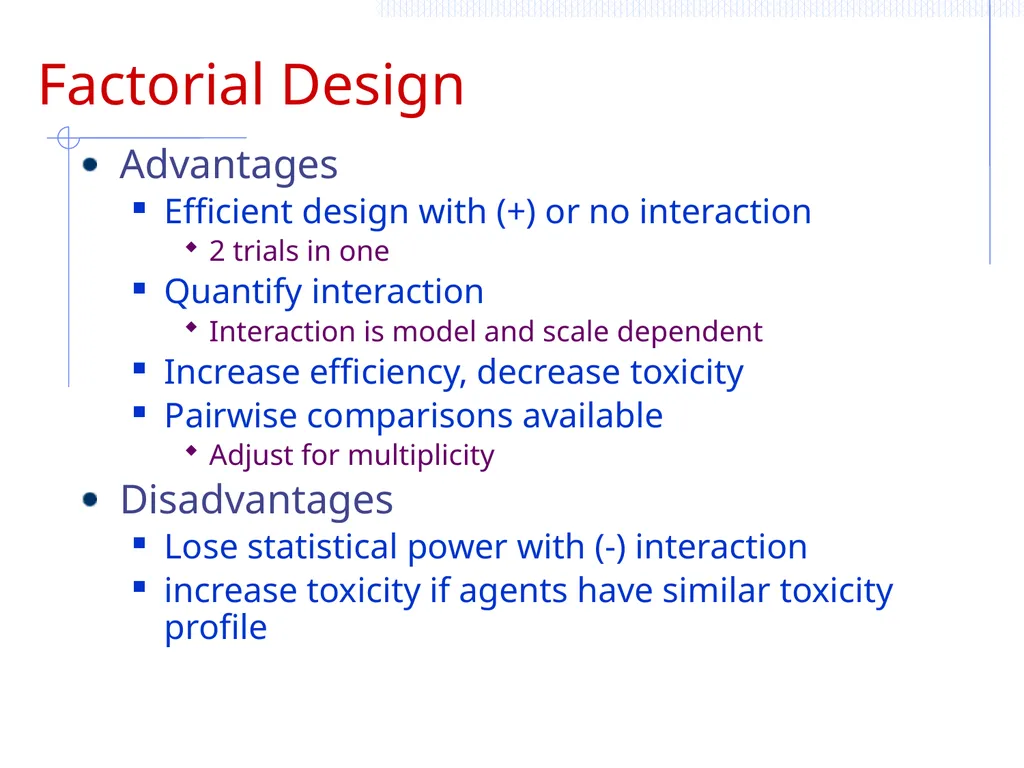
Factorial Design Advantages
Efficient design with (+) or no interaction
2 trials in one
Quantify interaction
Interaction is model and scale dependent
Increase efficiency, decrease toxicity
Pairwise comparisons available
Adjust for multiplicity
Disadvantages
Lose statistical power with (-) interaction
increase toxicity if agents have similar toxicity profile<br>
20
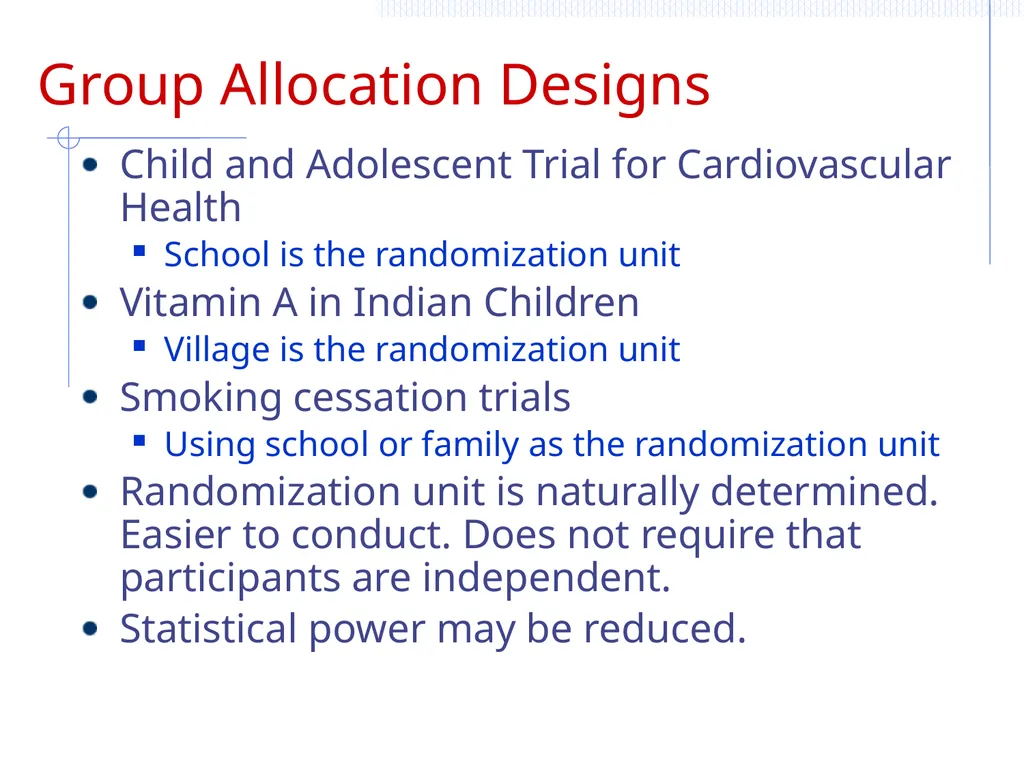
Group Allocation Designs Child and Adolescent Trial for Cardiovascular Health
School is the randomization unit
Vitamin A in Indian Children
Village is the randomization unit
Smoking cessation trials
Using school or family as the randomization unit
Randomization unit is naturally determined. Easier to conduct. Does not require that participants are independent.
Statistical power may be reduced.<br>
21
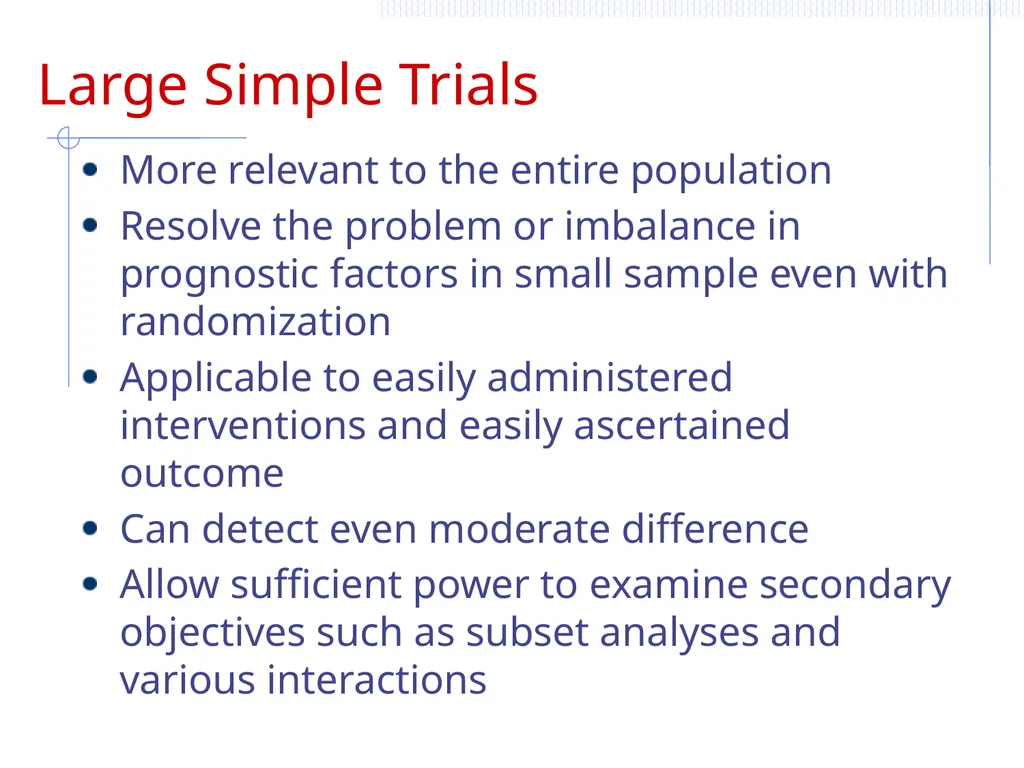
Large Simple Trials More relevant to the entire population
Resolve the problem or imbalance in prognostic factors in small sample even with randomization
Applicable to easily administered interventions and easily ascertained outcome
Can detect even moderate difference
Allow sufficient power to examine secondary objectives such as subset analyses and various interactions<br>
22
Other Study Designs All vs. None Design
low fat + high fiber + fruits + vegetables + exercise vs. none
California’s “5 a day-for better health” campaign, (Am. J. Prev. Med. 11:124-131, 1995)
Interventions are naturally grouped together
If it works, sort out the active component(s) later
Reciprocal Control Design
smoking cessation vs. healthy diet
Avoid no treatment control
(Reference: Efficient Designs for Prostate Cancer Chemoprevention, Lee et al., Urology 2001)<br>
23
3. The Randomization Process Fixed allocation randomization
Simple randomization
Blocked randomization
Stratified randomization
Adaptive randomization
Baseline adaptive randomization
Response adaptive randomization<br>
Simple randomization
Blocked randomization
Stratified randomization
Adaptive randomization
Baseline adaptive randomization
Response adaptive randomization<br>
24
Fundamental Point Randomization tends to produce study groups comparable with respective to known or unknown risk factors,
removes investigator bias in the allocation of participants, and
guarantees that statistical tests with have valid significance levels.<br>
removes investigator bias in the allocation of participants, and
guarantees that statistical tests with have valid significance levels.<br>
25
Commonly Occurred Bias Selection bias (allocation bias)
Occurs in non-randomized trials, or when the allocation process is predictable
Solution: proper randomization process
Accidental bias
Randomization does not achieve balance on risk factors or prognostic variables
Solution: stratification or adaptive randomization
Evaluation (ascertainment) bias
Bias in evaluating outcome, especially when the tx assignment is known. One group is measured more frequently than another
Solution: study blindness
Recall bias
In a retrospective study, subjects are asked to recall prior behavior or exposure. Their memory may not be accurate
Solution: do prospective trial instead
Publication bias
Studies with positive findings (P < 0.05) are more likely to be published. Results from the literature may be biased.
Solution: Interpret with care.<br>
26
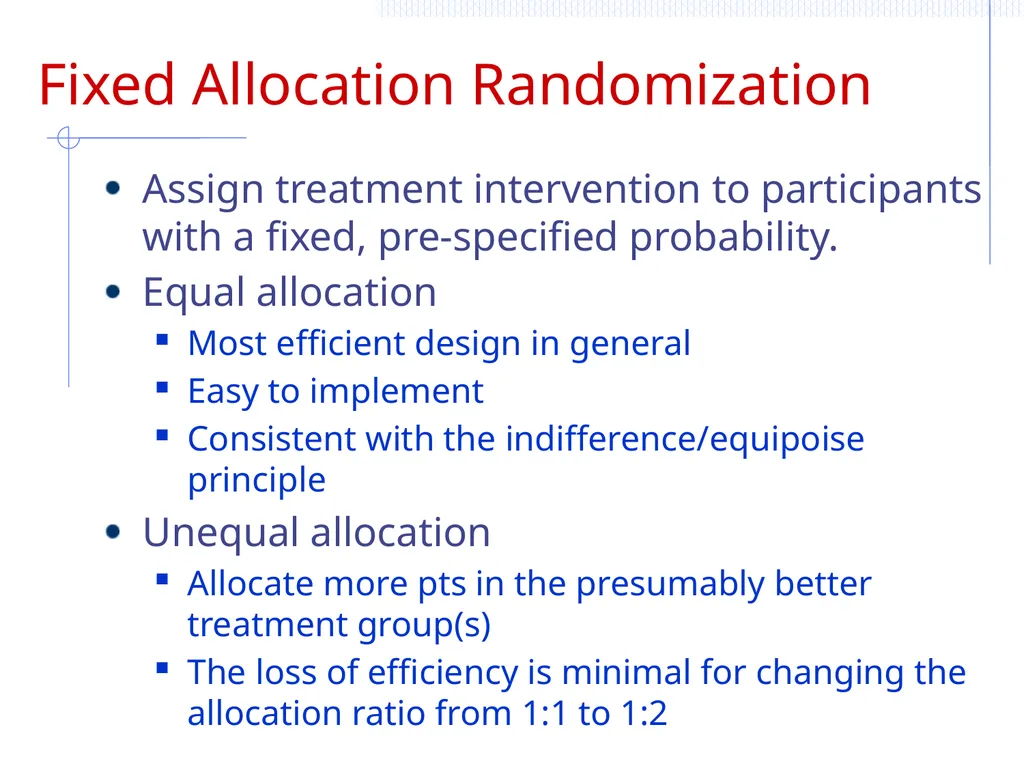
Fixed Allocation Randomization Assign treatment intervention to participants with a fixed, pre-specified probability.
Equal allocation
Most efficient design in general
Easy to implement
Consistent with the indifference/equipoise principle
Unequal allocation
Allocate more pts in the presumably better treatment group(s)
The loss of efficiency is minimal for changing the allocation ratio from 1:1 to 1:2<br>
Equal allocation
Most efficient design in general
Easy to implement
Consistent with the indifference/equipoise principle
Unequal allocation
Allocate more pts in the presumably better treatment group(s)
The loss of efficiency is minimal for changing the allocation ratio from 1:1 to 1:2<br>
27
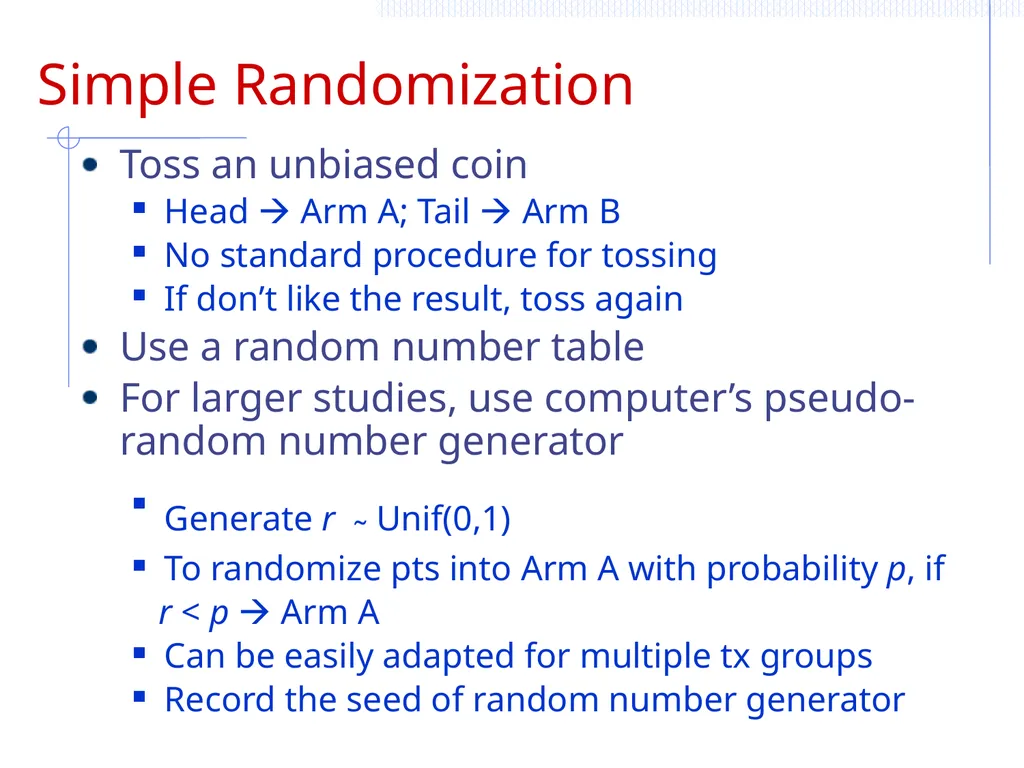
Simple Randomization Toss an unbiased coin
Head Arm A; Tail Arm B
No standard procedure for tossing
If don’t like the result, toss again
Use a random number table
For larger studies, use computer’s pseudo-random number generator
Generate r ˜ Unif(0,1)
To randomize pts into Arm A with probability p, if
r < p Arm A
Can be easily adapted for multiple tx groups
Record the seed of random number generator<br>
28
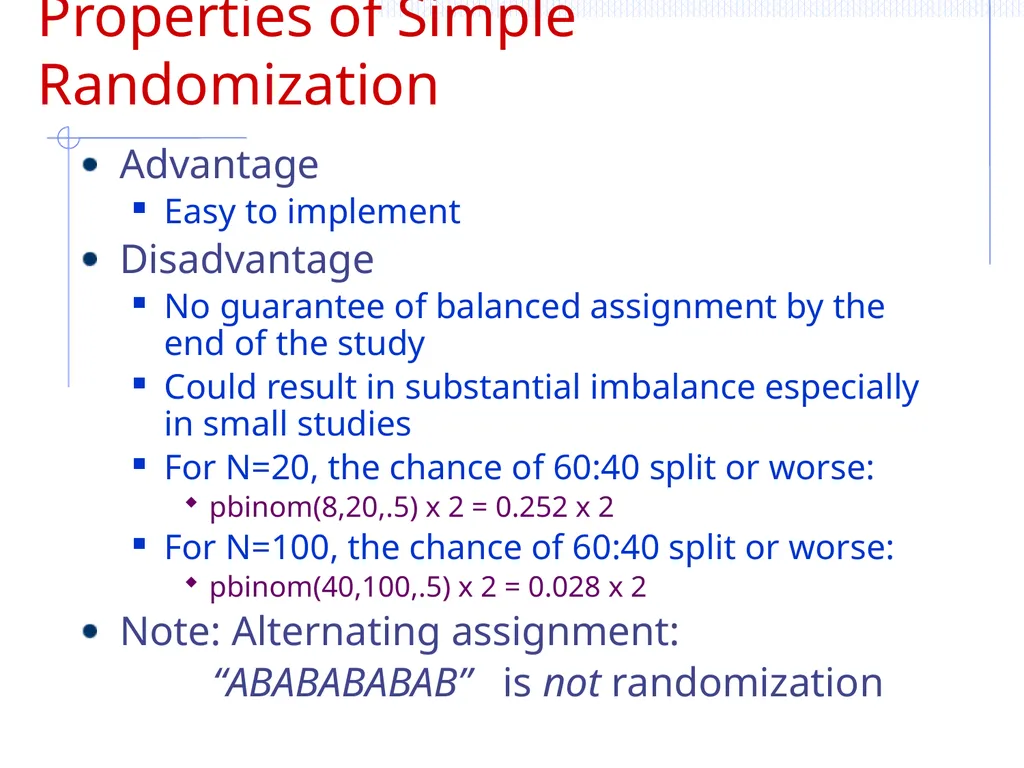
Properties of Simple Randomization Advantage
Easy to implement
Disadvantage
No guarantee of balanced assignment by the end of the study
Could result in substantial imbalance especially in small studies
For N=20, the chance of 60:40 split or worse:
pbinom(8,20,.5) x 2 = 0.252 x 2
For N=100, the chance of 60:40 split or worse:
pbinom(40,100,.5) x 2 = 0.028 x 2
Note: Alternating assignment:
“ABABABABAB” is not randomization<br>
29
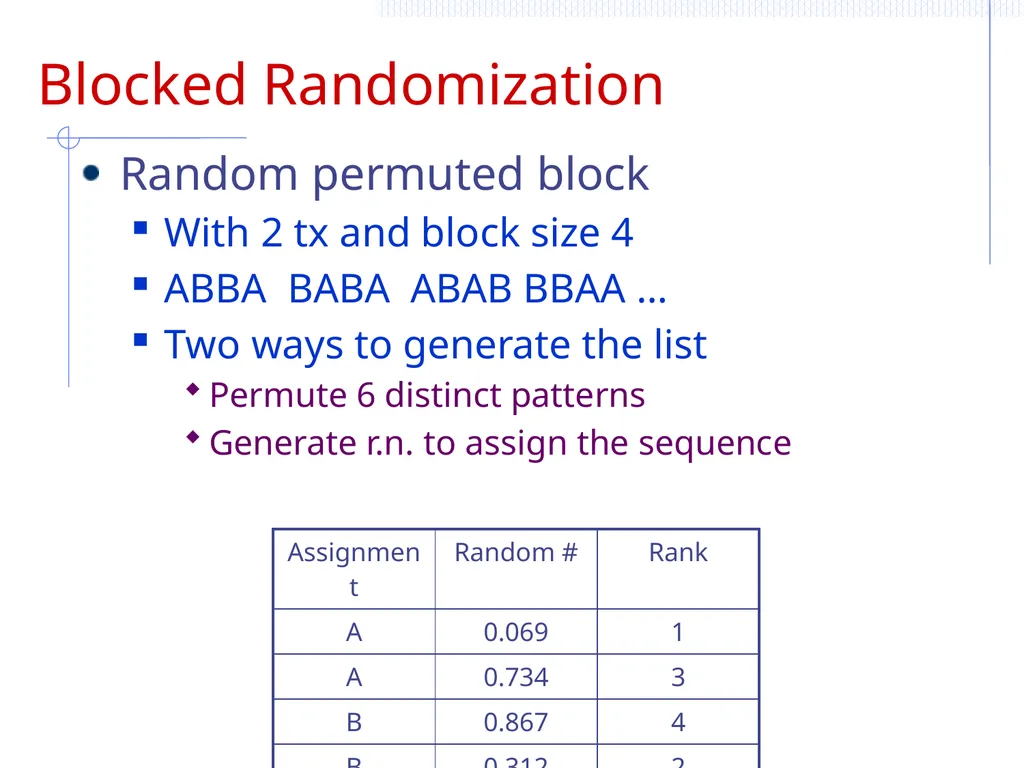
Blocked Randomization Random permuted block
With 2 tx and block size 4
ABBA BABA ABAB BBAA …
Two ways to generate the list
Permute 6 distinct patterns
Generate r.n. to assign the sequence<br>
With 2 tx and block size 4
ABBA BABA ABAB BBAA …
Two ways to generate the list
Permute 6 distinct patterns
Generate r.n. to assign the sequence<br>
30
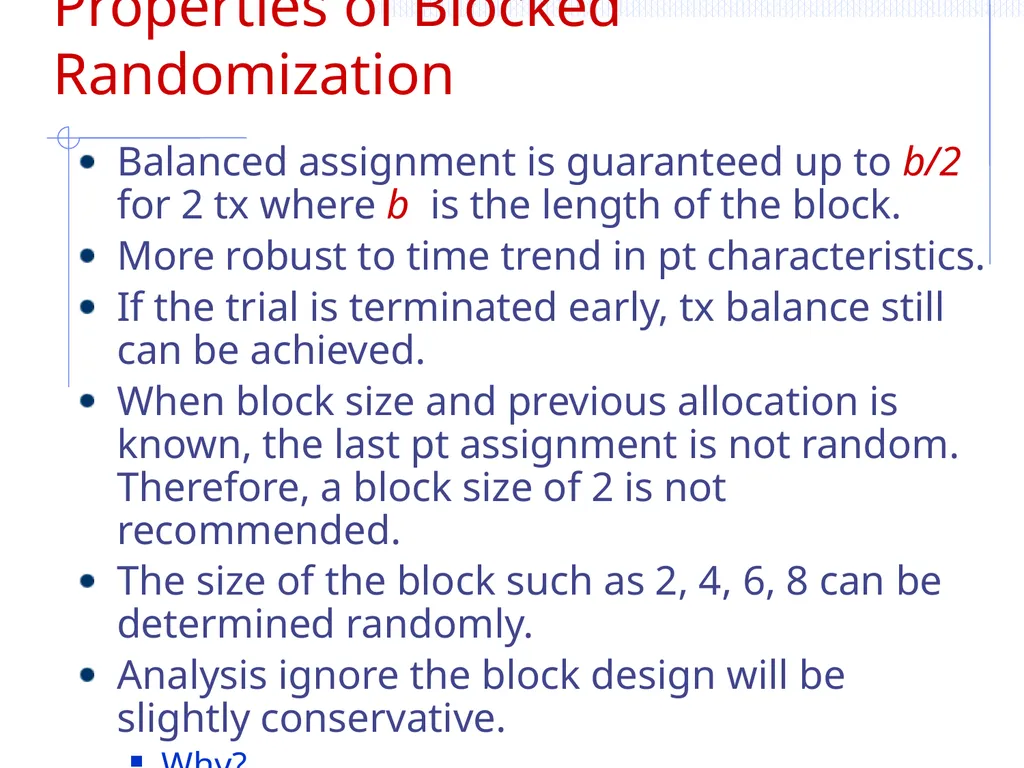
Properties of Blocked Randomization Balanced assignment is guaranteed up to b/2 for 2 tx where b is the length of the block.
More robust to time trend in pt characteristics.
If the trial is terminated early, tx balance still can be achieved.
When block size and previous allocation is known, the last pt assignment is not random. Therefore, a block size of 2 is not recommended.
The size of the block such as 2, 4, 6, 8 can be determined randomly.
Analysis ignore the block design will be slightly conservative.
Why?<br>
31
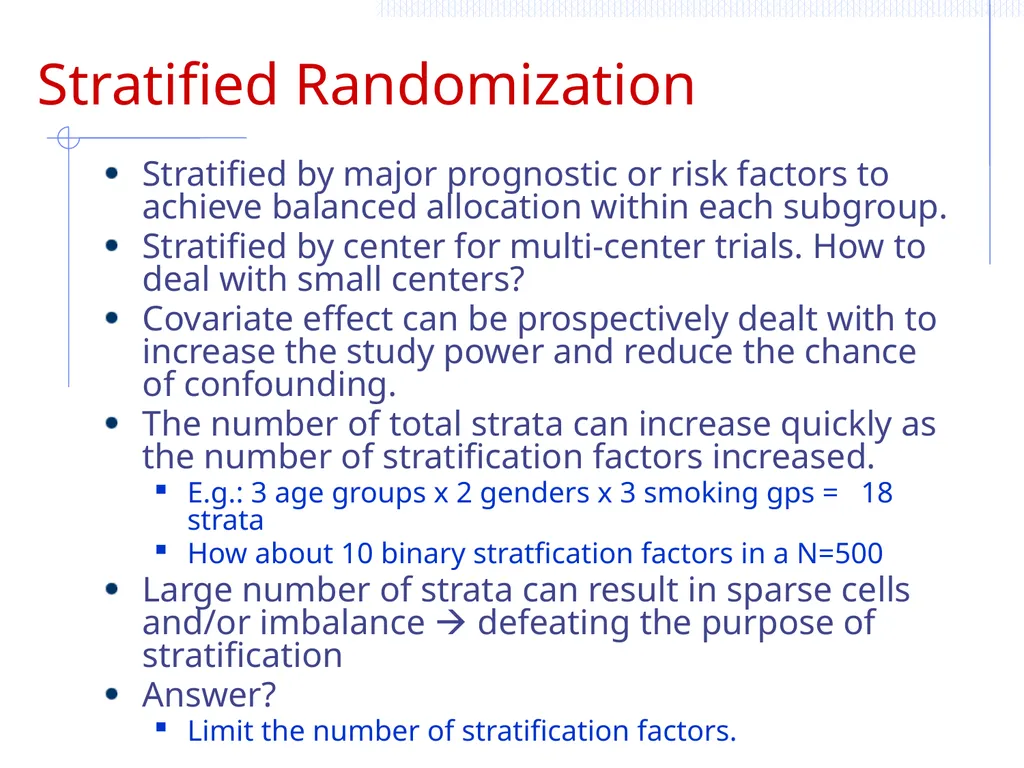
Stratified Randomization Stratified by major prognostic or risk factors to achieve balanced allocation within each subgroup.
Stratified by center for multi-center trials. How to deal with small centers?
Covariate effect can be prospectively dealt with to increase the study power and reduce the chance of confounding.
The number of total strata can increase quickly as the number of stratification factors increased.
E.g.: 3 age groups x 2 genders x 3 smoking gps = 18 strata
How about 10 binary stratfication factors in a N=500
Large number of strata can result in sparse cells and/or imbalance defeating the purpose of stratification
Answer?
Limit the number of stratification factors.<br>
32
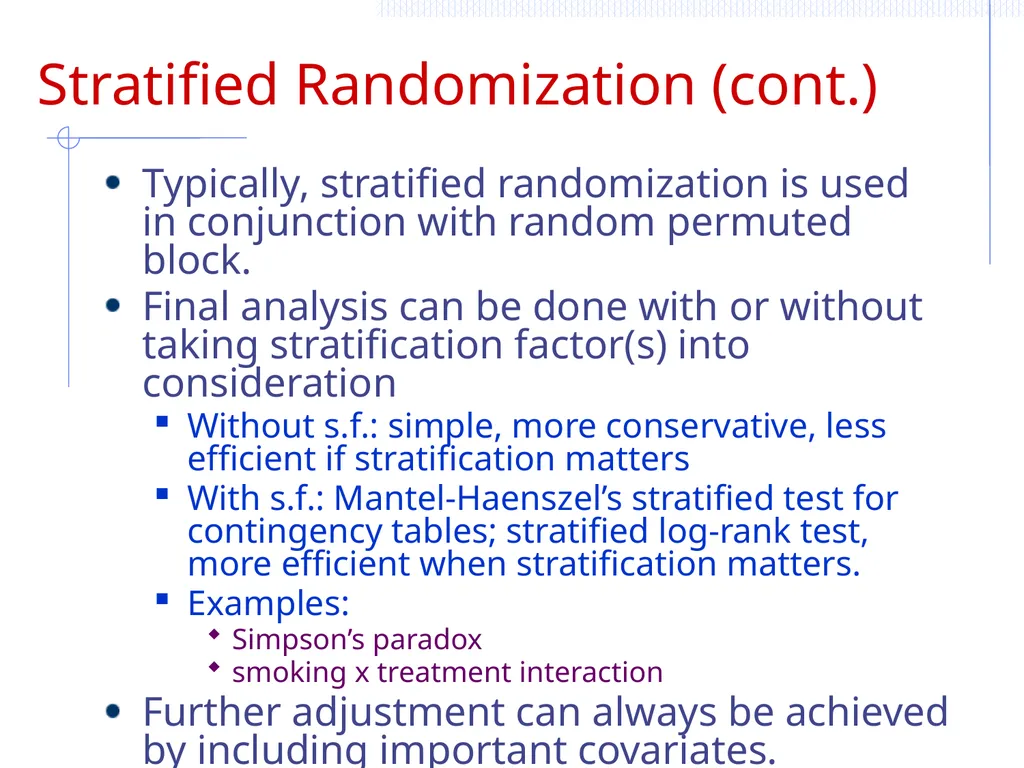
Stratified Randomization (cont.) Typically, stratified randomization is used in conjunction with random permuted block.
Final analysis can be done with or without taking stratification factor(s) into consideration
Without s.f.: simple, more conservative, less efficient if stratification matters
With s.f.: Mantel-Haenszel’s stratified test for contingency tables; stratified log-rank test, more efficient when stratification matters.
Examples:
Simpson’s paradox
smoking x treatment interaction
Further adjustment can always be achieved by including important covariates.<br>
33
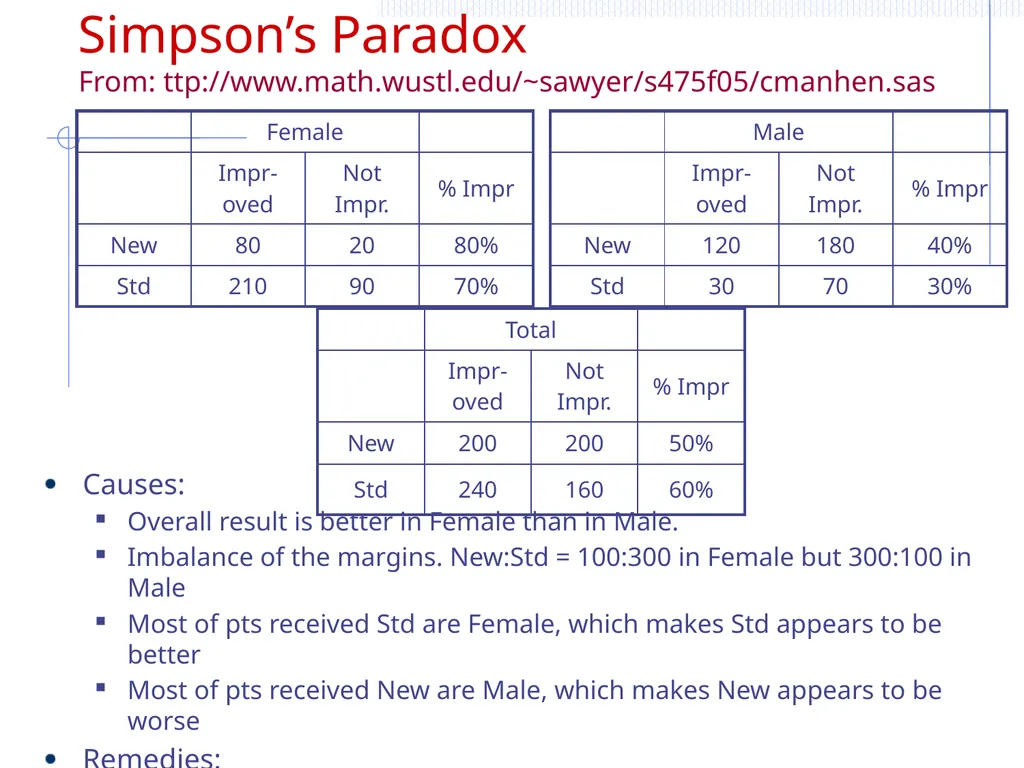
Simpson’s Paradox
From: ttp://www.math.wustl.edu/~sawyer/s475f05/cmanhen.sas Causes:
Overall result is better in Female than in Male.
Imbalance of the margins. New:Std = 100:300 in Female but 300:100 in Male
Most of pts received Std are Female, which makes Std appears to be better
Most of pts received New are Male, which makes New appears to be worse
Remedies:
Stratified randomization
Use (Cochran) Mantel-Haenszel test for the stratified analysis<br>
34
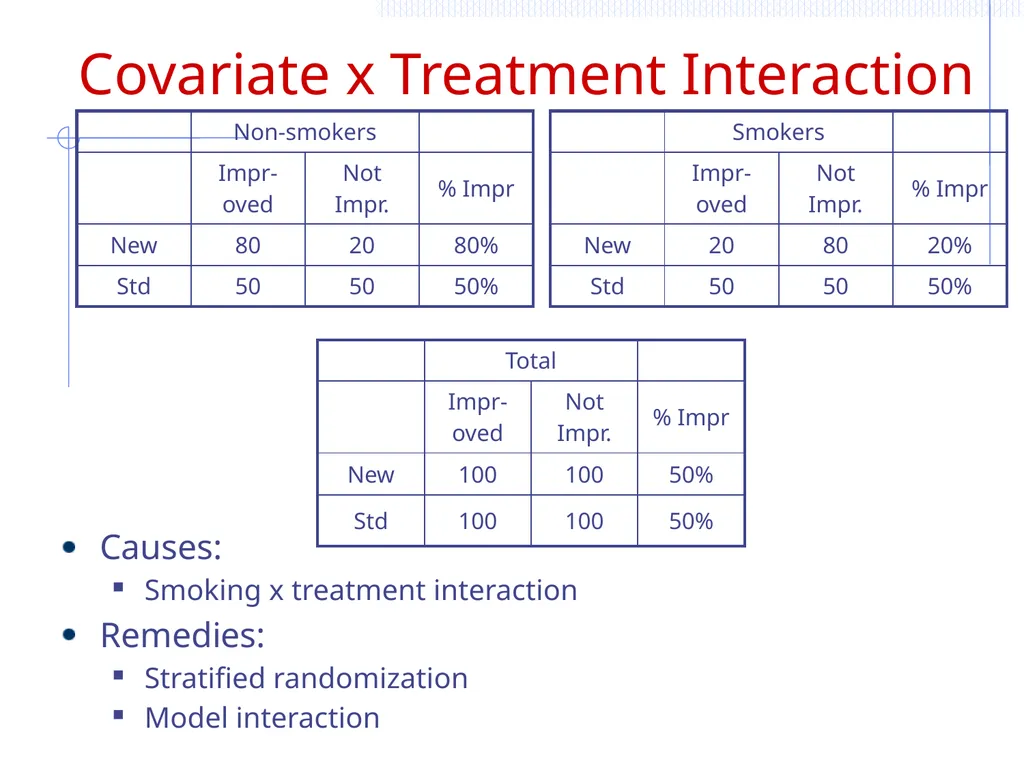
Covariate x Treatment Interaction Causes:
Smoking x treatment interaction
Remedies:
Stratified randomization
Model interaction<br>
Smoking x treatment interaction
Remedies:
Stratified randomization
Model interaction<br>
35
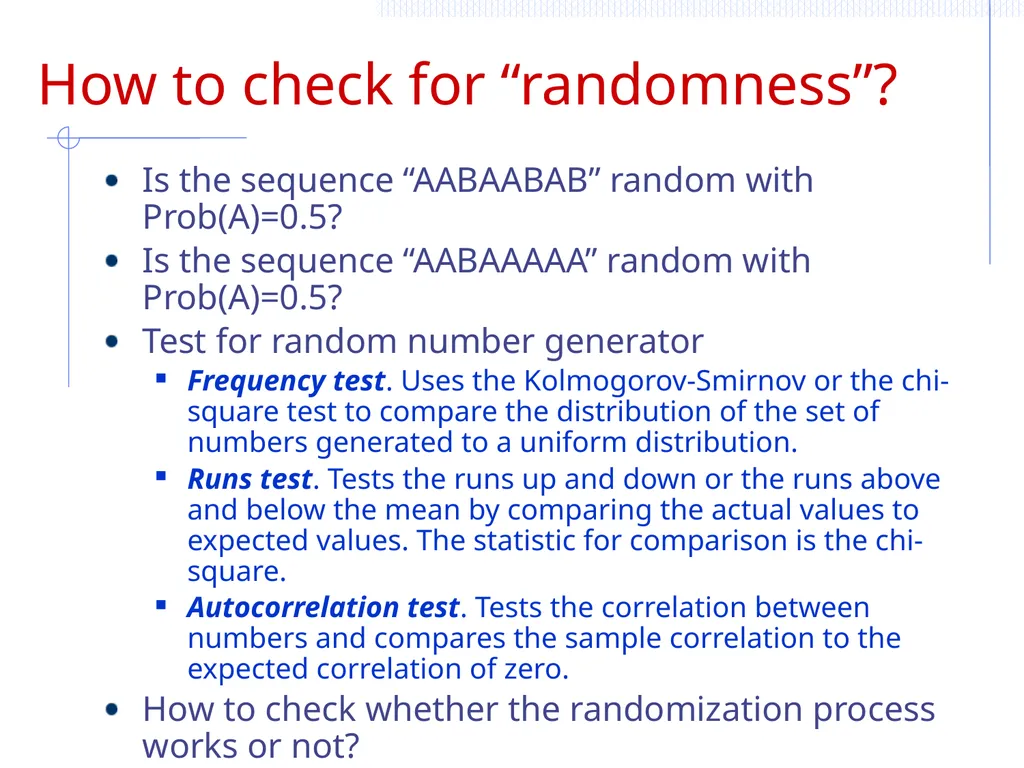
How to check for “randomness”? Is the sequence “AABAABAB” random with Prob(A)=0.5?
Is the sequence “AABAAAAA” random with Prob(A)=0.5?
Test for random number generator
Frequency test. Uses the Kolmogorov-Smirnov or the chi-square test to compare the distribution of the set of numbers generated to a uniform distribution.
Runs test. Tests the runs up and down or the runs above and below the mean by comparing the actual values to expected values. The statistic for comparison is the chi-square.
Autocorrelation test. Tests the correlation between numbers and compares the sample correlation to the expected correlation of zero.
How to check whether the randomization process works or not?<br>
36
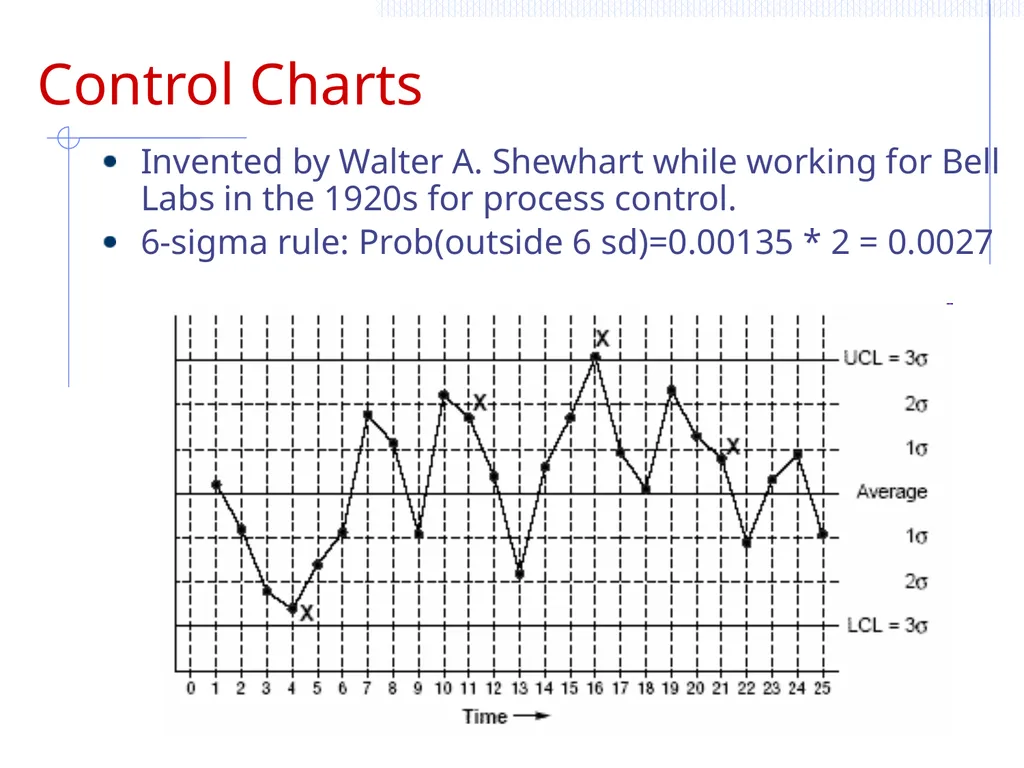
Control Charts Invented by Walter A. Shewhart while working for Bell Labs in the 1920s for process control.
6-sigma rule: Prob(outside 6 sd)=0.00135 * 2 = 0.0027<br>
6-sigma rule: Prob(outside 6 sd)=0.00135 * 2 = 0.0027<br>
37
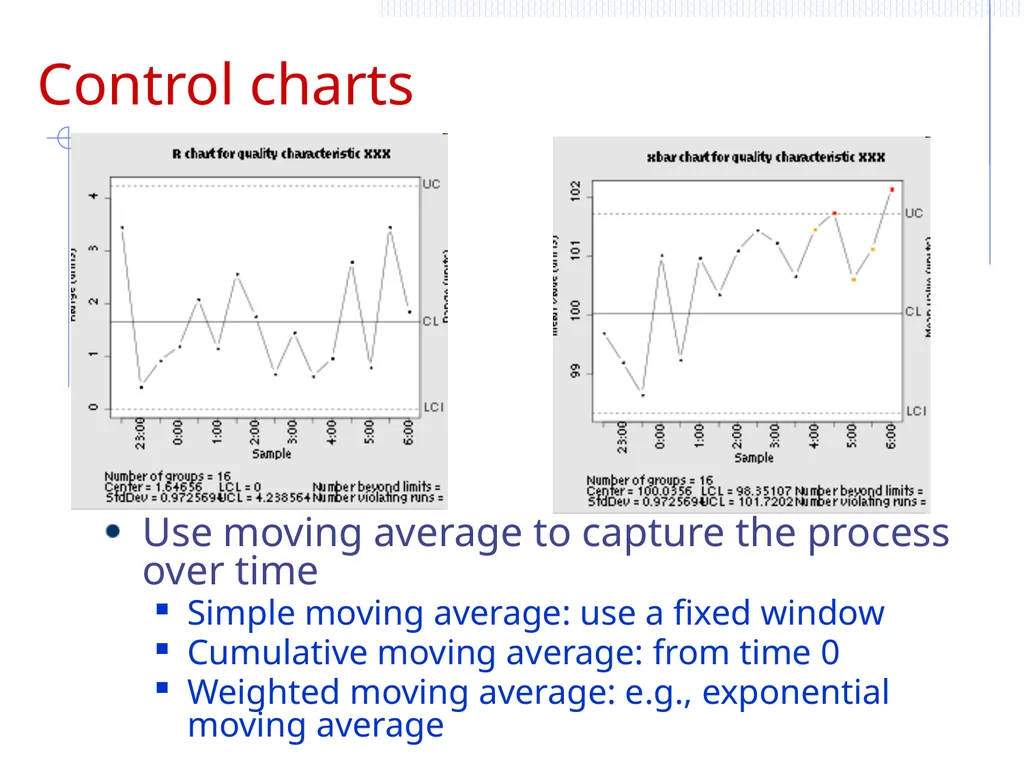
Control charts Use moving average to capture the process over time
Simple moving average: use a fixed window
Cumulative moving average: from time 0
Weighted moving average: e.g., exponential moving average<br>
Simple moving average: use a fixed window
Cumulative moving average: from time 0
Weighted moving average: e.g., exponential moving average<br>
38
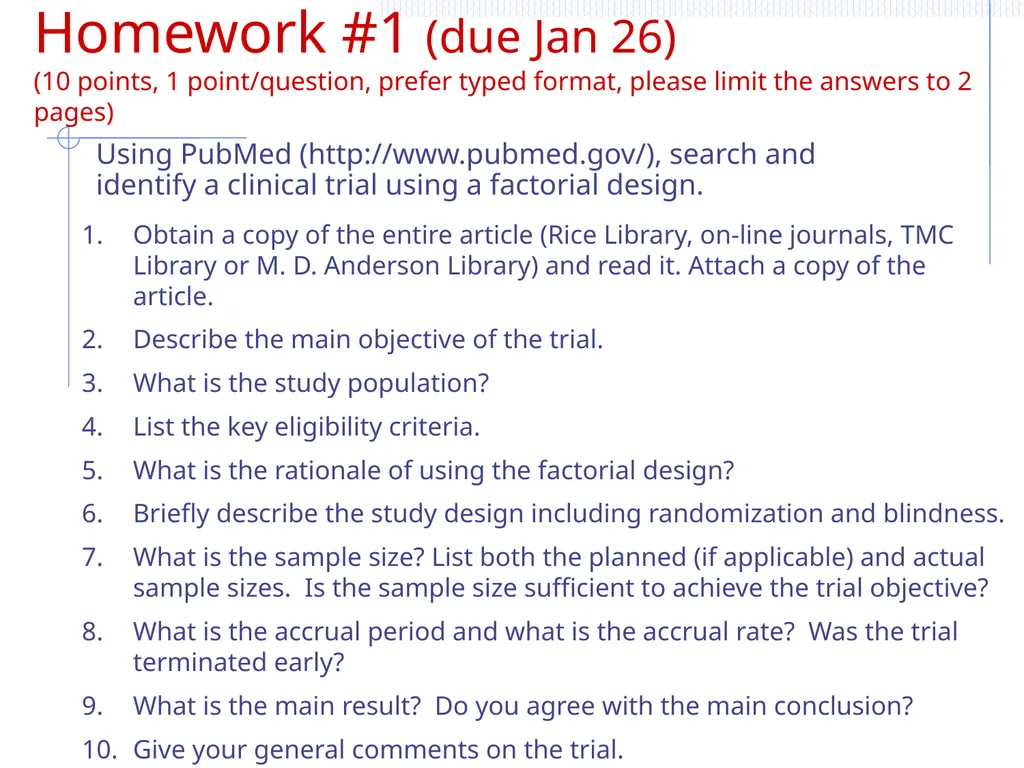
Homework #1 (due Jan 26)
(10 points, 1 point/question, prefer typed format, please limit the answers to 2 pages) Using PubMed (http://www.pubmed.gov/), search and identify a clinical trial using a factorial design. Obtain a copy of the entire article (Rice Library, on-line journals, TMC Library or M. D. Anderson Library) and read it. Attach a copy of the article.
Describe the main objective of the trial.
What is the study population?
List the key eligibility criteria.
What is the rationale of using the factorial design?
Briefly describe the study design including randomization and blindness.
What is the sample size? List both the planned (if applicable) and actual sample sizes. Is the sample size sufficient to achieve the trial objective?
What is the accrual period and what is the accrual rate? Was the trial terminated early?
What is the main result? Do you agree with the main conclusion?
Give your general comments on the trial.<br>
39
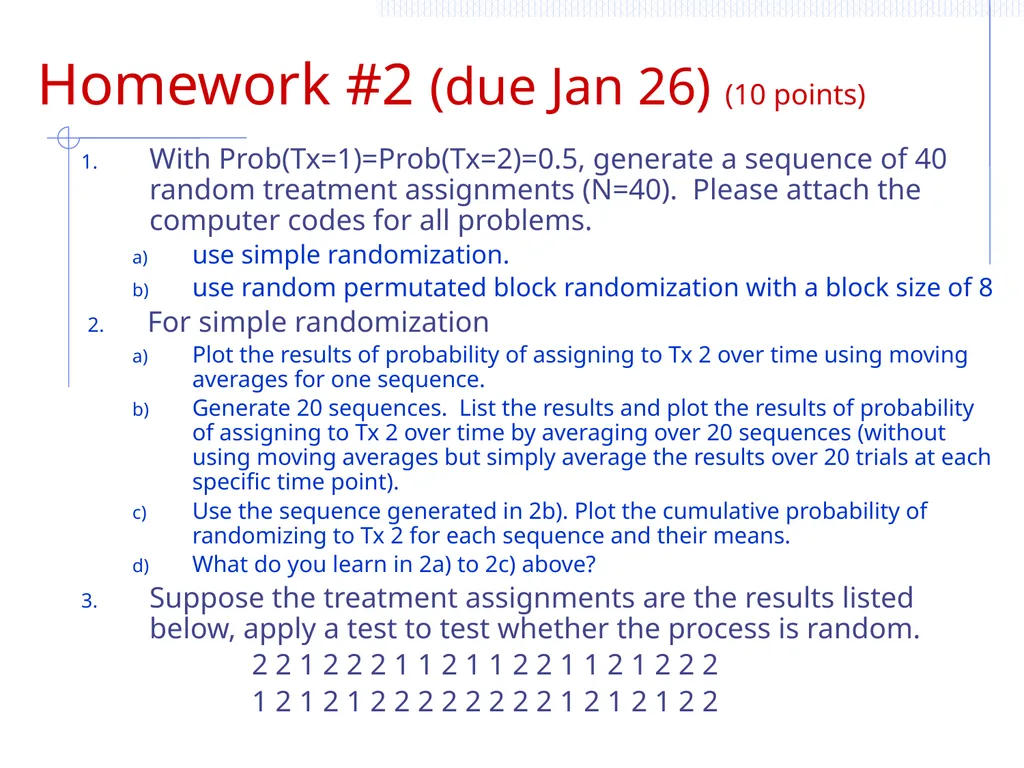
Homework #2 (due Jan 26) (10 points) With Prob(Tx=1)=Prob(Tx=2)=0.5, generate a sequence of 40 random treatment assignments (N=40). Please attach the computer codes for all problems.
use simple randomization.
use random permutated block randomization with a block size of 8
For simple randomization
Plot the results of probability of assigning to Tx 2 over time using moving averages for one sequence.
Generate 20 sequences. List the results and plot the results of probability of assigning to Tx 2 over time by averaging over 20 sequences (without using moving averages but simply average the results over 20 trials at each specific time point).
Use the sequence generated in 2b). Plot the cumulative probability of randomizing to Tx 2 for each sequence and their means.
What do you learn in 2a) to 2c) above?
Suppose the treatment assignments are the results listed below, apply a test to test whether the process is random.
2 2 1 2 2 2 1 1 2 1 1 2 2 1 1 2 1 2 2 2
1 2 1 2 1 2 2 2 2 2 2 2 2 1 2 1 2 1 2 2<br>