
Towards identifying policies to address













Description: Towards identifying policies to address educational quality Servaas van der Berg Department of Economics, Stellenbosch University PSPPD Project 28 March 2011 Questions posed What are major fault-lines in our education and skills
Related Topics
Download Presentation
"Towards identifying policies to address" is the property of its rightful owner. Permission is granted to download and print the materials on this website for personal, non-commercial use only, and to display it on your personal computer provided you do not modify the materials and that you retain all copyright notices contained in the materials. By downloading content from our website, you accept the terms of this agreement.
Presentation Transcript
slide1. Towards identifying policies to address educational quality Servaas van der Berg
Department of Economics, Stellenbosch University
PSPPD Project – 28 March 2011<br>
slide2. Questions posed What are major fault-lines in our education and skills development system?
What is extent of underperformance of SA school system?
What factors drive underperformance of SA school system?
How can flow from school to post-school be improved, and scale & quality of post-school learning be expanded?
Outcome targets: Actual for 2014, potential for 2025?
What are the ten most effective interventions to improve education outcomes by 2020-2025?
How have countries facing similar problems turned their education systems around? 2<br>
slide3. Issues SA school performance in perspective:
Schools and the labour market
Weak performance, even in African context
Poverty cannot explain this – SA’s poor fare worse than Africa’s poor
The school system has two parts, one functioning fairly well, the other extremely weakly
Resources bring little improvement in weak schools, due to functionality issues
Features of poorly functioning schools:
Slow macro pacing, poor use of instructional time, low curriculum coverage
Low cognitive demand, weak assessment, little feedback
Lack of textbooks/workbooks/reading material (some teachers think textbooks and workbooks are ‘not applicable’ in FP; libraries seldom function)
Problems with second language teaching and learning
Policy directions 3<br>
slide4. SA’s dualistic school system and labour market High productivity jobs & incomes
±10% of labour force – mainly professional, managerial & skilled jobs
Requires graduates, good quality matric, or good vocational skills
Historically mainly whites Low productivity jobs & incomes
Often manual or low skill jobs
Limited or low quality education
Minimum wage can exceed their productivity High quality schools
±10% of schools, mainly ex-white, but racial composition changed
Produce strong cognitive skills
Teachers well qualified, schools function well, good assessment, parents involved Low quality schools
Produce very weak cognitive skills
Teachers less qualified, de-motiva-ted, many schools dysfunctional, weak assessment, little parental involvement, strong union presence
Mainly former black (DET) schools Big demand for good schools, despite fees
A few schools cross the divide Vocational training
Affirmative action Some talented, motivated or lucky students manage the transition<br>
slide5. Education affects labour market outcomes 5 Employment probability, 2005
(conditional) Good education provides access to top end of labour market – (better) jobs, higher wages
Skills shortage at top end causes a wage premium
Oversupply of unskilled workers depresses wages at bottom end
Race between demand and supply of skills will determine skills premium
This premium and the distribution of educational attainment are currently central to SA income inequality<br>
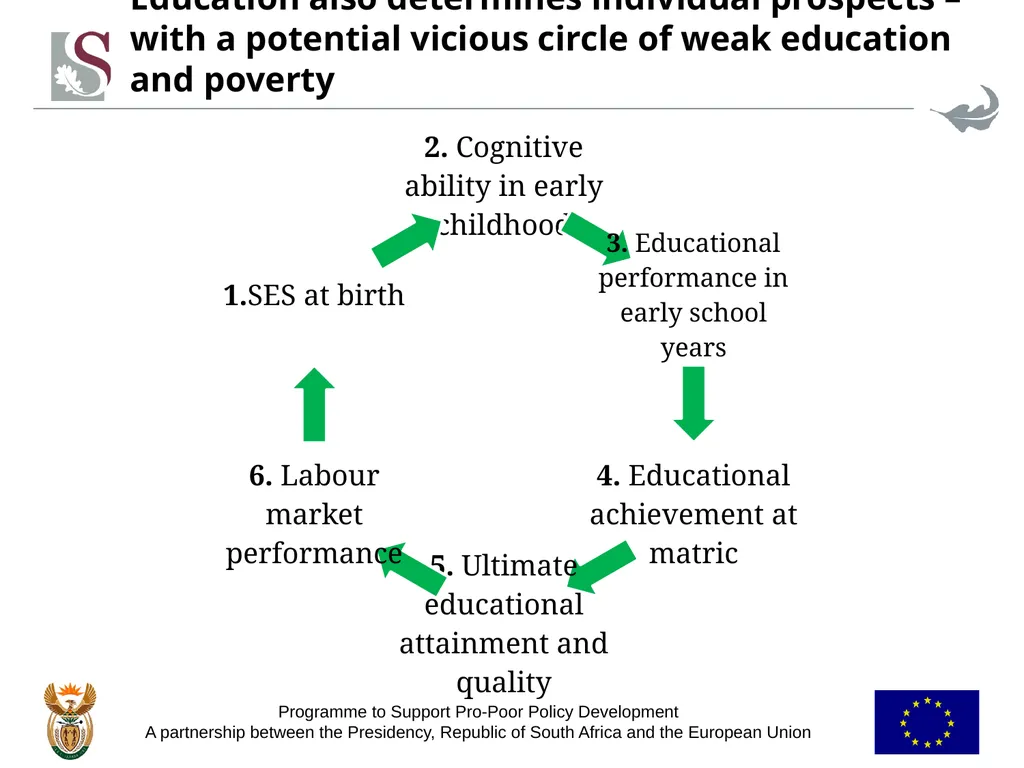
slide6. Education also determines individual prospects – with a potential vicious circle of weak education and poverty<br>
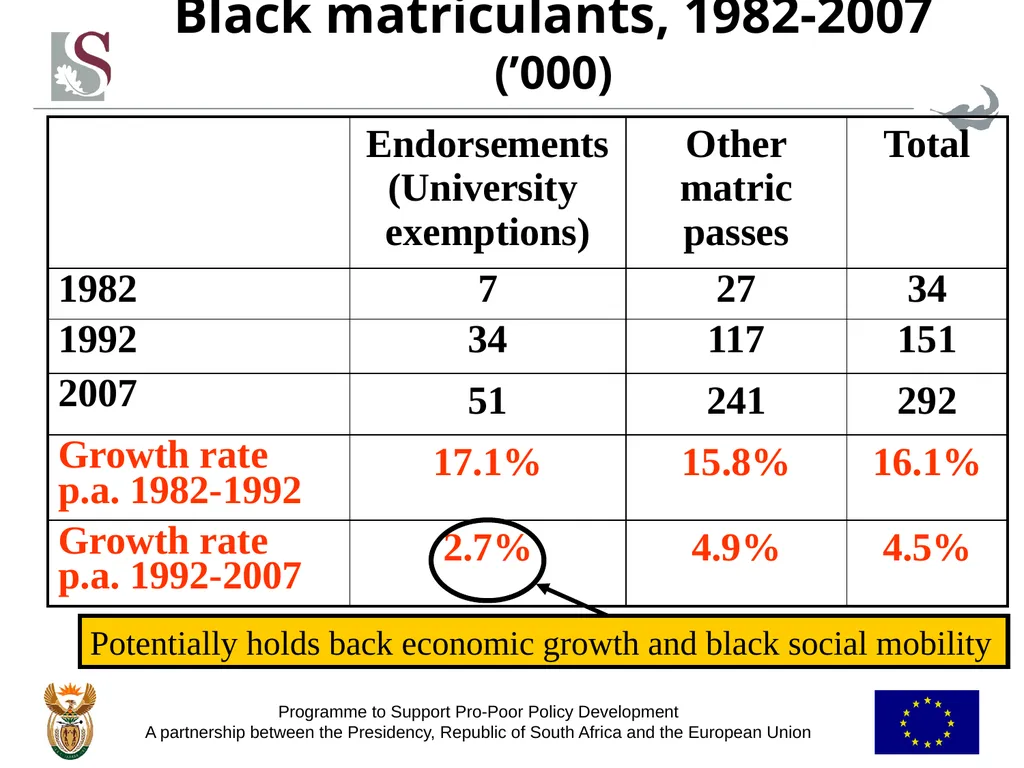
slide7. Black matriculants, 1982-2007 (’000) Potentially holds back economic growth and black social mobility<br>
slide8. Literacy score in PIRLS 2006<br>
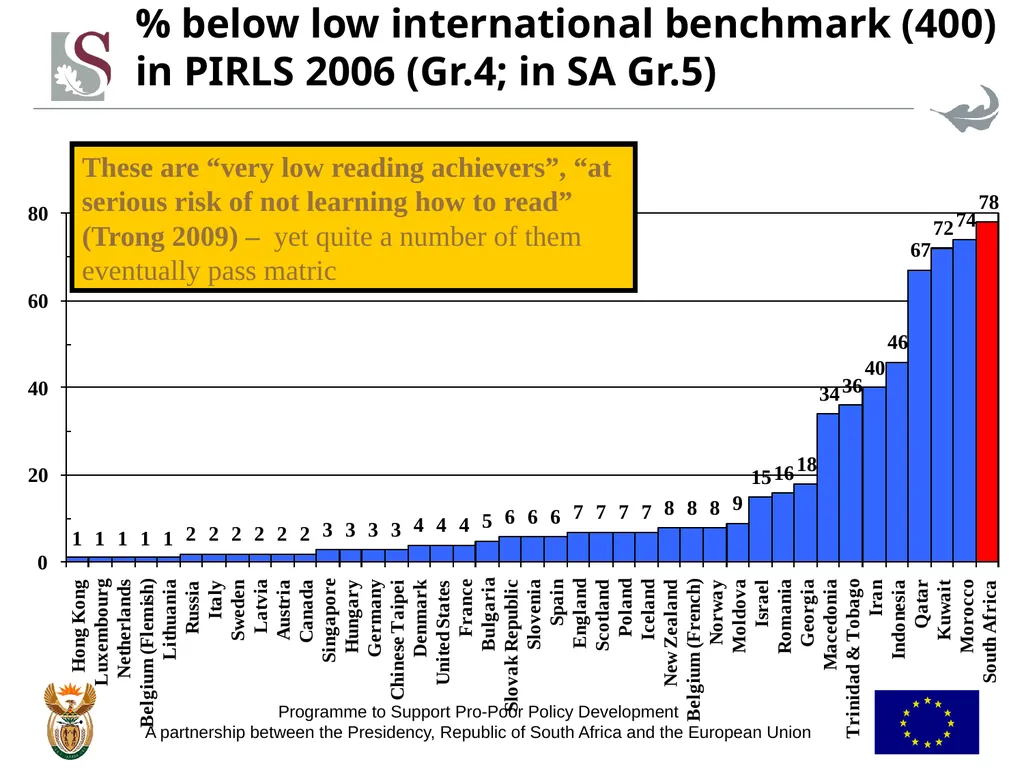
slide9. % below low international benchmark (400) in PIRLS 2006 (Gr.4; in SA Gr.5) These are “very low reading achievers”, “at serious risk of not learning how to read” (Trong 2009) – yet quite a number of them eventually pass matric<br>
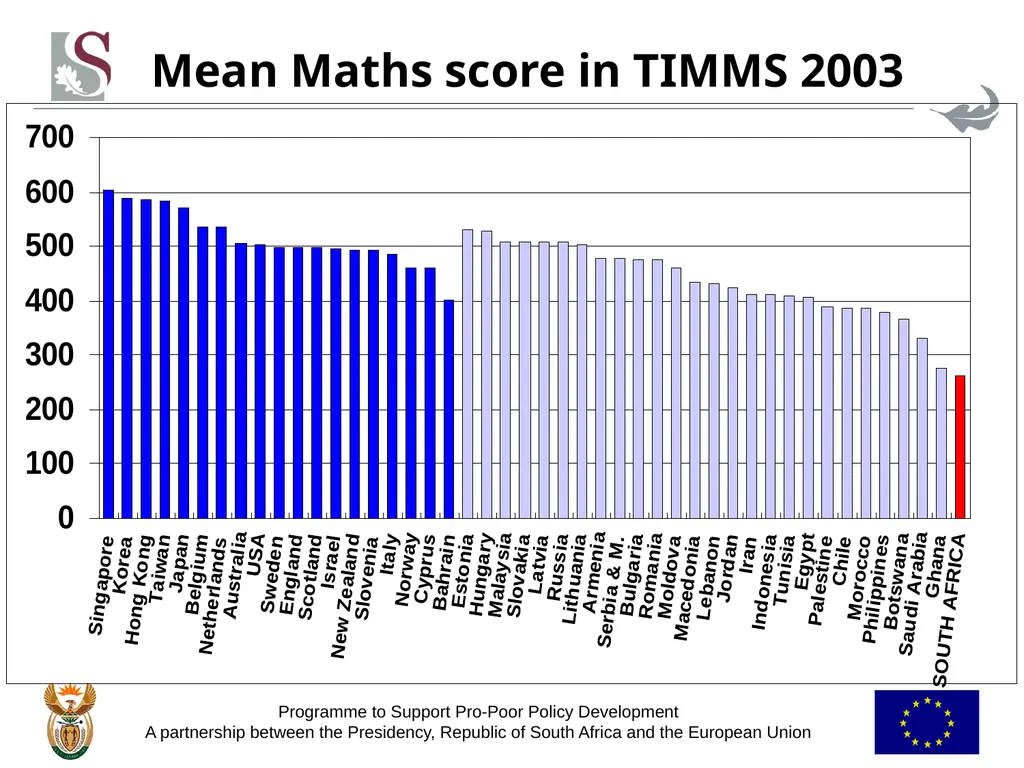
slide10. Mean Maths score in TIMMS 2003<br>
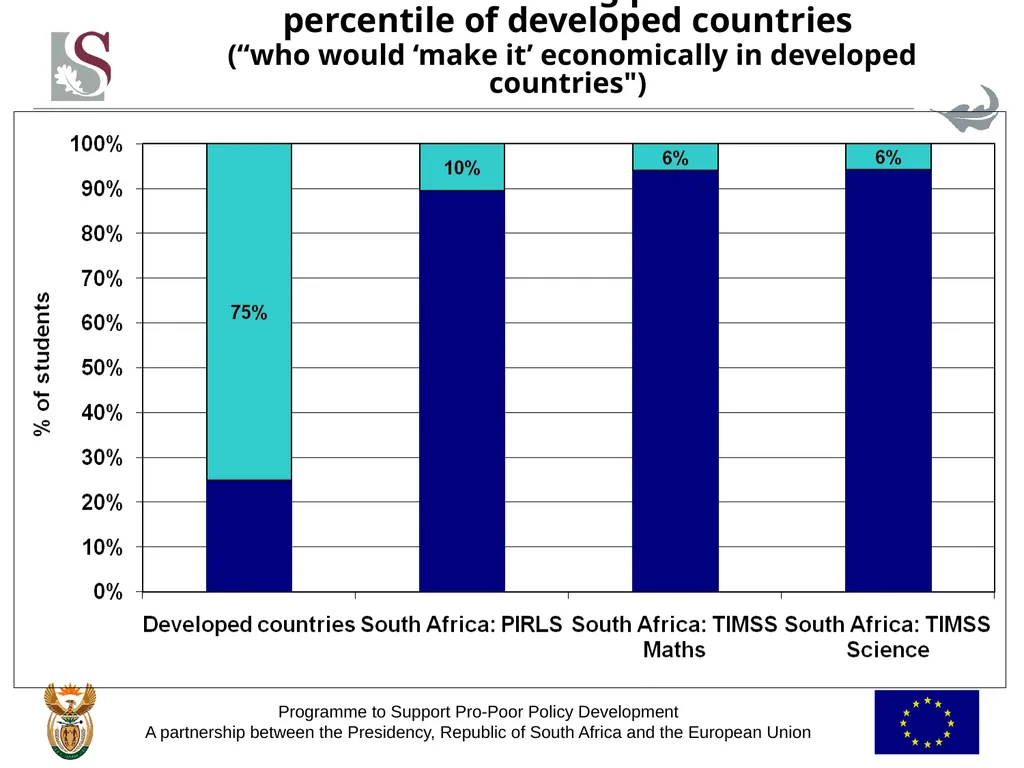
slide11. % of SA students exceeding performance at 75th percentile of developed countries (“who would ‘make it’ economically in developed countries")<br>
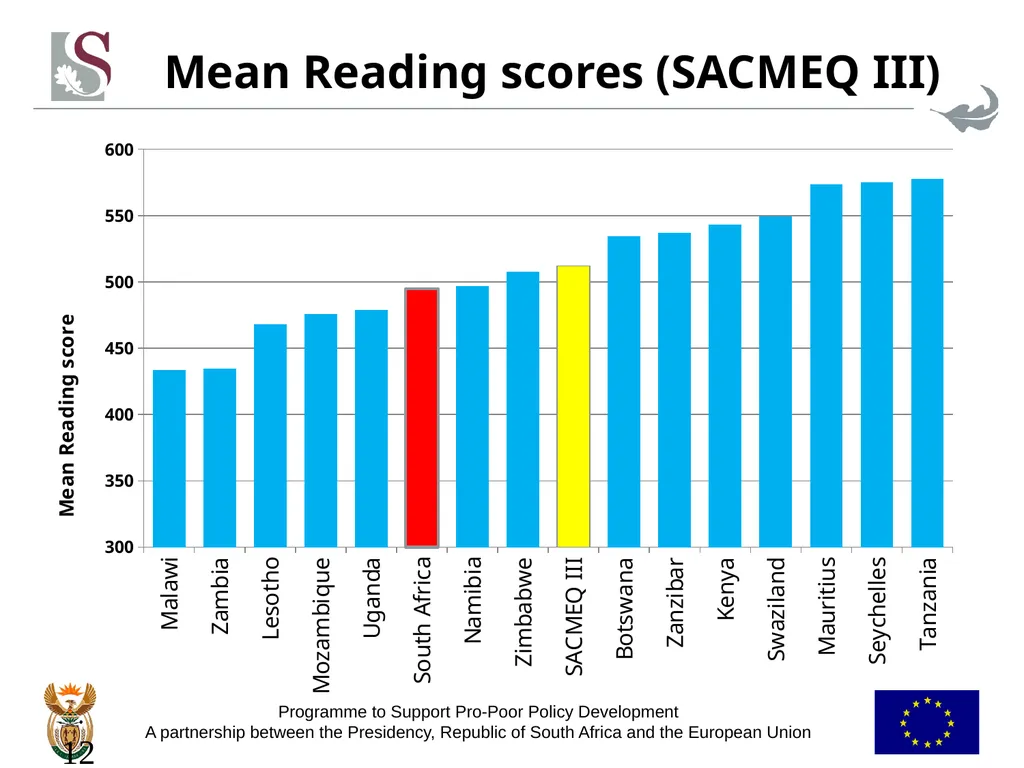
slide12. Mean Reading scores (SACMEQ III) 12<br>
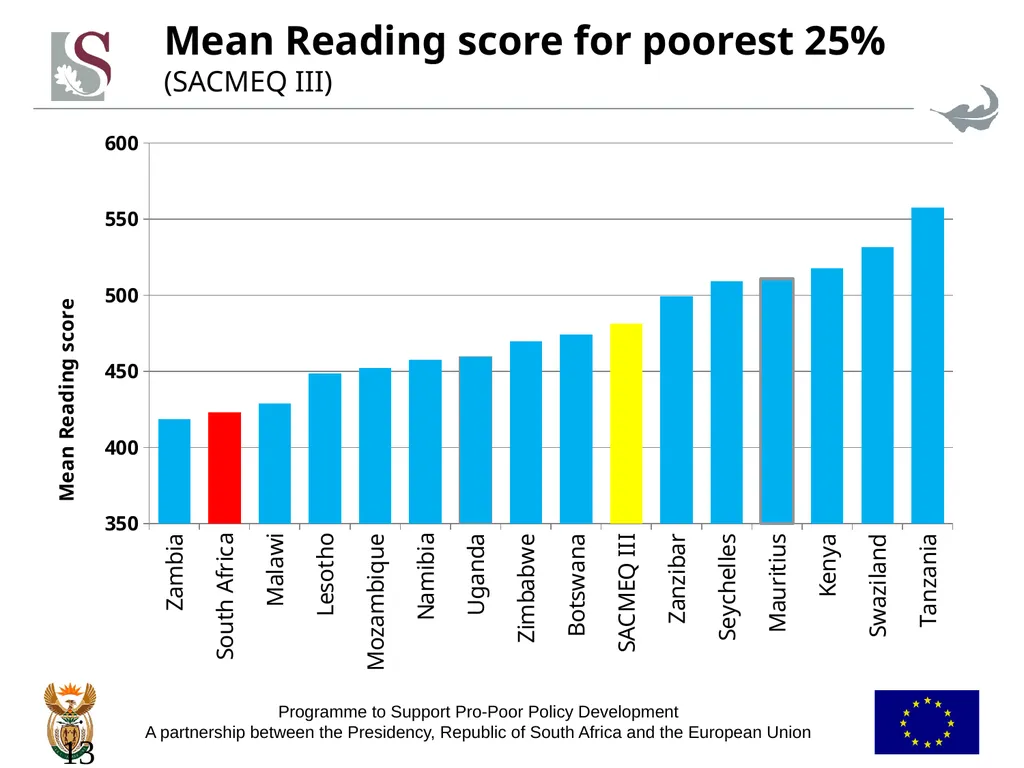
slide13. Mean Reading score for poorest 25% (SACMEQ III) 13<br>
slide14. Lowess regression on schools’ average maths score, SA & other SACMEQ countries<br>
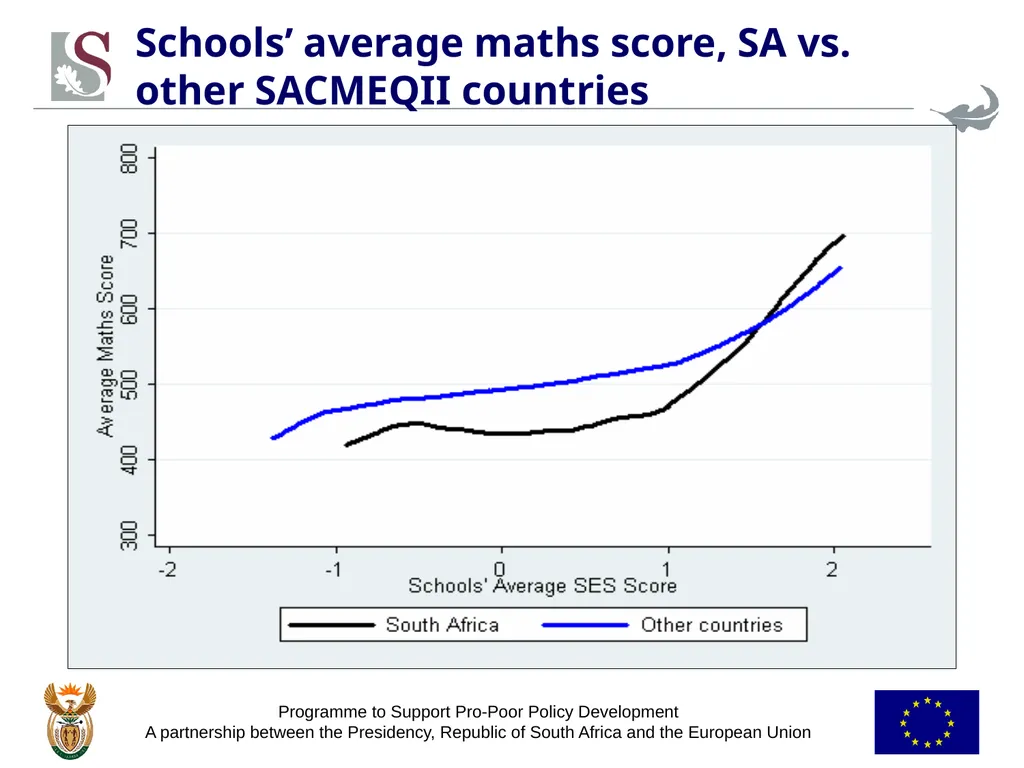
slide15. Schools’ average maths score, SA vs. other SACMEQII countries<br>
slide16. Kernel density curves of matric average by race, 2005<br>
slide17. PIRLS reading scores by school type 17<br>
slide18. Gr.6 reading test scores by SES quintile 18<br>
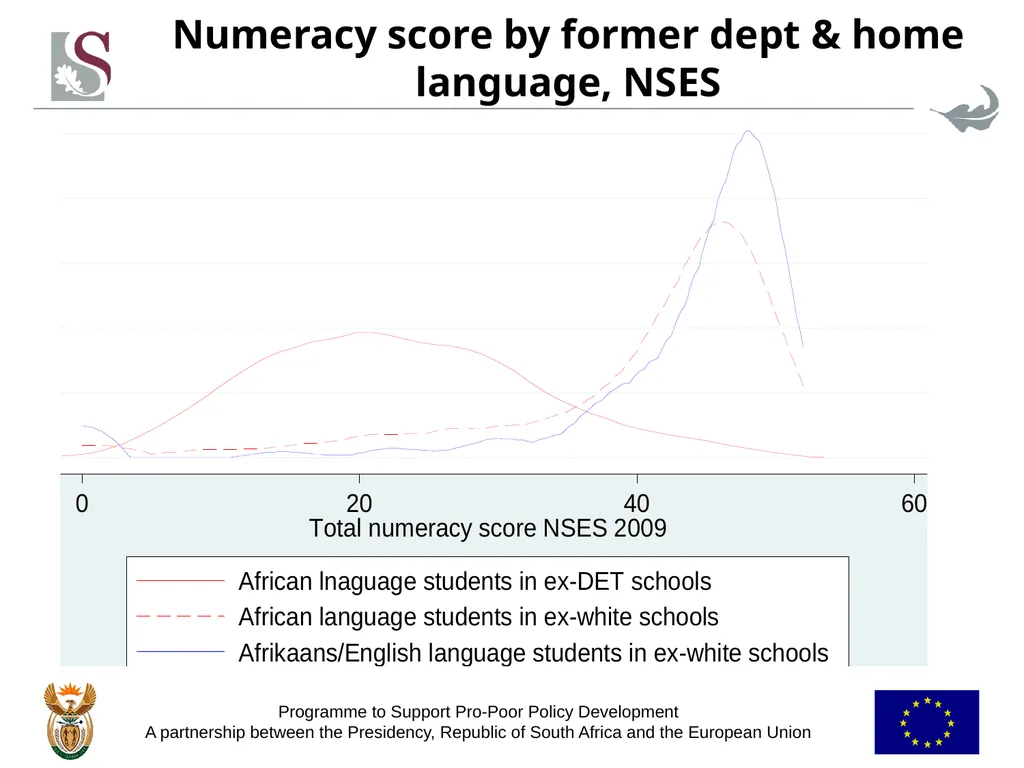
slide19. Numeracy score by former dept & home language, NSES<br>
slide20. Literacy achievement by former department and grade, NSES<br>
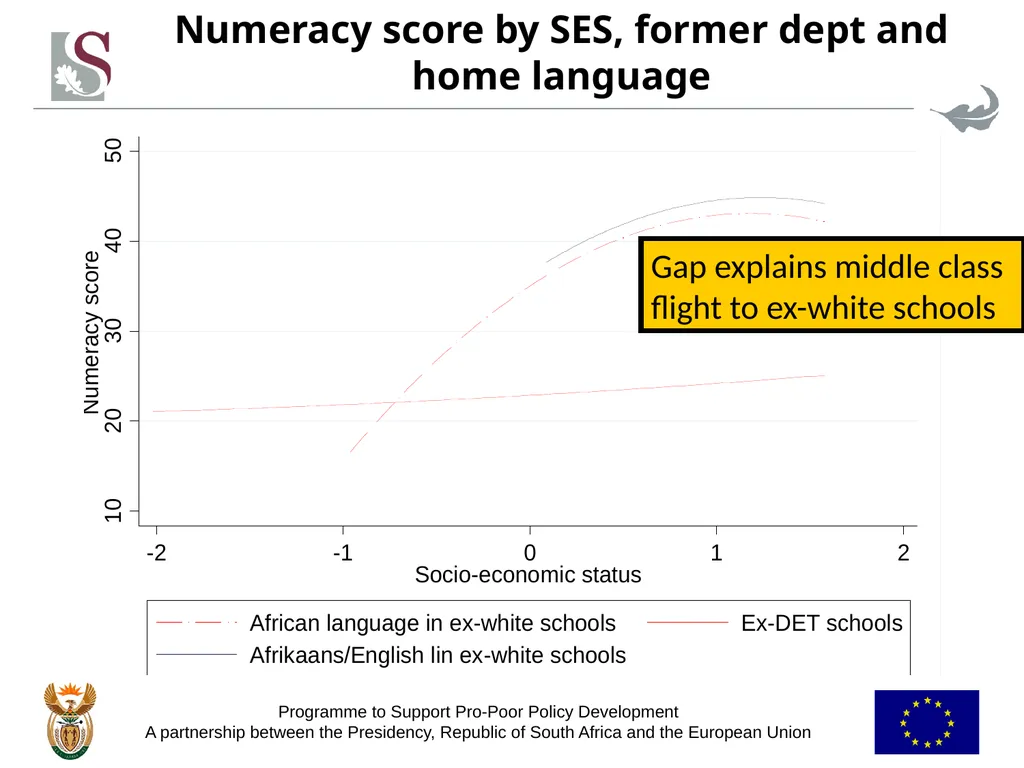
slide21. Gap explains middle class flight to ex-white schools Numeracy score by SES, former dept and home language<br>
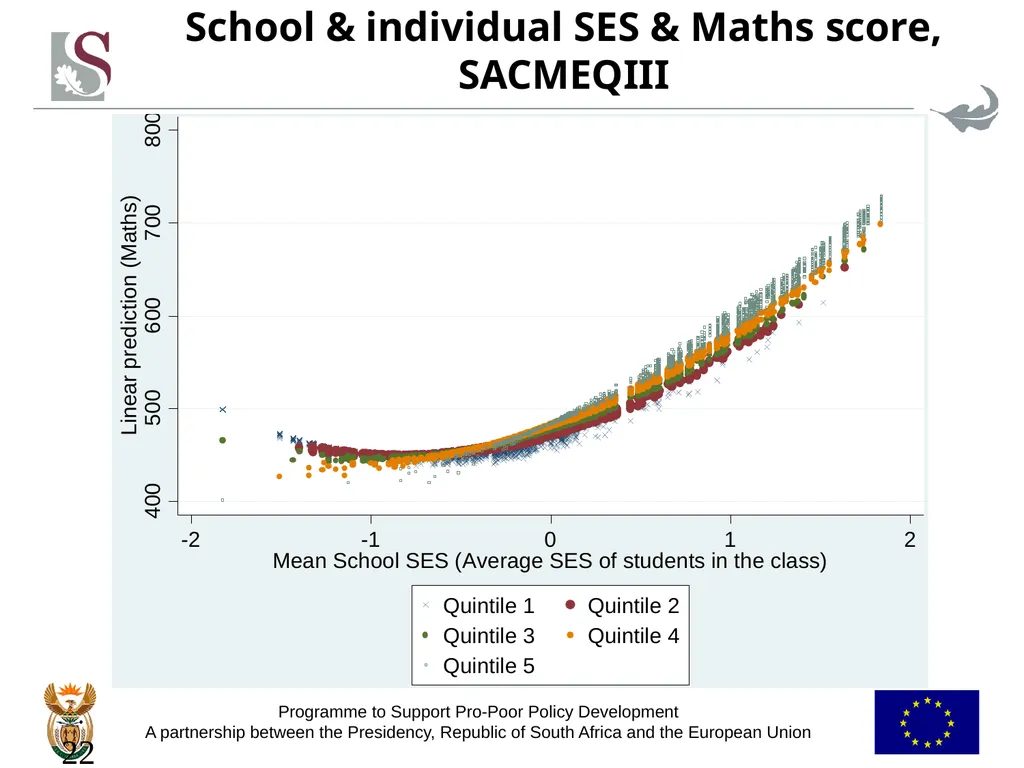
slide22. School & individual SES & Maths score, SACMEQIII 22<br>
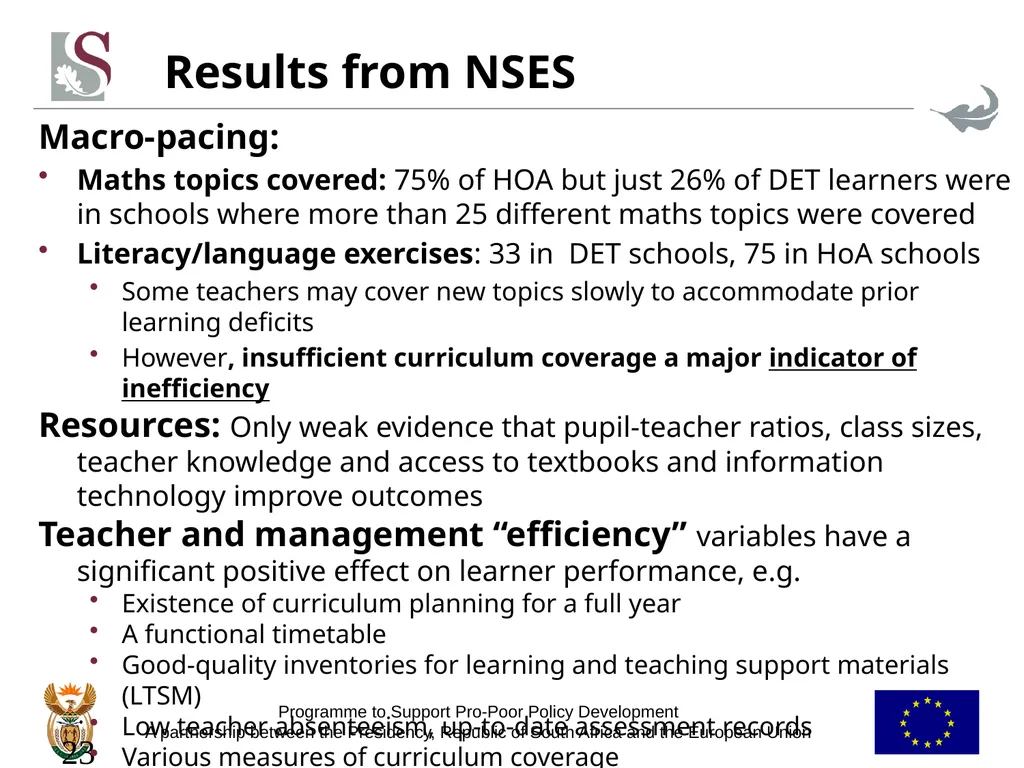
slide23. Results from NSES Macro-pacing:
Maths topics covered: 75% of HOA but just 26% of DET learners were in schools where more than 25 different maths topics were covered
Literacy/language exercises: 33 in DET schools, 75 in HoA schools
Some teachers may cover new topics slowly to accommodate prior learning deficits
However, insufficient curriculum coverage a major indicator of inefficiency
Resources: Only weak evidence that pupil-teacher ratios, class sizes, teacher knowledge and access to textbooks and information technology improve outcomes
Teacher and management “efficiency” variables have a significant positive effect on learner performance, e.g.
Existence of curriculum planning for a full year
A functional timetable
Good-quality inventories for learning and teaching support materials (LTSM)
Low teacher absenteeism, up-to-date assessment records
Various measures of curriculum coverage 23<br>
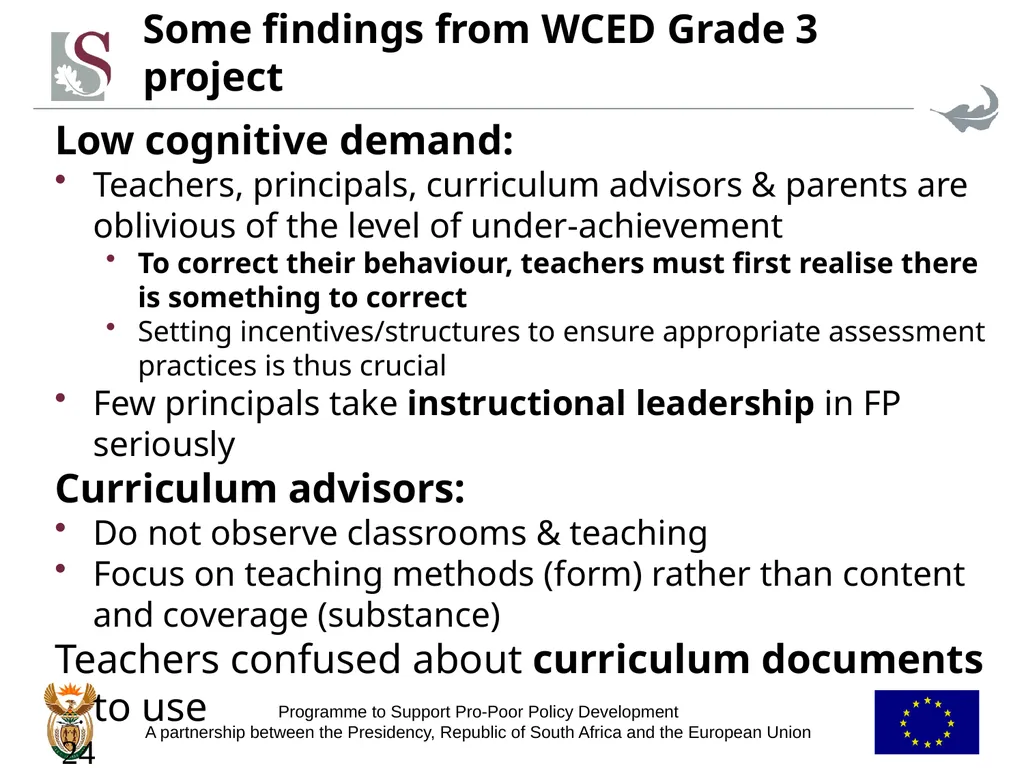
slide24. Some findings from WCED Grade 3 project Low cognitive demand:
Teachers, principals, curriculum advisors & parents are oblivious of the level of under-achievement
To correct their behaviour, teachers must first realise there is something to correct
Setting incentives/structures to ensure appropriate assessment practices is thus crucial
Few principals take instructional leadership in FP seriously
Curriculum advisors:
Do not observe classrooms & teaching
Focus on teaching methods (form) rather than content and coverage (substance)
Teachers confused about curriculum documents to use 24<br>
slide25. Classroom observations: Literacy & numeracy Literacy
Limited opportunities to handle books
Limited teaching of reading and writing
Read and write mainly isolated words
Little emphasis on comprehension of text
Little elaboration on learner responses
Reading largely collectivised
Little vocabulary & spelling development or teaching of phonics
Numeracy
Teachers lack theory of how children develop number concepts
Use mainly concrete methods for solving problems
Everyday knowledge obscures learning of mathematics
Extremely slow pace
Low conceptual level of instruction 25<br>
slide26. WCED study: % of Gr. 3 learners who could verbally answer questions below (in home language) But ¾ of Gr.3 teachers said they covered times tables 3+ days per week
Yet barely half of teachers were confident that most of their learners could correctly answer “2 times 4”<br>
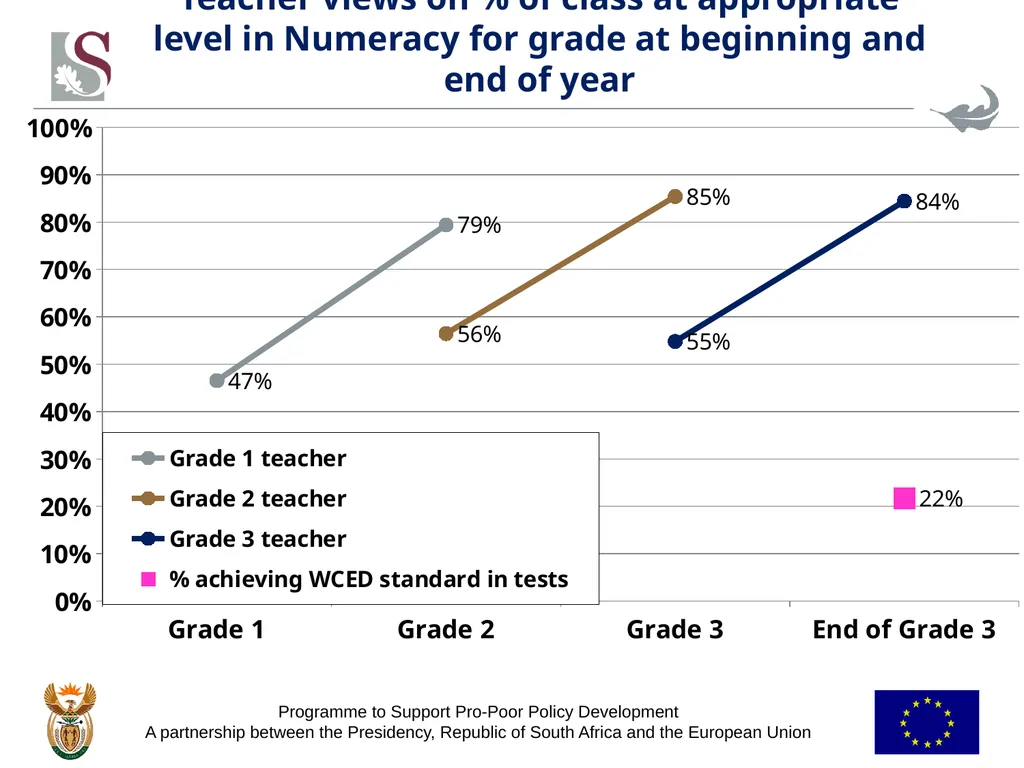
slide27. Teacher views on % of class at appropriate level in Numeracy for grade at beginning and end of year<br>
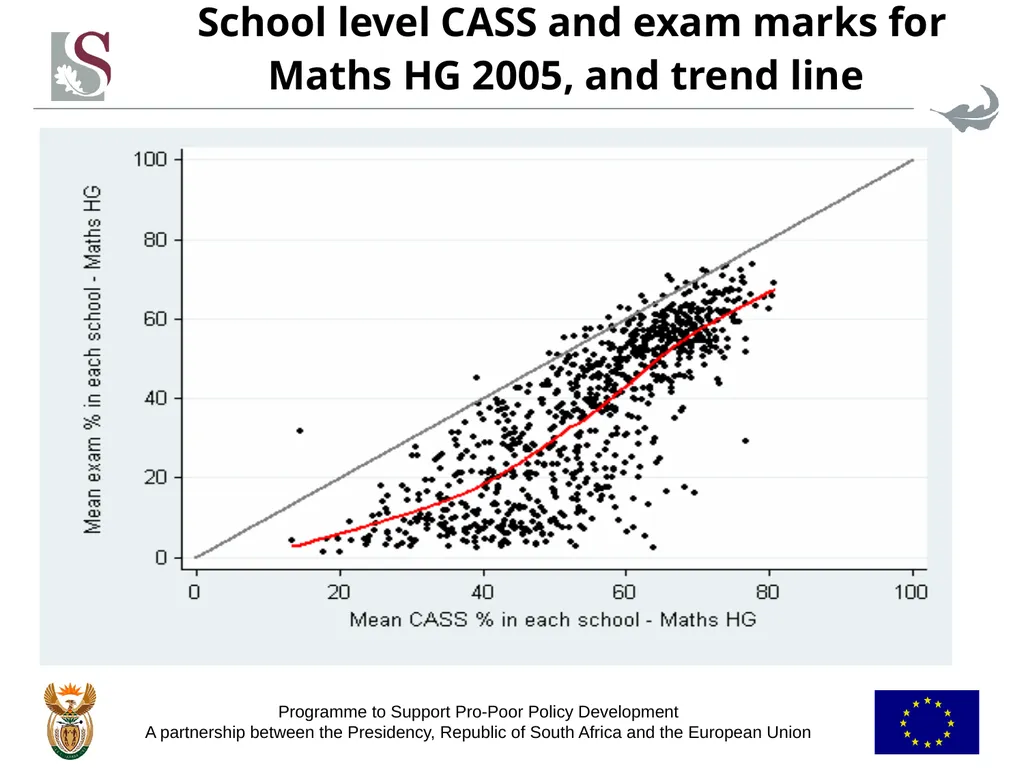
slide28. School level CASS and exam marks for Maths HG 2005, and trend line<br>
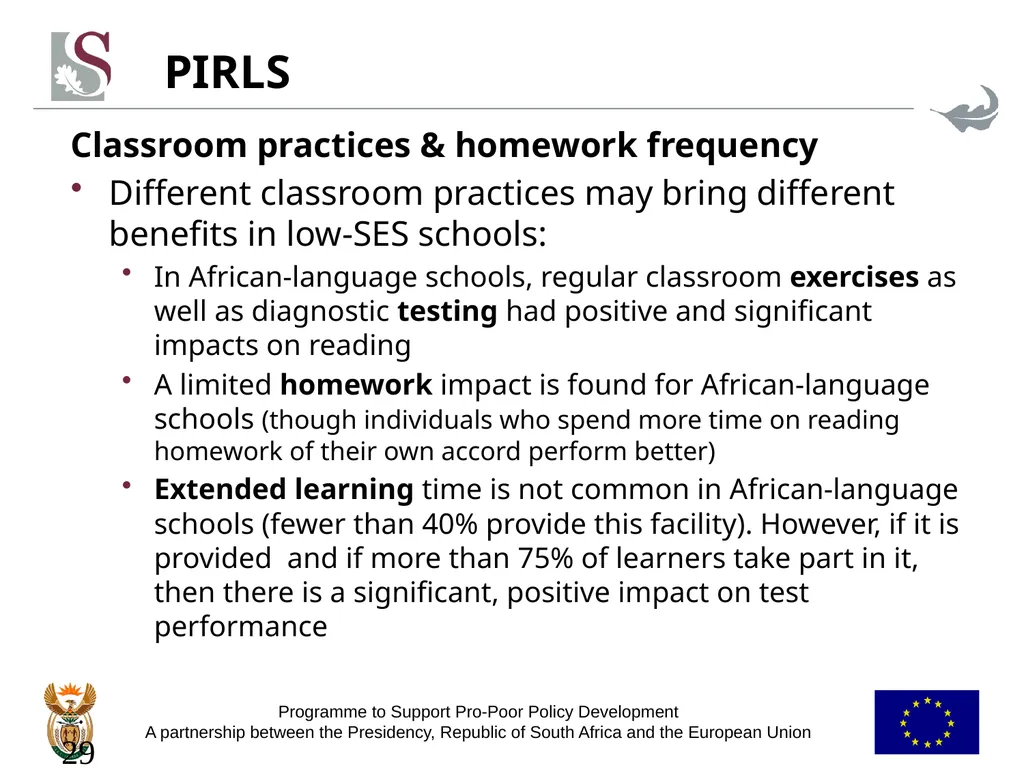
slide29. PIRLS Classroom practices & homework frequency
Different classroom practices may bring different benefits in low-SES schools:
In African-language schools, regular classroom exercises as well as diagnostic testing had positive and significant impacts on reading
A limited homework impact is found for African-language schools (though individuals who spend more time on reading homework of their own accord perform better)
Extended learning time is not common in African-language schools (fewer than 40% provide this facility). However, if it is provided and if more than 75% of learners take part in it, then there is a significant, positive impact on test performance 29<br>
slide30. PIRLS: Parental involvement At household level, positive effects on reading scores come from:
Help with homework
Parents’ education
Regular joint reading activities at home
Parent-child communication in language of test
School SES may affect the nature, quality and impact of parent involvement:
If parents doubt their own ability to make useful contributions they are less likely to become involved, or their involvement may not be of sufficient depth
This may explain the minor impact of parental involvement in poorer schools 30<br>
slide31. SACMEQ results & policy conclusions At least one year of quality pre-school education will assist poorer learners especially
Poor learners have less access to textbooks – evidence shows more textbooks can improve reading performance
Practical policies should be explored that encourage teachers to prescribe homework and enable learners to complete it
Teachers’ subject expertise has only a small positive impact
At Grade 6 level policy should perhaps rather focus on helping teachers to convey subject material 31<br>
slide32. Areas of policy to consider Teacher quality:
Subject knowledge
No great effect shown on outcomes
But this may reflect dysfunctionality of schools
Incentives and recruitment into teaching
Experience mainly at one school
Quality of teaching:
Assessment
Pacing (macro and micro)
Parental involvement
School leadership
Experience
Managerial capacity
Appointment procedure 32<br>
slide33. How weak is teacher subject knowledge? In SACMEQ III, Maths teachers participated in a Maths tests & English teachers in a reading test
Example of one answer on a Maths test:
Most Grade 6 Maths teachers (57%) thought the answer was 15 percent (presumably they just calculated 75 minus 60 =15 !!!)
Only 24% of Maths teachers got this right, i.e. answered 25% 33<br>
slide34. Policy directions Importance of accountability structures in public sector:
In schools, accountability needs to focus on time, coverage, assessment
Principals need to take instructional leadership seriously
Importance of information:
Teachers must know
Appropriate level of cognitive demand
Required level and pace of coverage are
Parents/children need to know how they perform
Testing and information flows are thus crucial
Feedback is crucial – to convert data into information, to allow accountability 34<br>
slide35. Policy directions (cont.) Specific interventions:
Quality pre-schools
Books (textbooks, workbooks, readers, library books) from early grades
But library model of provision within schools has collapsed – alternative models need attention
Homework
Assessment practices – cross-marking, etc.
Teacher subject knowledge – long term issue (recruitment, entry requirements)
Appointment and contracts of principals 35<br>
slide36. Taking library books home from school 36<br>
Department of Economics, Stellenbosch University
PSPPD Project – 28 March 2011<br>
slide2. Questions posed What are major fault-lines in our education and skills development system?
What is extent of underperformance of SA school system?
What factors drive underperformance of SA school system?
How can flow from school to post-school be improved, and scale & quality of post-school learning be expanded?
Outcome targets: Actual for 2014, potential for 2025?
What are the ten most effective interventions to improve education outcomes by 2020-2025?
How have countries facing similar problems turned their education systems around? 2<br>
slide3. Issues SA school performance in perspective:
Schools and the labour market
Weak performance, even in African context
Poverty cannot explain this – SA’s poor fare worse than Africa’s poor
The school system has two parts, one functioning fairly well, the other extremely weakly
Resources bring little improvement in weak schools, due to functionality issues
Features of poorly functioning schools:
Slow macro pacing, poor use of instructional time, low curriculum coverage
Low cognitive demand, weak assessment, little feedback
Lack of textbooks/workbooks/reading material (some teachers think textbooks and workbooks are ‘not applicable’ in FP; libraries seldom function)
Problems with second language teaching and learning
Policy directions 3<br>
slide4. SA’s dualistic school system and labour market High productivity jobs & incomes
±10% of labour force – mainly professional, managerial & skilled jobs
Requires graduates, good quality matric, or good vocational skills
Historically mainly whites Low productivity jobs & incomes
Often manual or low skill jobs
Limited or low quality education
Minimum wage can exceed their productivity High quality schools
±10% of schools, mainly ex-white, but racial composition changed
Produce strong cognitive skills
Teachers well qualified, schools function well, good assessment, parents involved Low quality schools
Produce very weak cognitive skills
Teachers less qualified, de-motiva-ted, many schools dysfunctional, weak assessment, little parental involvement, strong union presence
Mainly former black (DET) schools Big demand for good schools, despite fees
A few schools cross the divide Vocational training
Affirmative action Some talented, motivated or lucky students manage the transition<br>
slide5. Education affects labour market outcomes 5 Employment probability, 2005
(conditional) Good education provides access to top end of labour market – (better) jobs, higher wages
Skills shortage at top end causes a wage premium
Oversupply of unskilled workers depresses wages at bottom end
Race between demand and supply of skills will determine skills premium
This premium and the distribution of educational attainment are currently central to SA income inequality<br>
slide6. Education also determines individual prospects – with a potential vicious circle of weak education and poverty<br>
slide7. Black matriculants, 1982-2007 (’000) Potentially holds back economic growth and black social mobility<br>
slide8. Literacy score in PIRLS 2006<br>
slide9. % below low international benchmark (400) in PIRLS 2006 (Gr.4; in SA Gr.5) These are “very low reading achievers”, “at serious risk of not learning how to read” (Trong 2009) – yet quite a number of them eventually pass matric<br>
slide10. Mean Maths score in TIMMS 2003<br>
slide11. % of SA students exceeding performance at 75th percentile of developed countries (“who would ‘make it’ economically in developed countries")<br>
slide12. Mean Reading scores (SACMEQ III) 12<br>
slide13. Mean Reading score for poorest 25% (SACMEQ III) 13<br>
slide14. Lowess regression on schools’ average maths score, SA & other SACMEQ countries<br>
slide15. Schools’ average maths score, SA vs. other SACMEQII countries<br>
slide16. Kernel density curves of matric average by race, 2005<br>
slide17. PIRLS reading scores by school type 17<br>
slide18. Gr.6 reading test scores by SES quintile 18<br>
slide19. Numeracy score by former dept & home language, NSES<br>
slide20. Literacy achievement by former department and grade, NSES<br>
slide21. Gap explains middle class flight to ex-white schools Numeracy score by SES, former dept and home language<br>
slide22. School & individual SES & Maths score, SACMEQIII 22<br>
slide23. Results from NSES Macro-pacing:
Maths topics covered: 75% of HOA but just 26% of DET learners were in schools where more than 25 different maths topics were covered
Literacy/language exercises: 33 in DET schools, 75 in HoA schools
Some teachers may cover new topics slowly to accommodate prior learning deficits
However, insufficient curriculum coverage a major indicator of inefficiency
Resources: Only weak evidence that pupil-teacher ratios, class sizes, teacher knowledge and access to textbooks and information technology improve outcomes
Teacher and management “efficiency” variables have a significant positive effect on learner performance, e.g.
Existence of curriculum planning for a full year
A functional timetable
Good-quality inventories for learning and teaching support materials (LTSM)
Low teacher absenteeism, up-to-date assessment records
Various measures of curriculum coverage 23<br>
slide24. Some findings from WCED Grade 3 project Low cognitive demand:
Teachers, principals, curriculum advisors & parents are oblivious of the level of under-achievement
To correct their behaviour, teachers must first realise there is something to correct
Setting incentives/structures to ensure appropriate assessment practices is thus crucial
Few principals take instructional leadership in FP seriously
Curriculum advisors:
Do not observe classrooms & teaching
Focus on teaching methods (form) rather than content and coverage (substance)
Teachers confused about curriculum documents to use 24<br>
slide25. Classroom observations: Literacy & numeracy Literacy
Limited opportunities to handle books
Limited teaching of reading and writing
Read and write mainly isolated words
Little emphasis on comprehension of text
Little elaboration on learner responses
Reading largely collectivised
Little vocabulary & spelling development or teaching of phonics
Numeracy
Teachers lack theory of how children develop number concepts
Use mainly concrete methods for solving problems
Everyday knowledge obscures learning of mathematics
Extremely slow pace
Low conceptual level of instruction 25<br>
slide26. WCED study: % of Gr. 3 learners who could verbally answer questions below (in home language) But ¾ of Gr.3 teachers said they covered times tables 3+ days per week
Yet barely half of teachers were confident that most of their learners could correctly answer “2 times 4”<br>
slide27. Teacher views on % of class at appropriate level in Numeracy for grade at beginning and end of year<br>
slide28. School level CASS and exam marks for Maths HG 2005, and trend line<br>
slide29. PIRLS Classroom practices & homework frequency
Different classroom practices may bring different benefits in low-SES schools:
In African-language schools, regular classroom exercises as well as diagnostic testing had positive and significant impacts on reading
A limited homework impact is found for African-language schools (though individuals who spend more time on reading homework of their own accord perform better)
Extended learning time is not common in African-language schools (fewer than 40% provide this facility). However, if it is provided and if more than 75% of learners take part in it, then there is a significant, positive impact on test performance 29<br>
slide30. PIRLS: Parental involvement At household level, positive effects on reading scores come from:
Help with homework
Parents’ education
Regular joint reading activities at home
Parent-child communication in language of test
School SES may affect the nature, quality and impact of parent involvement:
If parents doubt their own ability to make useful contributions they are less likely to become involved, or their involvement may not be of sufficient depth
This may explain the minor impact of parental involvement in poorer schools 30<br>
slide31. SACMEQ results & policy conclusions At least one year of quality pre-school education will assist poorer learners especially
Poor learners have less access to textbooks – evidence shows more textbooks can improve reading performance
Practical policies should be explored that encourage teachers to prescribe homework and enable learners to complete it
Teachers’ subject expertise has only a small positive impact
At Grade 6 level policy should perhaps rather focus on helping teachers to convey subject material 31<br>
slide32. Areas of policy to consider Teacher quality:
Subject knowledge
No great effect shown on outcomes
But this may reflect dysfunctionality of schools
Incentives and recruitment into teaching
Experience mainly at one school
Quality of teaching:
Assessment
Pacing (macro and micro)
Parental involvement
School leadership
Experience
Managerial capacity
Appointment procedure 32<br>
slide33. How weak is teacher subject knowledge? In SACMEQ III, Maths teachers participated in a Maths tests & English teachers in a reading test
Example of one answer on a Maths test:
Most Grade 6 Maths teachers (57%) thought the answer was 15 percent (presumably they just calculated 75 minus 60 =15 !!!)
Only 24% of Maths teachers got this right, i.e. answered 25% 33<br>
slide34. Policy directions Importance of accountability structures in public sector:
In schools, accountability needs to focus on time, coverage, assessment
Principals need to take instructional leadership seriously
Importance of information:
Teachers must know
Appropriate level of cognitive demand
Required level and pace of coverage are
Parents/children need to know how they perform
Testing and information flows are thus crucial
Feedback is crucial – to convert data into information, to allow accountability 34<br>
slide35. Policy directions (cont.) Specific interventions:
Quality pre-schools
Books (textbooks, workbooks, readers, library books) from early grades
But library model of provision within schools has collapsed – alternative models need attention
Homework
Assessment practices – cross-marking, etc.
Teacher subject knowledge – long term issue (recruitment, entry requirements)
Appointment and contracts of principals 35<br>
slide36. Taking library books home from school 36<br>