
True Experiments: Multifactorial Designs Also



Description: True Experiments: Multifactorial Designs Also called Multifactorial Designs Two or more independent variables that are qualitatively different Each has two or more levels Can be within- or between-subjects Can be manipulated or measured IVs
Related Topics
Download Presentation
"True Experiments: Multifactorial Designs Also" is the property of its rightful owner. Permission is granted to download and print the materials on this website for personal, non-commercial use only, and to display it on your personal computer provided you do not modify the materials and that you retain all copyright notices contained in the materials. By downloading content from our website, you accept the terms of this agreement.
Presentation Transcript
slide1. True Experiments: Multifactorial Designs<br>
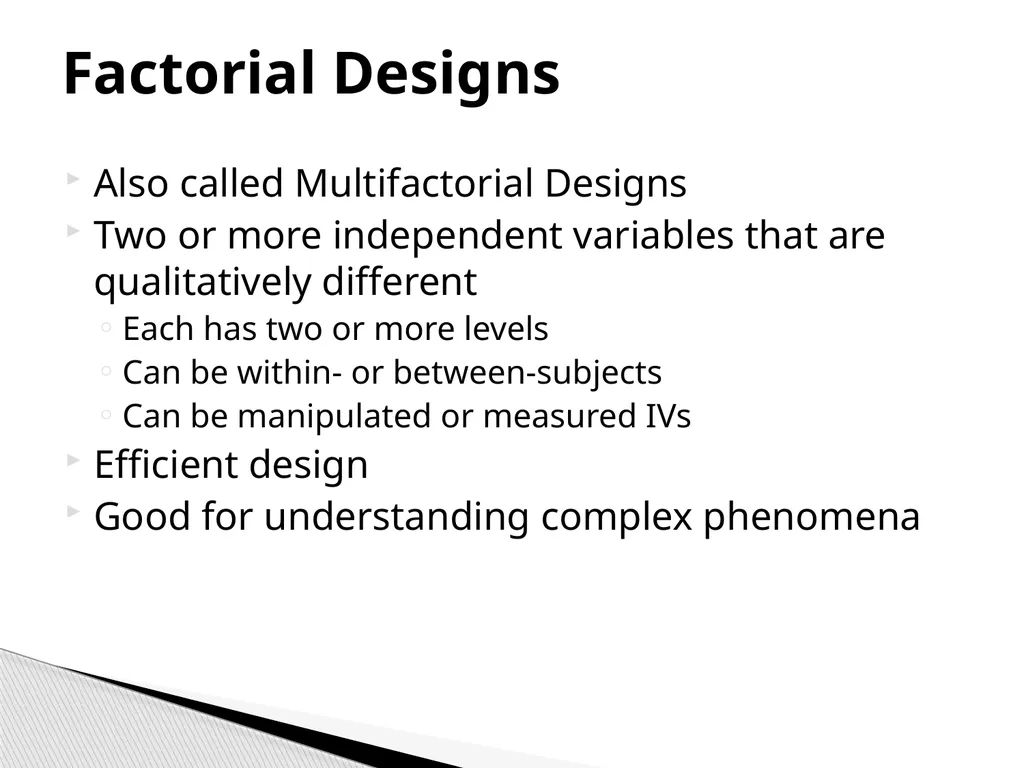
slide2. Also called Multifactorial Designs
Two or more independent variables that are qualitatively different
Each has two or more levels
Can be within- or between-subjects
Can be manipulated or measured IVs
Efficient design
Good for understanding complex phenomena Factorial Designs<br>
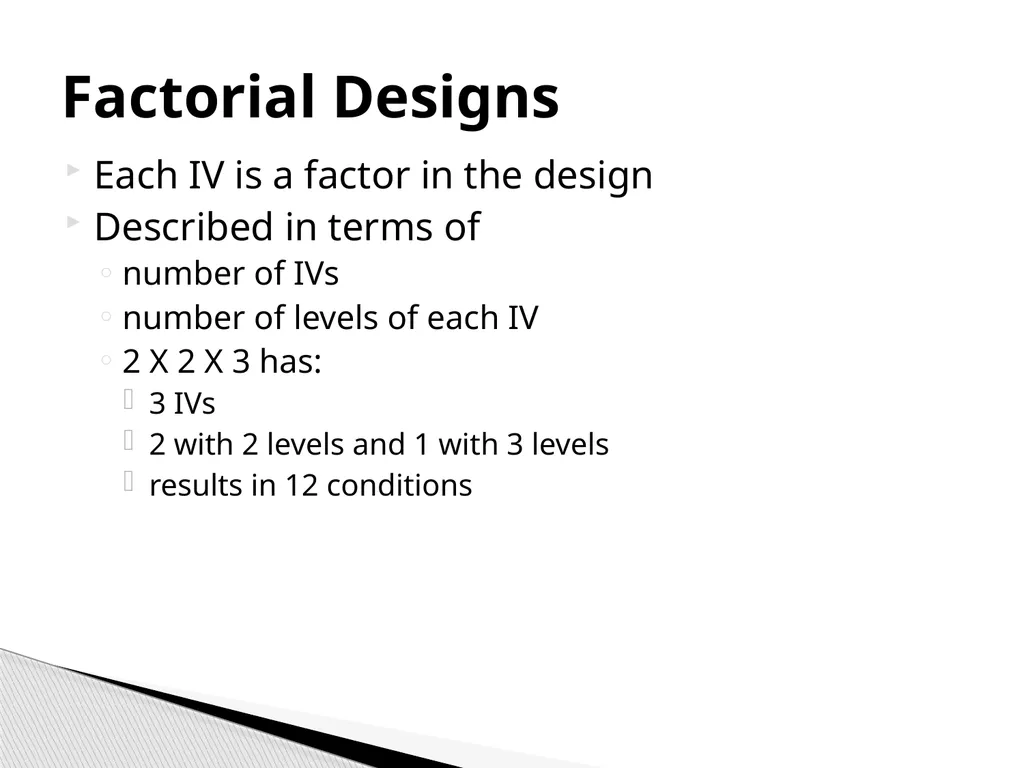
slide3. Each IV is a factor in the design
Described in terms of
number of IVs
number of levels of each IV
2 X 2 X 3 has:
3 IVs
2 with 2 levels and 1 with 3 levels
results in 12 conditions Factorial Designs<br>
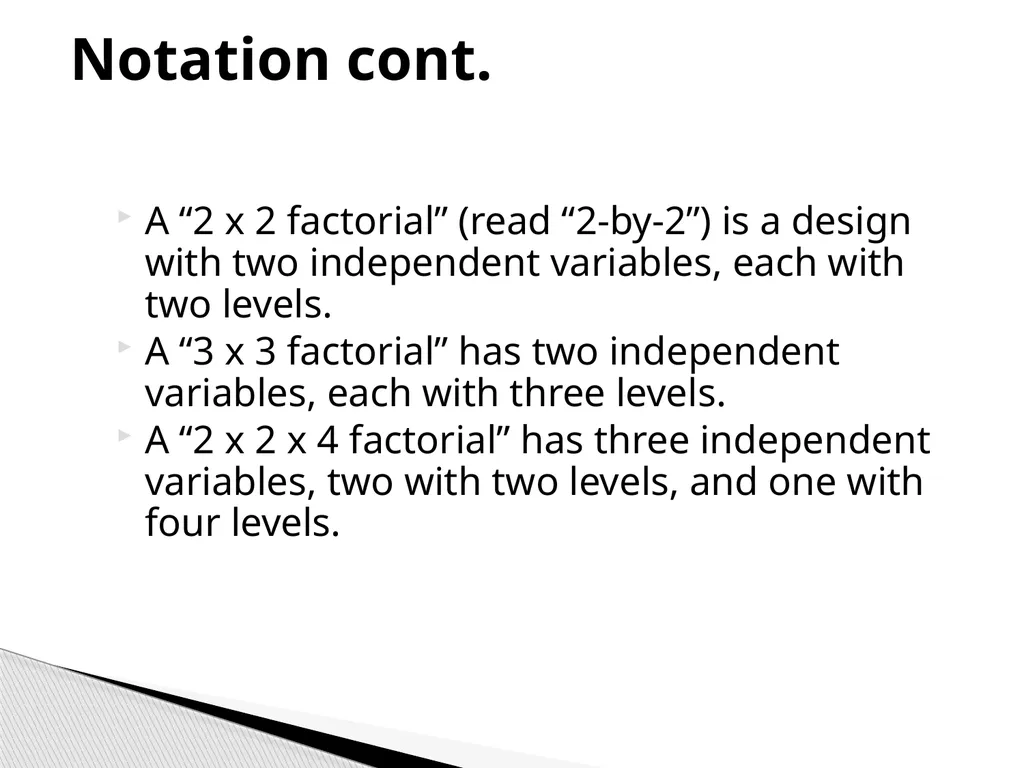
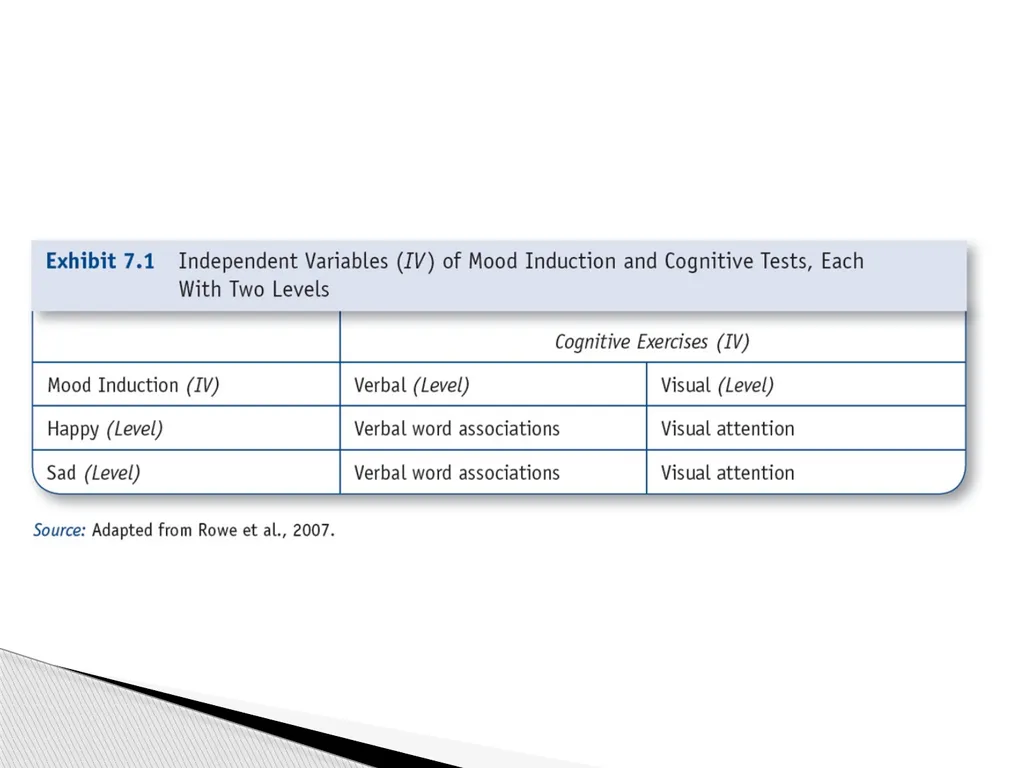
slide4. A “2 x 2 factorial” (read “2-by-2”) is a design with two independent variables, each with two levels.
A “3 x 3 factorial” has two independent variables, each with three levels.
A “2 x 2 x 4 factorial” has three independent variables, two with two levels, and one with four levels. Notation cont.<br>
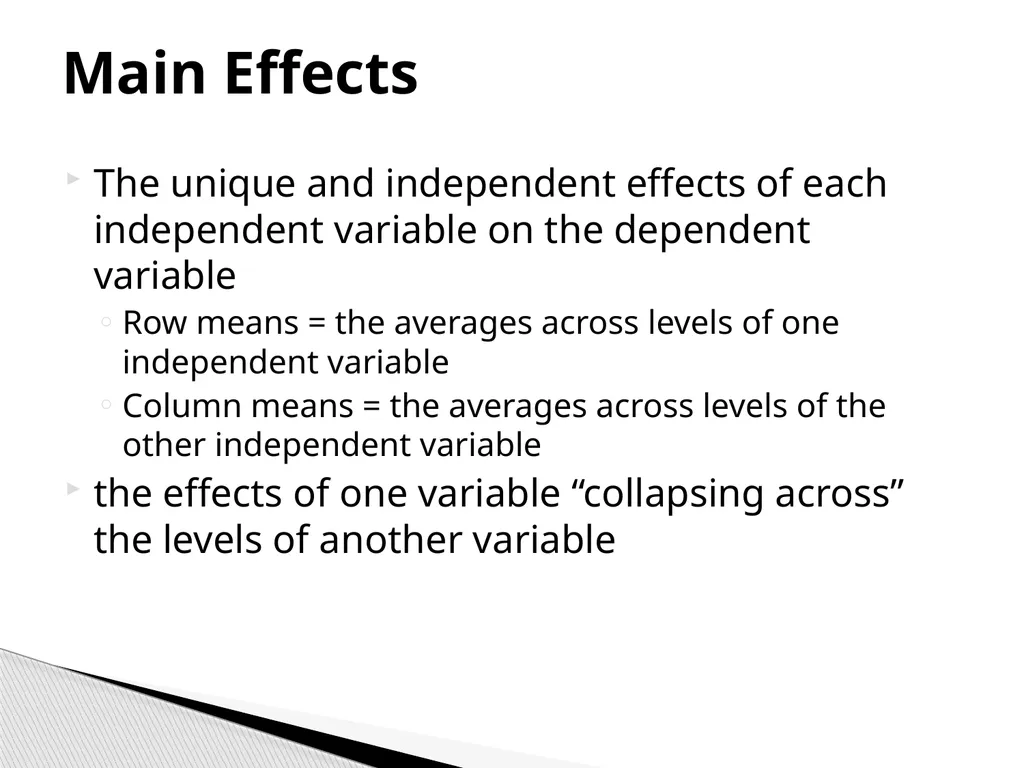
slide6. The unique and independent effects of each independent variable on the dependent variable
Row means = the averages across levels of one independent variable
Column means = the averages across levels of the other independent variable
the effects of one variable “collapsing across” the levels of another variable Main Effects<br>
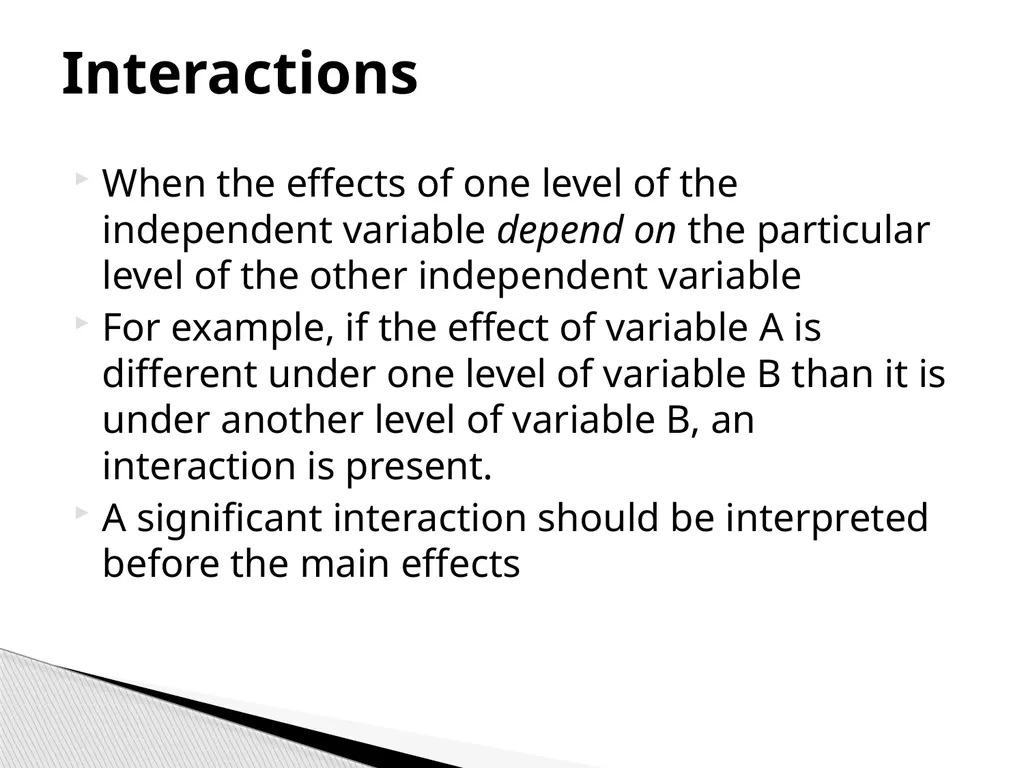
slide7. When the effects of one level of the independent variable depend on the particular level of the other independent variable
For example, if the effect of variable A is different under one level of variable B than it is under another level of variable B, an interaction is present.
A significant interaction should be interpreted before the main effects Interactions<br>
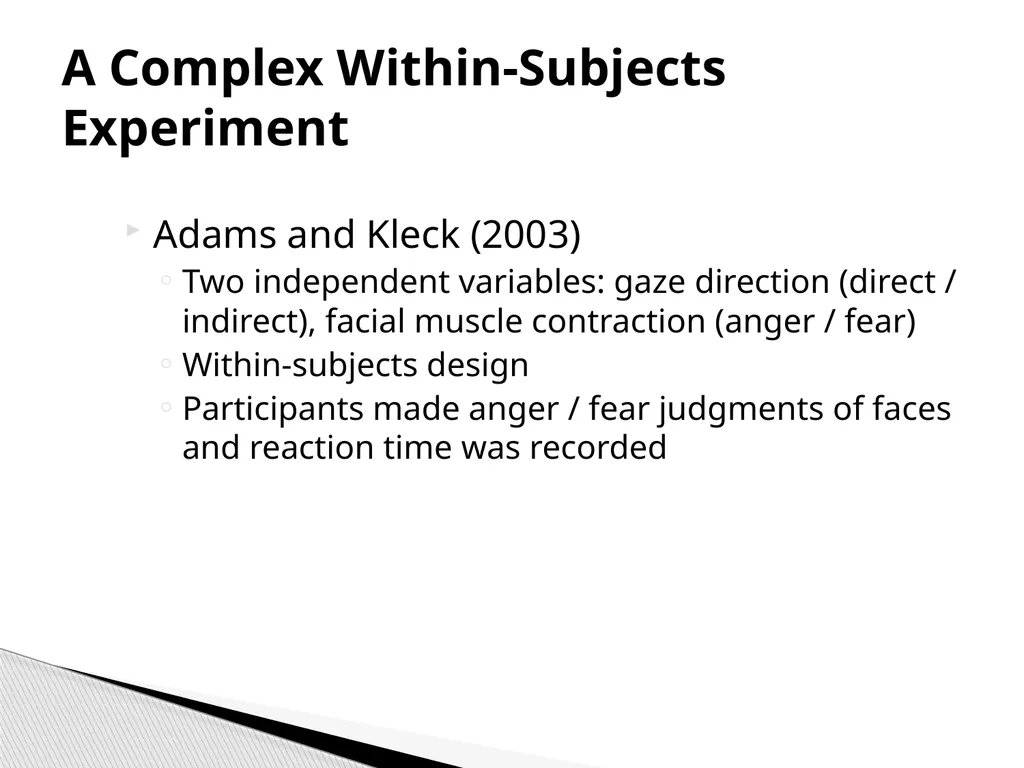
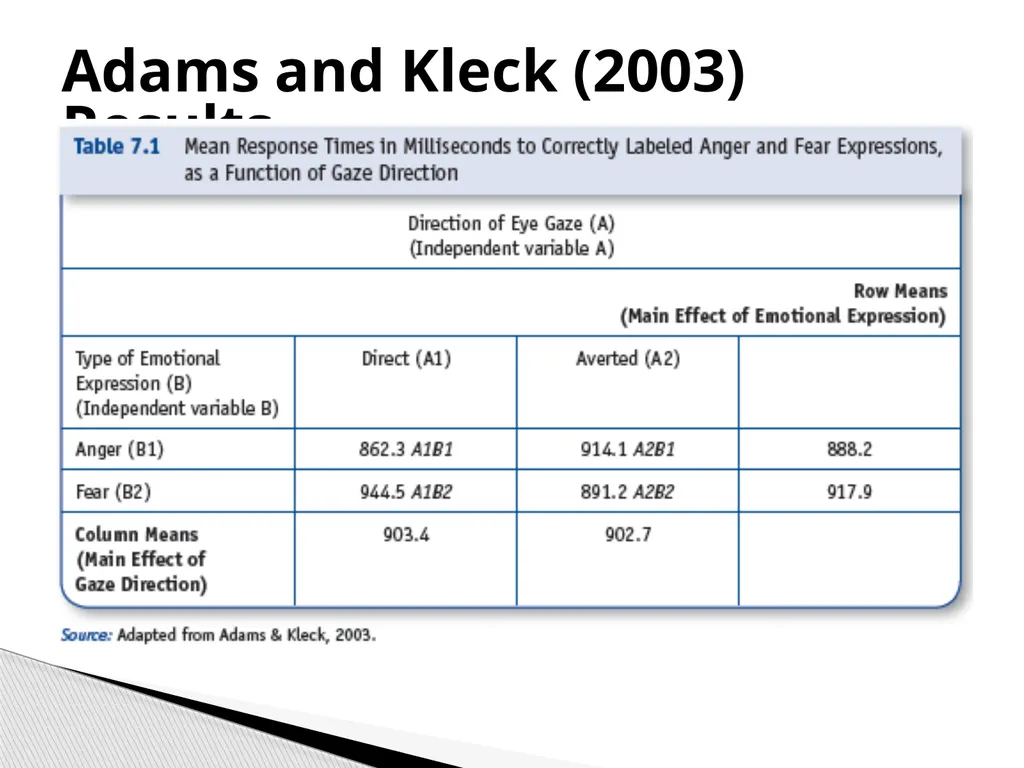
slide8. Adams and Kleck (2003)
Two independent variables: gaze direction (direct / indirect), facial muscle contraction (anger / fear)
Within-subjects design
Participants made anger / fear judgments of faces and reaction time was recorded A Complex Within-Subjects Experiment<br>
slide9. Adams and Kleck (2003) Results<br>
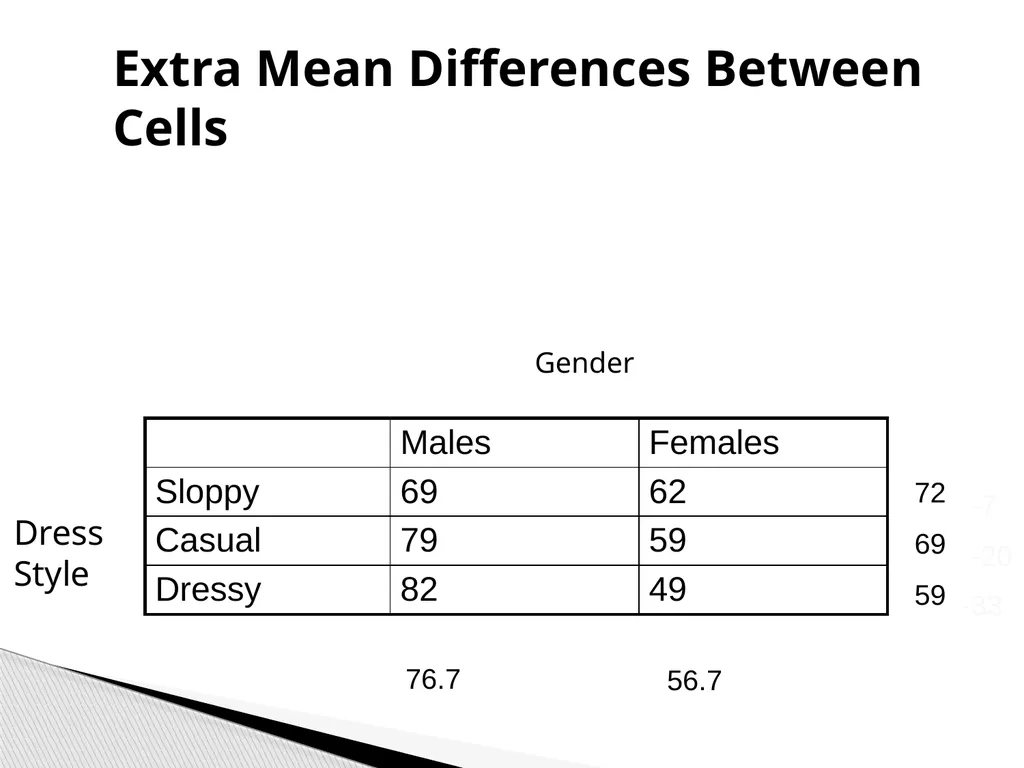
slide10. Extra Mean Differences Between Cells Gender Dress
Style 76.7 56.7 72 69 59 -7 -20 -33<br>
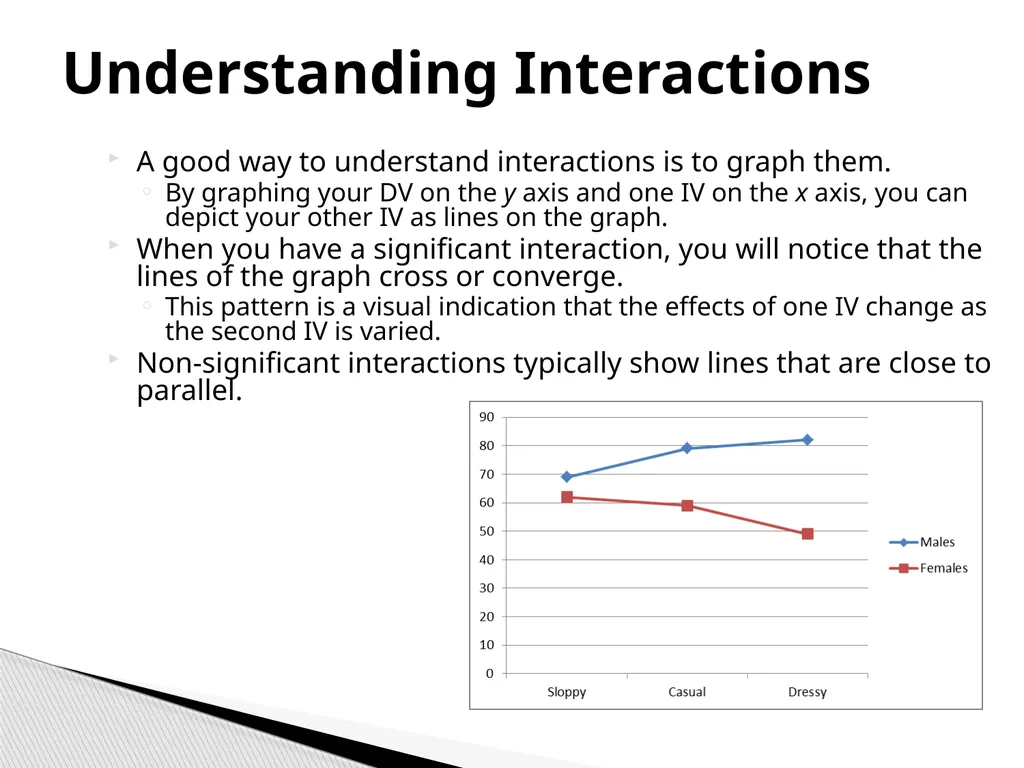
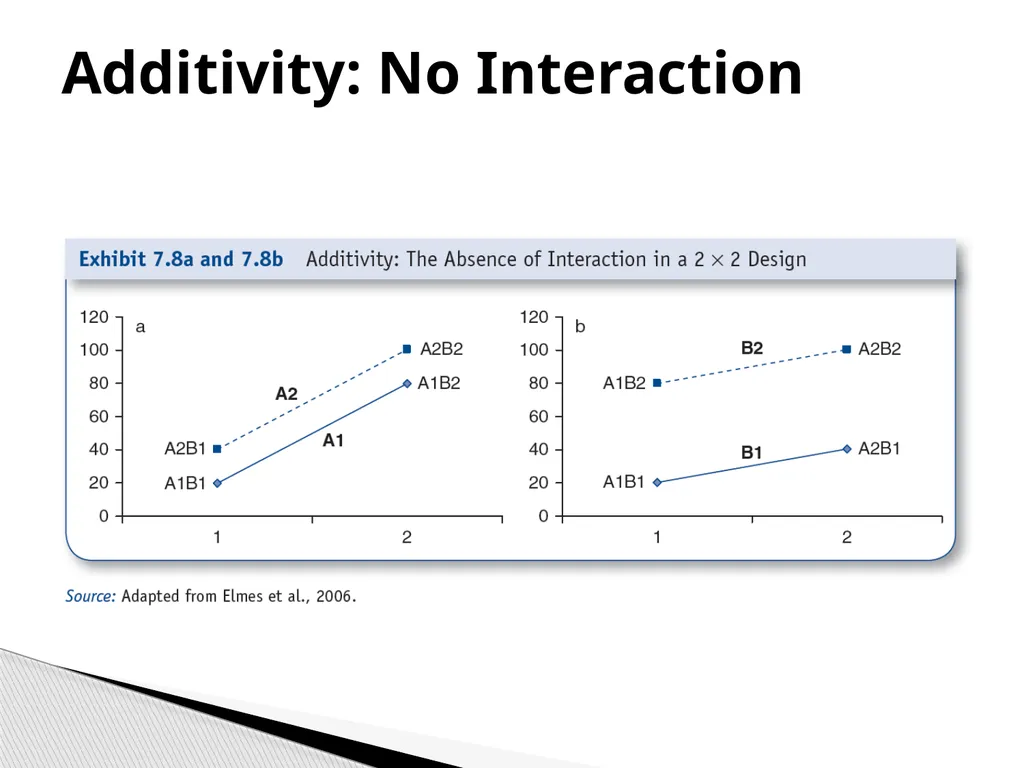
slide11. A good way to understand interactions is to graph them.
By graphing your DV on the y axis and one IV on the x axis, you can depict your other IV as lines on the graph.
When you have a significant interaction, you will notice that the lines of the graph cross or converge.
This pattern is a visual indication that the effects of one IV change as the second IV is varied.
Non-significant interactions typically show lines that are close to parallel. Understanding Interactions<br>
slide12. Additivity: No Interaction<br>
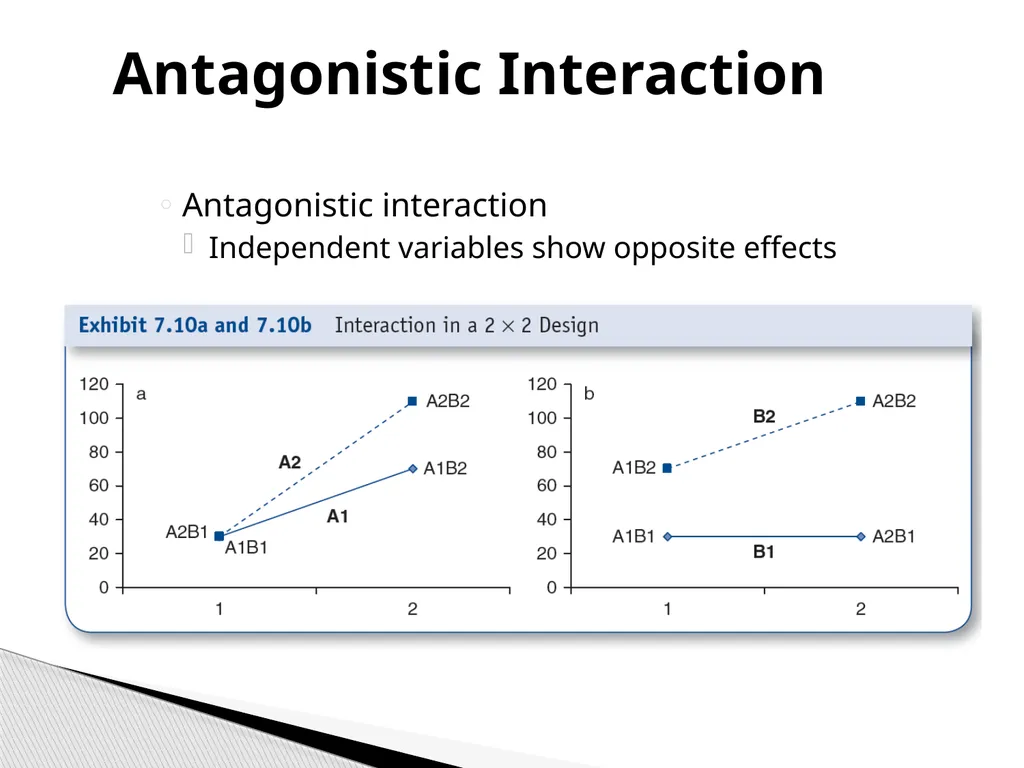
slide13. Antagonistic Interaction Antagonistic interaction
Independent variables show opposite effects<br>
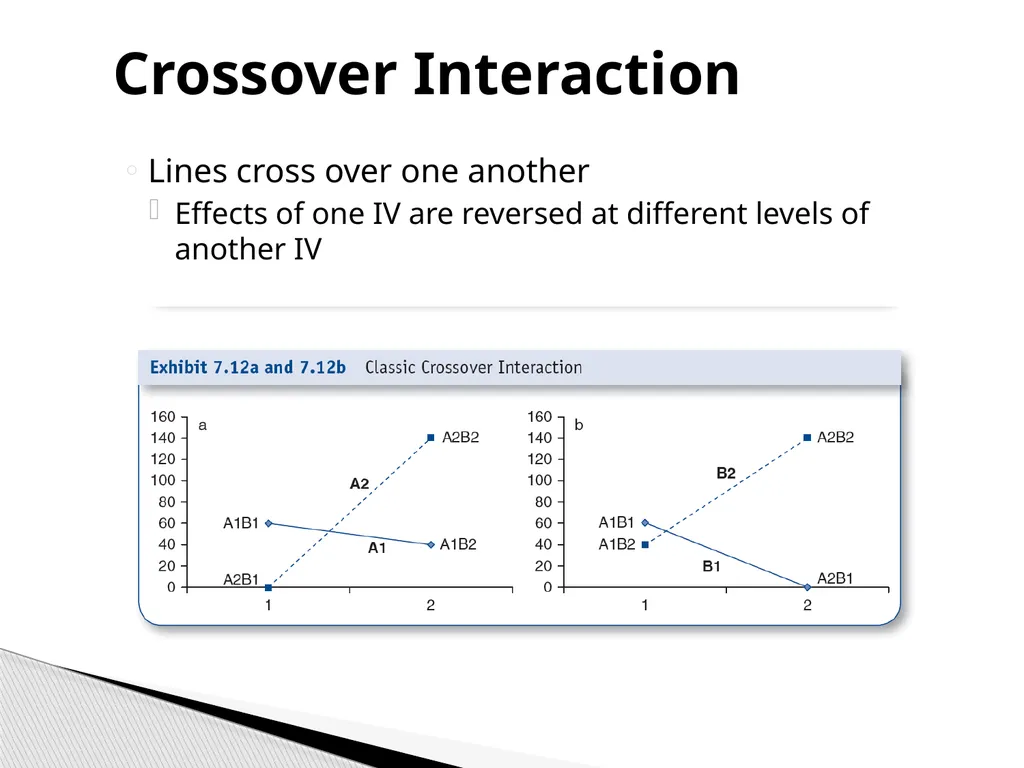
slide14. Crossover Interaction Lines cross over one another
Effects of one IV are reversed at different levels of another IV<br>
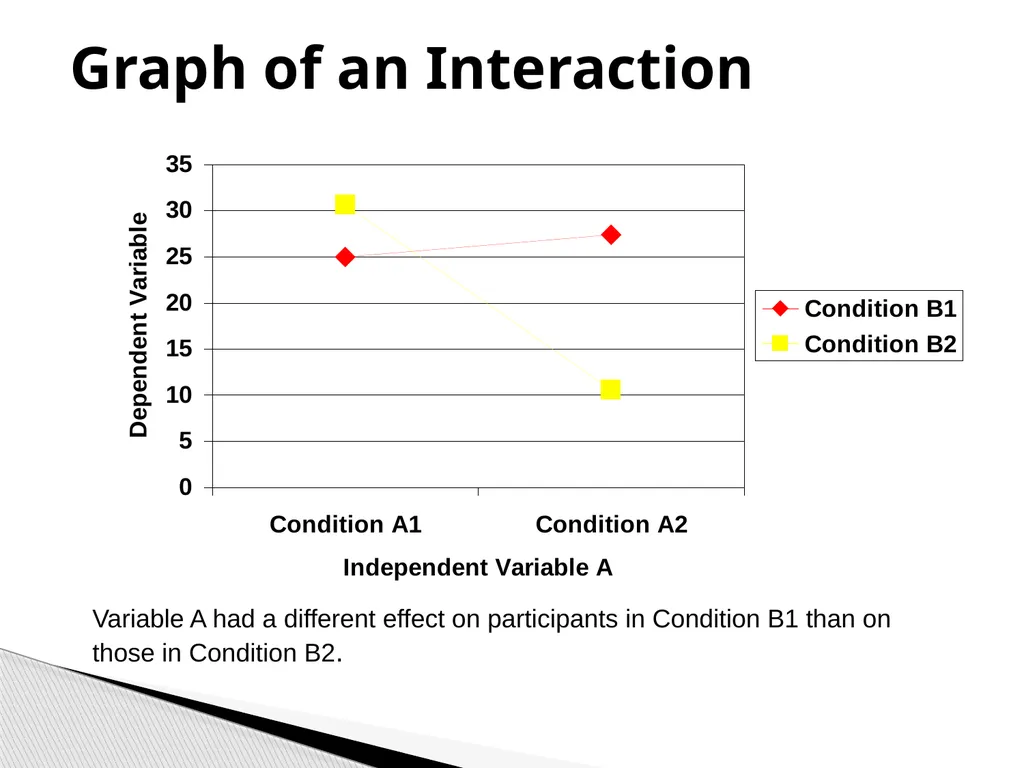
slide15. Graph of an Interaction Variable A had a different effect on participants in Condition B1 than on those in Condition B2.<br>
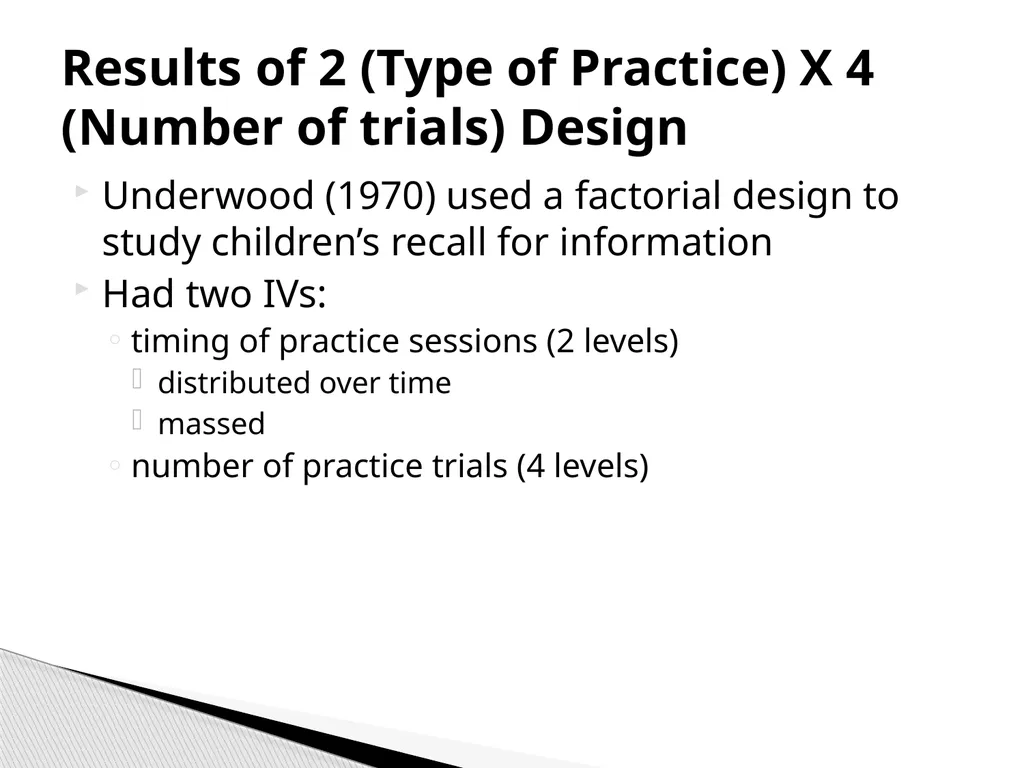
slide16. Underwood (1970) used a factorial design to study children’s recall for information
Had two IVs:
timing of practice sessions (2 levels)
distributed over time
massed
number of practice trials (4 levels) Results of 2 (Type of Practice) X 4 (Number of trials) Design<br>
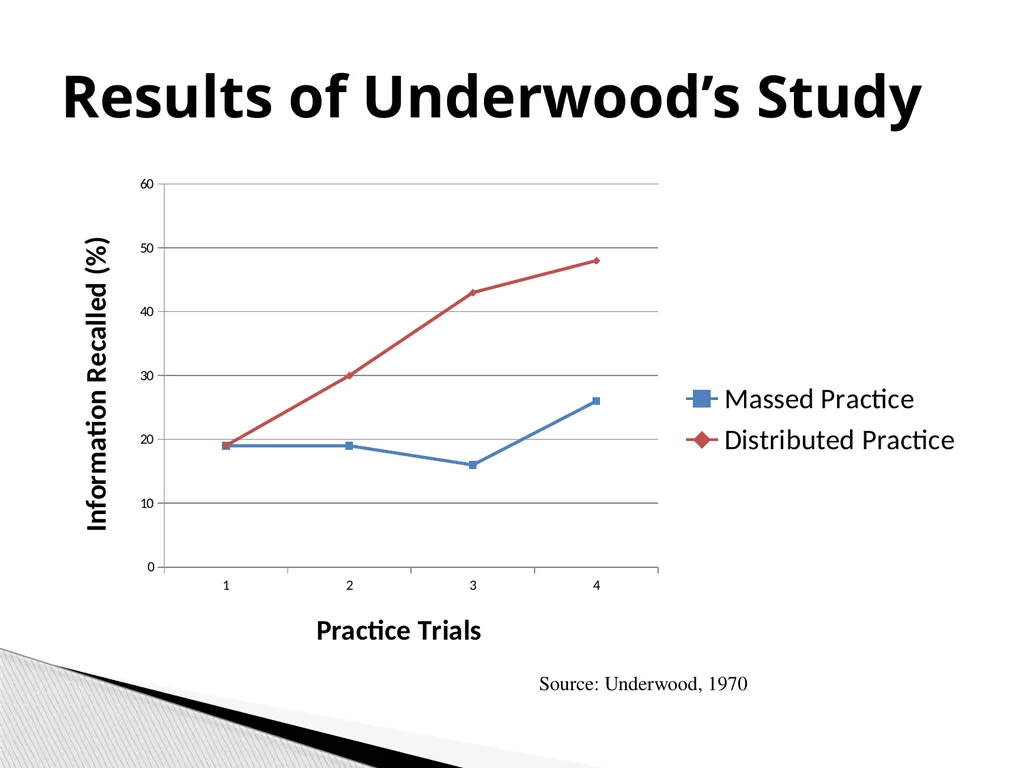
slide17. Source: Underwood, 1970 Results of Underwood’s Study<br>
slide18. The main effect for type of practice indicated that distributed practice was better than mass practice
The main effect for number of practice trials indicated that recall improved over the four trials
The interaction indicated that improvement was markedly better for the distributed practice trials
Note that effect across number of trials is non-linear Results<br>
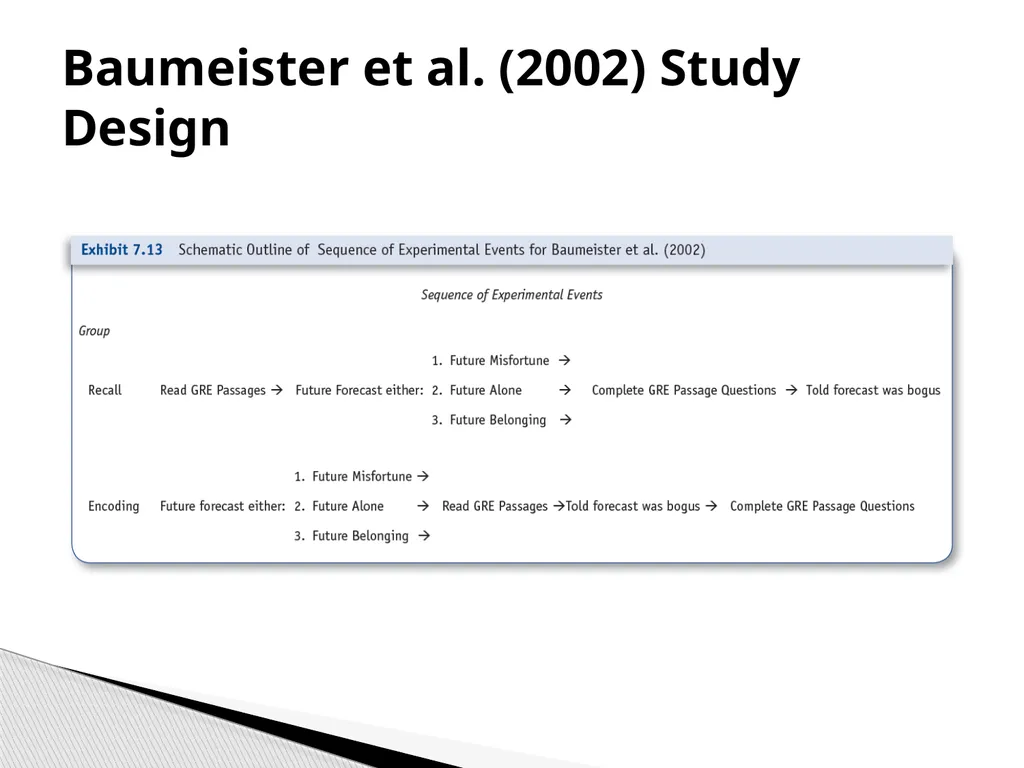
slide19. Baumeister, Twenge, & Nuss (2002)
Can feelings of social isolation influence our cognitive abilities?
Manipulated participants’ “future forecast” (alone, rich relationships, accident-prone)
Also manipulated the point at which the participant was told the forecast was bogus (after test/recall, before test/encoding) A Complex Between-Subjects 2x3 Experiment<br>
slide20. Baumeister et al. (2002) Study Design<br>
slide21. Results: Baumeister et al. (2002)<br>
slide22. Factorial designs can involve different subjects participating in each cell of the matrix (Between Subjects), the same subjects participating in each cell of the matrix (Within Subjects) or a combination where one (or more) factor(s) is manipulated between subjects and another factor(s) is manipulated within subjects (Mixed Design)
Factors can be experimental or nonexperimental (Combined Design) Mixed Design<br>
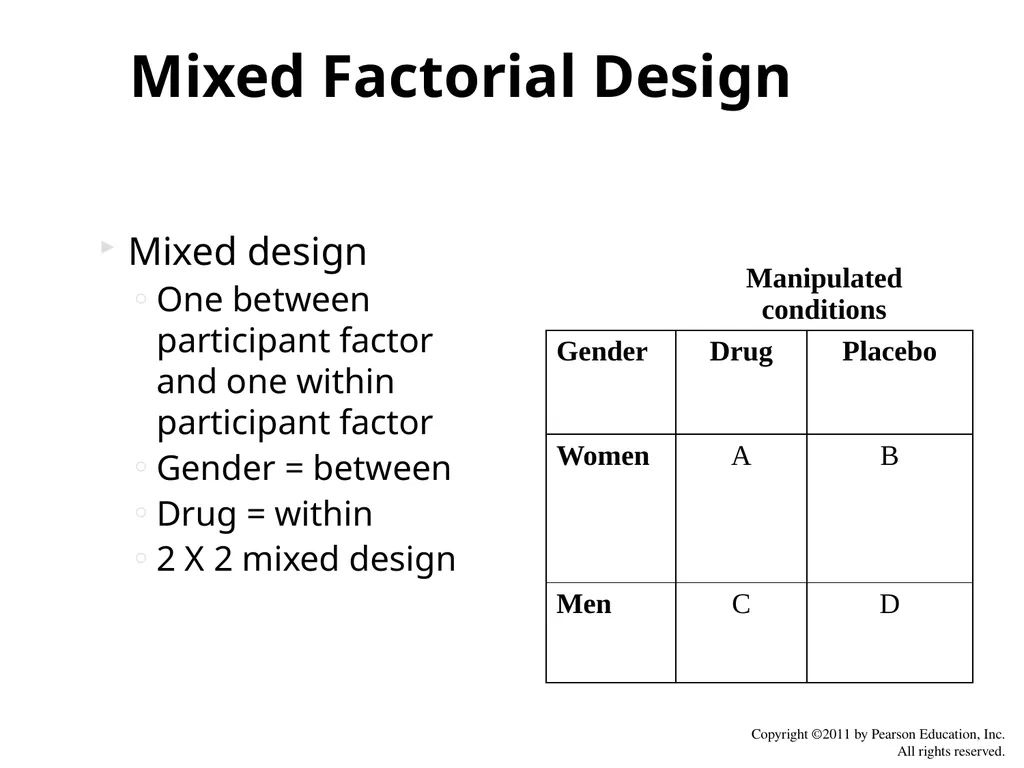
slide23. Mixed Factorial Design Mixed design
One between participant factor and one within participant factor
Gender = between
Drug = within
2 X 2 mixed design<br>
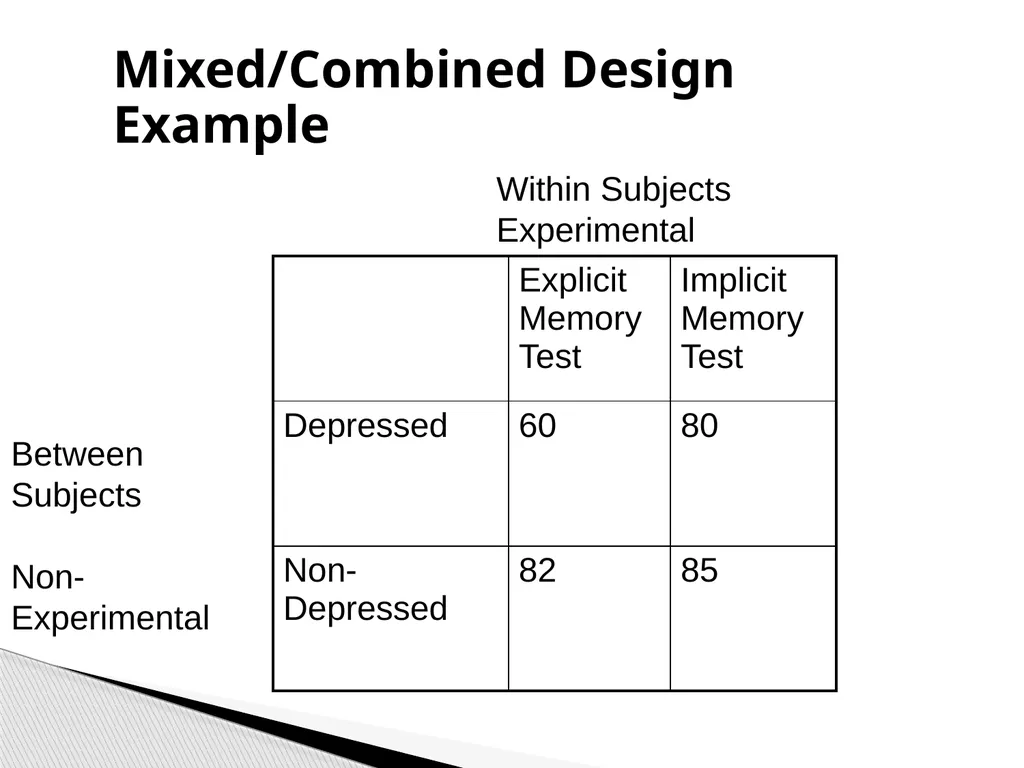
slide24. Mixed/Combined Design Example Between
Subjects
Non-
Experimental Within Subjects
Experimental<br>
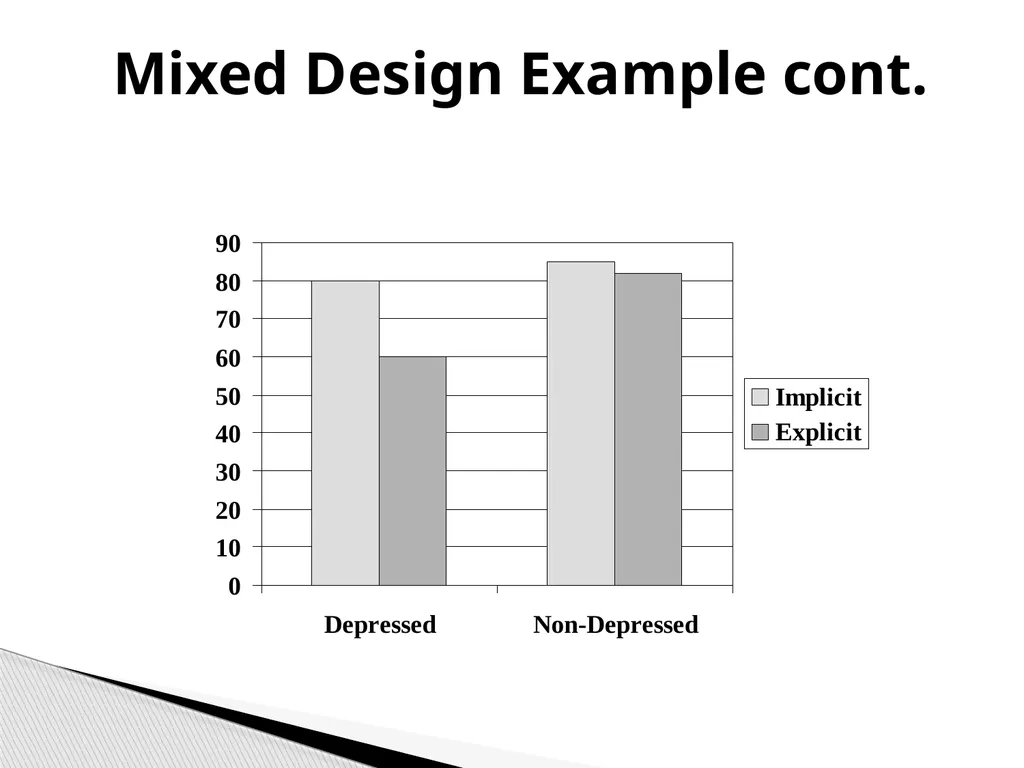
slide25. Mixed Design Example cont.<br>
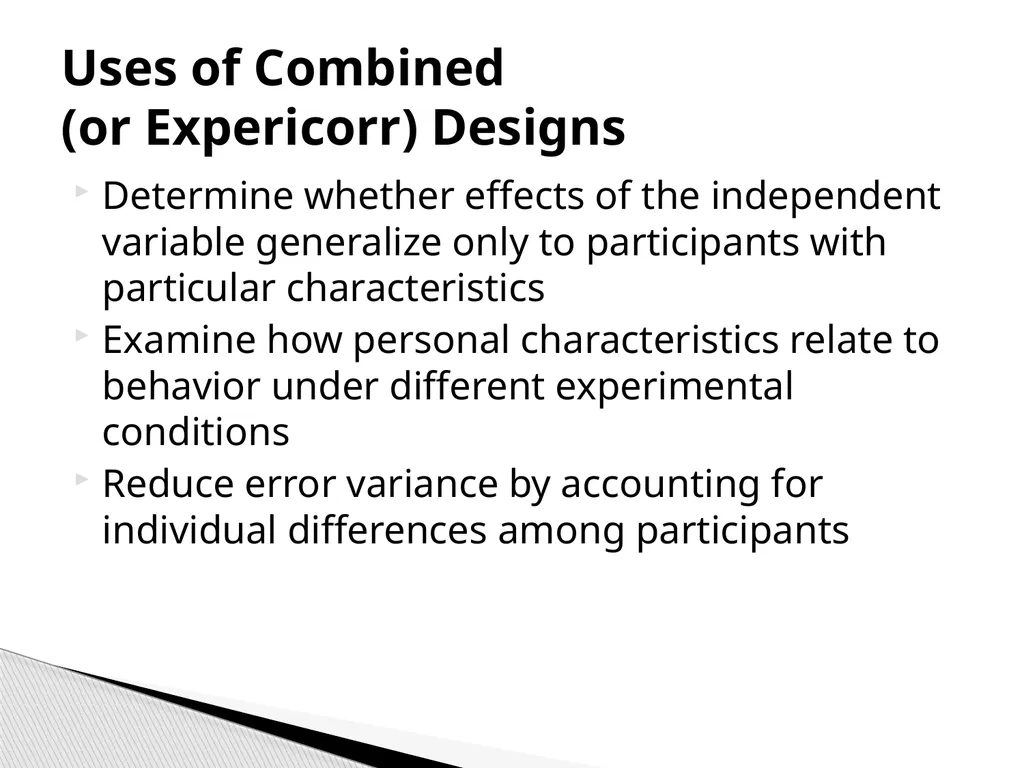
slide26. Determine whether effects of the independent variable generalize only to participants with particular characteristics
Examine how personal characteristics relate to behavior under different experimental conditions
Reduce error variance by accounting for individual differences among participants Uses of Combined (or Expericorr) Designs<br>
slide27. Median-split procedure – participants who score below the median on the participant variable are classified as low, and participants scoring above the median are classified as high
Extreme groups procedure – use only participants who score very high or low on the participant variable (such as lowest and highest 25%) Classifying Participants into Groups in Mixed Expericorr Designs<br>
slide28. Splitting participants on a continuous variable with a median split or extreme groups procedure may bias the results by missing effects that are actually present or obtaining effects that are statistical artifacts.
Instead of splitting participants into groups, researchers often use multiple regression analyses that allow them to keep the participant variable continuous. Classifying Participants<br>
slide29. If the manipulated independent variable affects the dependent variable, we can conclude that the independent variable caused this effect.
However, because participant variables are measured rather than manipulated, we cannot infer causation.
If a participant variable is involved in an interaction, we say that it moderates participants’ reactions to the independent variable (rather than causes them). Cautions in Interpreting Results from Expericorr Designs<br>
slide30. Three-way designs examine:
the main effects of three independent variables
three two-way interactions – the A X B interaction (ignoring C), the A X C interaction (ignoring B), the B X C interaction (ignoring A).
The three-way interaction of A X B X C
Fairly easy to interpret 3-way interactions
E.g. A X B Pattern differs for C1 and C2
But very difficult to interpret 4-way interactions and beyond Higher-Order Designs<br>
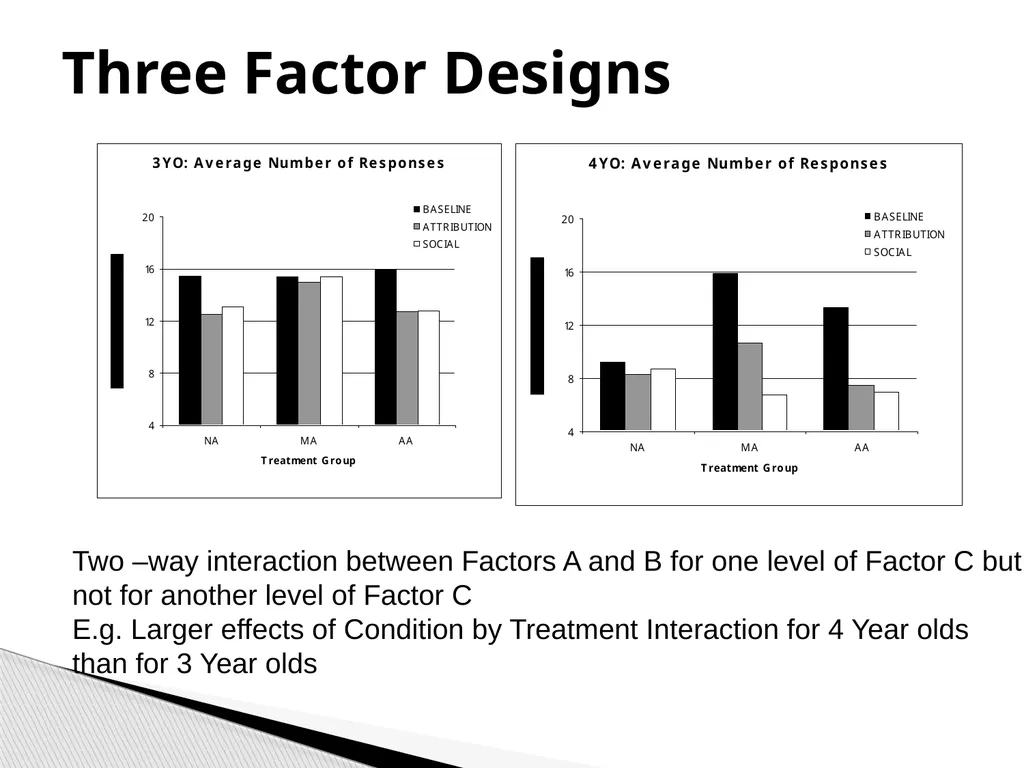
slide31. Three Factor Designs Two –way interaction between Factors A and B for one level of Factor C but
not for another level of Factor C
E.g. Larger effects of Condition by Treatment Interaction for 4 Year olds
than for 3 Year olds<br>
slide32. Include factor contributing to increased variance within groups (e.g. age) such that groups are now divided into the levels of this factor (young vs. older)
Doesn’t limit external validity like restricting range or holding constant does
One reason to do factorial studies Reducing Variance Between Groups<br>
slide33. 2 X 3 design
Country was a measured variable with 2 levels (US and Greece)
Location of litter was manipulated with 3 levels: Litter was left
in front yards
on sidewalk
on street curb Cross-Cultural Study of Speed of Litter Removal<br>
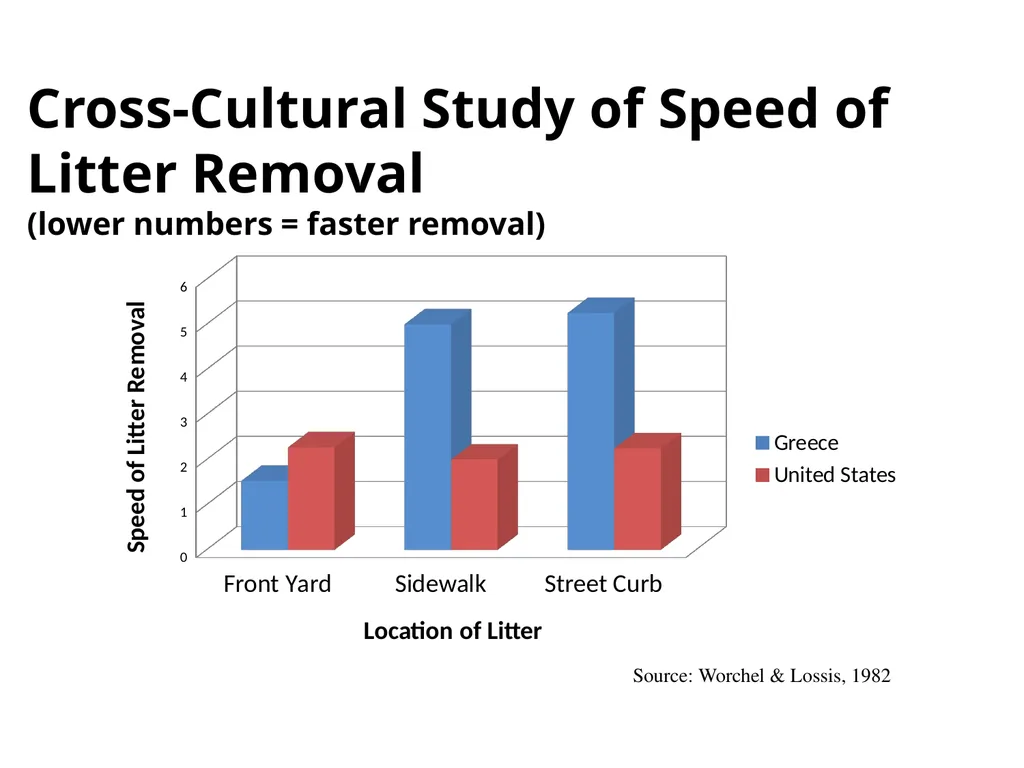
slide34. Cross-Cultural Study of Speed of Litter Removal (lower numbers = faster removal) Source: Worchel & Lossis, 1982<br>
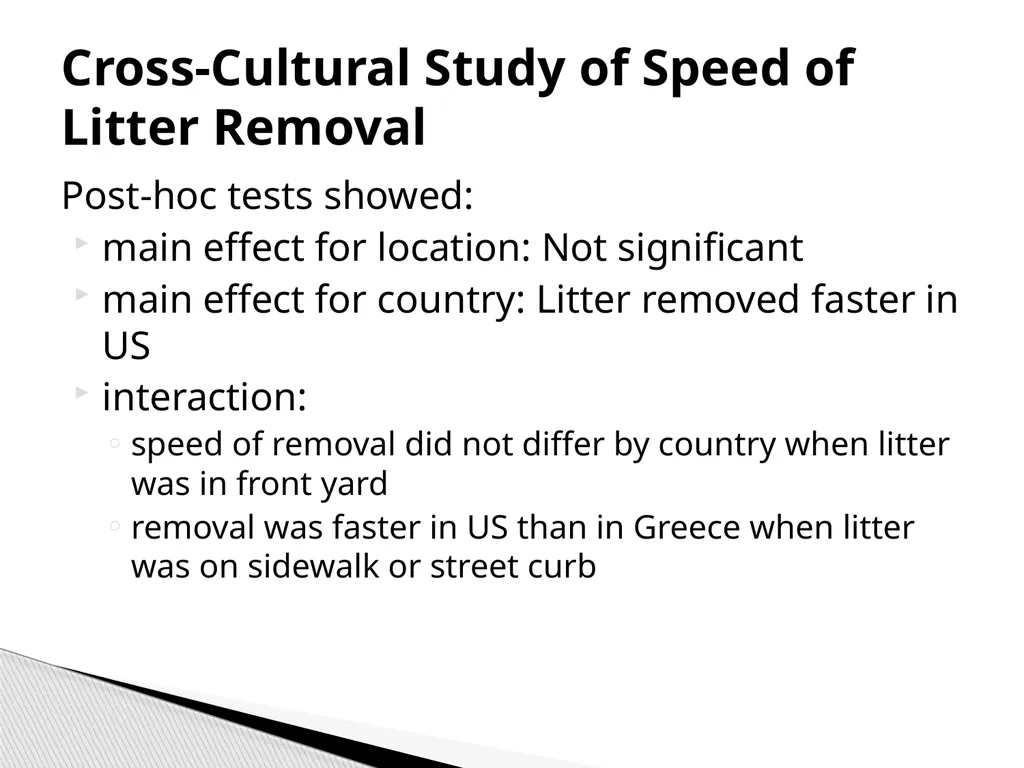
slide35. Post-hoc tests showed:
main effect for location: Not significant
main effect for country: Litter removed faster in US
interaction:
speed of removal did not differ by country when litter was in front yard
removal was faster in US than in Greece when litter was on sidewalk or street curb Cross-Cultural Study of Speed of Litter Removal<br>
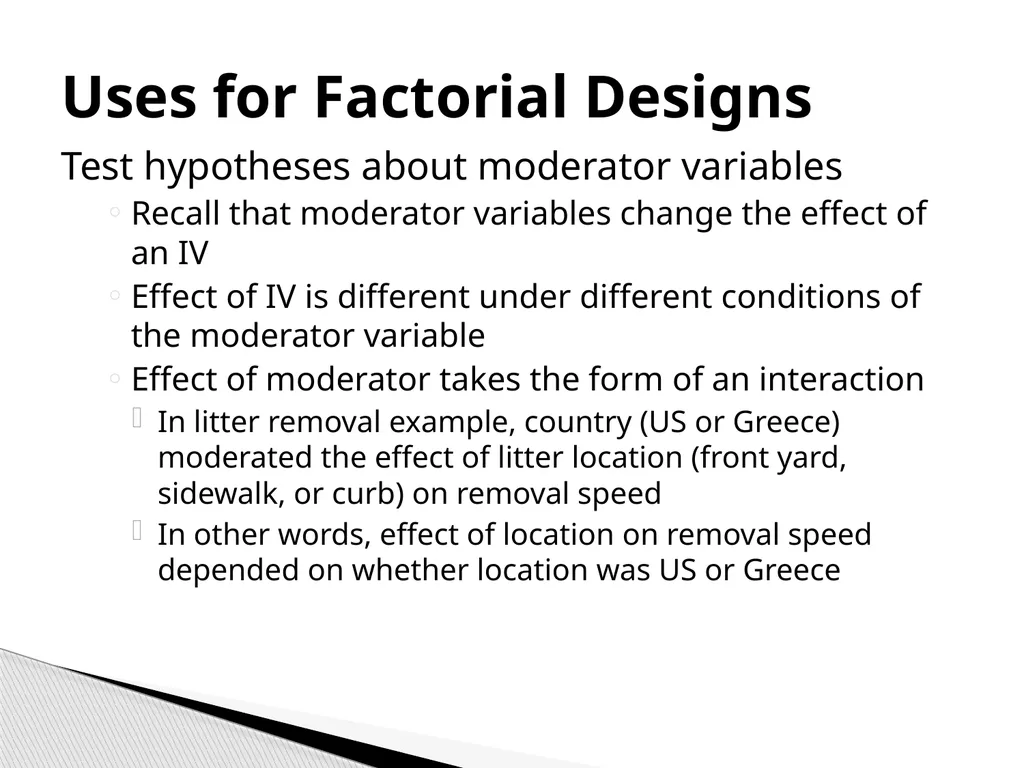
slide36. Test hypotheses about moderator variables
Recall that moderator variables change the effect of an IV
Effect of IV is different under different conditions of the moderator variable
Effect of moderator takes the form of an interaction
In litter removal example, country (US or Greece) moderated the effect of litter location (front yard, sidewalk, or curb) on removal speed
In other words, effect of location on removal speed depended on whether location was US or Greece Uses for Factorial Designs<br>
slide37. Detecting order effects
Controlling extraneous variance by blocking
Participants are grouped according to an extraneous variable and that variable is added as a factor in the design Uses for Factorial Designs<br>
slide2. Also called Multifactorial Designs
Two or more independent variables that are qualitatively different
Each has two or more levels
Can be within- or between-subjects
Can be manipulated or measured IVs
Efficient design
Good for understanding complex phenomena Factorial Designs<br>
slide3. Each IV is a factor in the design
Described in terms of
number of IVs
number of levels of each IV
2 X 2 X 3 has:
3 IVs
2 with 2 levels and 1 with 3 levels
results in 12 conditions Factorial Designs<br>
slide4. A “2 x 2 factorial” (read “2-by-2”) is a design with two independent variables, each with two levels.
A “3 x 3 factorial” has two independent variables, each with three levels.
A “2 x 2 x 4 factorial” has three independent variables, two with two levels, and one with four levels. Notation cont.<br>
slide6. The unique and independent effects of each independent variable on the dependent variable
Row means = the averages across levels of one independent variable
Column means = the averages across levels of the other independent variable
the effects of one variable “collapsing across” the levels of another variable Main Effects<br>
slide7. When the effects of one level of the independent variable depend on the particular level of the other independent variable
For example, if the effect of variable A is different under one level of variable B than it is under another level of variable B, an interaction is present.
A significant interaction should be interpreted before the main effects Interactions<br>
slide8. Adams and Kleck (2003)
Two independent variables: gaze direction (direct / indirect), facial muscle contraction (anger / fear)
Within-subjects design
Participants made anger / fear judgments of faces and reaction time was recorded A Complex Within-Subjects Experiment<br>
slide9. Adams and Kleck (2003) Results<br>
slide10. Extra Mean Differences Between Cells Gender Dress
Style 76.7 56.7 72 69 59 -7 -20 -33<br>
slide11. A good way to understand interactions is to graph them.
By graphing your DV on the y axis and one IV on the x axis, you can depict your other IV as lines on the graph.
When you have a significant interaction, you will notice that the lines of the graph cross or converge.
This pattern is a visual indication that the effects of one IV change as the second IV is varied.
Non-significant interactions typically show lines that are close to parallel. Understanding Interactions<br>
slide12. Additivity: No Interaction<br>
slide13. Antagonistic Interaction Antagonistic interaction
Independent variables show opposite effects<br>
slide14. Crossover Interaction Lines cross over one another
Effects of one IV are reversed at different levels of another IV<br>
slide15. Graph of an Interaction Variable A had a different effect on participants in Condition B1 than on those in Condition B2.<br>
slide16. Underwood (1970) used a factorial design to study children’s recall for information
Had two IVs:
timing of practice sessions (2 levels)
distributed over time
massed
number of practice trials (4 levels) Results of 2 (Type of Practice) X 4 (Number of trials) Design<br>
slide17. Source: Underwood, 1970 Results of Underwood’s Study<br>
slide18. The main effect for type of practice indicated that distributed practice was better than mass practice
The main effect for number of practice trials indicated that recall improved over the four trials
The interaction indicated that improvement was markedly better for the distributed practice trials
Note that effect across number of trials is non-linear Results<br>
slide19. Baumeister, Twenge, & Nuss (2002)
Can feelings of social isolation influence our cognitive abilities?
Manipulated participants’ “future forecast” (alone, rich relationships, accident-prone)
Also manipulated the point at which the participant was told the forecast was bogus (after test/recall, before test/encoding) A Complex Between-Subjects 2x3 Experiment<br>
slide20. Baumeister et al. (2002) Study Design<br>
slide21. Results: Baumeister et al. (2002)<br>
slide22. Factorial designs can involve different subjects participating in each cell of the matrix (Between Subjects), the same subjects participating in each cell of the matrix (Within Subjects) or a combination where one (or more) factor(s) is manipulated between subjects and another factor(s) is manipulated within subjects (Mixed Design)
Factors can be experimental or nonexperimental (Combined Design) Mixed Design<br>
slide23. Mixed Factorial Design Mixed design
One between participant factor and one within participant factor
Gender = between
Drug = within
2 X 2 mixed design<br>
slide24. Mixed/Combined Design Example Between
Subjects
Non-
Experimental Within Subjects
Experimental<br>
slide25. Mixed Design Example cont.<br>
slide26. Determine whether effects of the independent variable generalize only to participants with particular characteristics
Examine how personal characteristics relate to behavior under different experimental conditions
Reduce error variance by accounting for individual differences among participants Uses of Combined (or Expericorr) Designs<br>
slide27. Median-split procedure – participants who score below the median on the participant variable are classified as low, and participants scoring above the median are classified as high
Extreme groups procedure – use only participants who score very high or low on the participant variable (such as lowest and highest 25%) Classifying Participants into Groups in Mixed Expericorr Designs<br>
slide28. Splitting participants on a continuous variable with a median split or extreme groups procedure may bias the results by missing effects that are actually present or obtaining effects that are statistical artifacts.
Instead of splitting participants into groups, researchers often use multiple regression analyses that allow them to keep the participant variable continuous. Classifying Participants<br>
slide29. If the manipulated independent variable affects the dependent variable, we can conclude that the independent variable caused this effect.
However, because participant variables are measured rather than manipulated, we cannot infer causation.
If a participant variable is involved in an interaction, we say that it moderates participants’ reactions to the independent variable (rather than causes them). Cautions in Interpreting Results from Expericorr Designs<br>
slide30. Three-way designs examine:
the main effects of three independent variables
three two-way interactions – the A X B interaction (ignoring C), the A X C interaction (ignoring B), the B X C interaction (ignoring A).
The three-way interaction of A X B X C
Fairly easy to interpret 3-way interactions
E.g. A X B Pattern differs for C1 and C2
But very difficult to interpret 4-way interactions and beyond Higher-Order Designs<br>
slide31. Three Factor Designs Two –way interaction between Factors A and B for one level of Factor C but
not for another level of Factor C
E.g. Larger effects of Condition by Treatment Interaction for 4 Year olds
than for 3 Year olds<br>
slide32. Include factor contributing to increased variance within groups (e.g. age) such that groups are now divided into the levels of this factor (young vs. older)
Doesn’t limit external validity like restricting range or holding constant does
One reason to do factorial studies Reducing Variance Between Groups<br>
slide33. 2 X 3 design
Country was a measured variable with 2 levels (US and Greece)
Location of litter was manipulated with 3 levels: Litter was left
in front yards
on sidewalk
on street curb Cross-Cultural Study of Speed of Litter Removal<br>
slide34. Cross-Cultural Study of Speed of Litter Removal (lower numbers = faster removal) Source: Worchel & Lossis, 1982<br>
slide35. Post-hoc tests showed:
main effect for location: Not significant
main effect for country: Litter removed faster in US
interaction:
speed of removal did not differ by country when litter was in front yard
removal was faster in US than in Greece when litter was on sidewalk or street curb Cross-Cultural Study of Speed of Litter Removal<br>
slide36. Test hypotheses about moderator variables
Recall that moderator variables change the effect of an IV
Effect of IV is different under different conditions of the moderator variable
Effect of moderator takes the form of an interaction
In litter removal example, country (US or Greece) moderated the effect of litter location (front yard, sidewalk, or curb) on removal speed
In other words, effect of location on removal speed depended on whether location was US or Greece Uses for Factorial Designs<br>
slide37. Detecting order effects
Controlling extraneous variance by blocking
Participants are grouped according to an extraneous variable and that variable is added as a factor in the design Uses for Factorial Designs<br>