
ULTRAVIOLET - VISIBLE SPECTROSCOPY Dr. B. Kavitha

Description: ULTRAVIOLET - VISIBLE SPECTROSCOPY Dr. B. Kavitha Assistant Professor PG and Research Department of Chemistry C.P.A. College, Bodinayakanur ULTRAVIOLET - VISIBLE SPECTROSCOPY Principle Molecules absorb energy and this energy can bring out
Related Topics
Download Presentation
"ULTRAVIOLET - VISIBLE SPECTROSCOPY Dr. B. Kavitha" is the property of its rightful owner. Permission is granted to download and print the materials on this website for personal, non-commercial use only, and to display it on your personal computer provided you do not modify the materials and that you retain all copyright notices contained in the materials. By downloading content from our website, you accept the terms of this agreement.
Presentation Transcript
slide1. ULTRAVIOLET - VISIBLE SPECTROSCOPY Dr. B. Kavitha
Assistant Professor
PG and Research Department of Chemistry
C.P.A. College, Bodinayakanur<br>
slide2. ULTRAVIOLET - VISIBLE SPECTROSCOPY Principle
Molecules absorb energy and this energy can bring out translational, rotational or vibrational motion or ionization of the molecules depending upon the frequency of the electromagnetic radiation.
Excited molecules are unstable and quickly drop down to ground state again giving off the received energy in the form electromagnetic radiation.
The wavelength and intensity of the electromagnetic radiation absorbed or emitted can be recorded to get a spectrum.
Spectral analysis yields qualitative and quantitative information about the materials under study.<br>
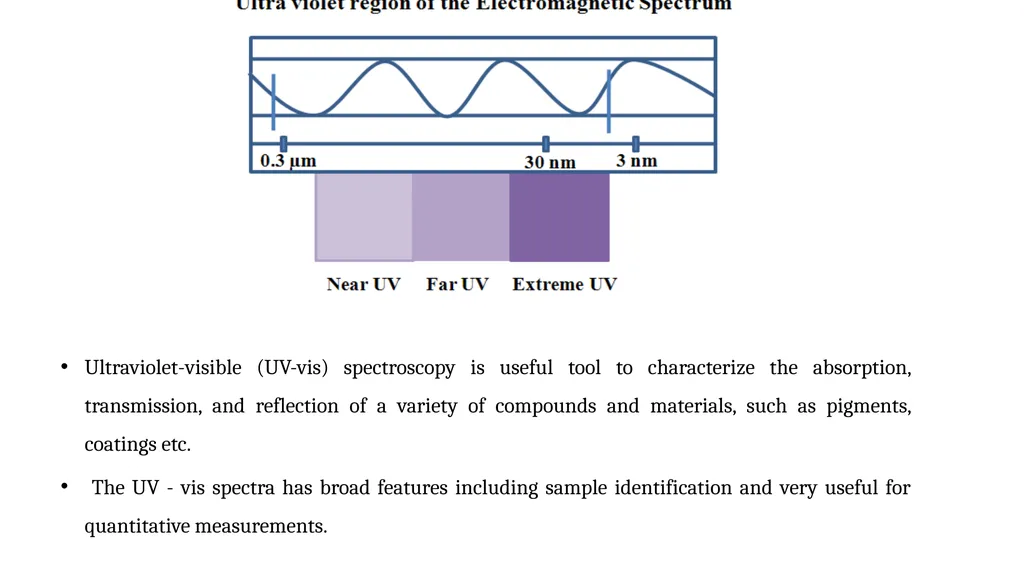
slide3. Ultraviolet-visible (UV-vis) spectroscopy is useful tool to characterize the absorption, transmission, and reflection of a variety of compounds and materials, such as pigments, coatings etc.
The UV - vis spectra has broad features including sample identification and very useful for quantitative measurements.<br>
slide4. Instrumentation
The instruments has the following components:
A light source that generates a broad band of electromagnetic radiation
A dispersion device that selects a particular wavelength (or, more correctly a waveband) from the broadband radiation of the source
A sample area (component)
One or more detectors to measure the intensity of radiation
Other optical components, such as lenses or mirrors, relay light through the instrument.
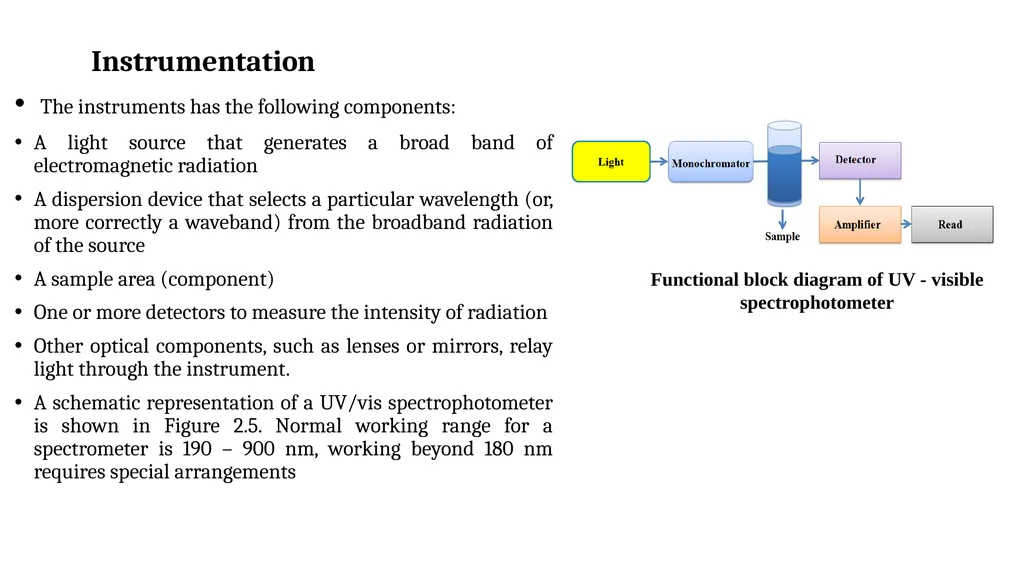
A schematic representation of a UV/vis spectrophotometer is shown in Figure 2.5. Normal working range for a spectrometer is 190 – 900 nm, working beyond 180 nm requires special arrangements Functional block diagram of UV - visible spectrophotometer<br>
slide5. The Light Source A deuterium discharge lamp for UV region (160-375 nm) A tungsten filament lamp or tungsten-halogen lamp for Visible and NIR regions (350 - 2500 nm) The instrument automatically swaps lamps when scanning between the UV and VIS-NIR regions The Monochromator
All monochromators contain the following component parts:
An entrance slit
A collimating lens
A dispersing device
A focusing lens
An exit slit
Ideally, the output from a monochromator is monochromatic light. However, in practice, the output is always a band, optimally symmetrical in shape.<br>
slide6. Dispersion devices
Dispersion devices cause different wavelengths of light to be dispersed at different angles. When combined with an appropriate exit slit, these devices can be used to select a particular wavelength (or, more precisely, a narrow waveband) of light from a continuous source. Two types of dispersion devices, prisms and holographic gratings are commonly used in UV-vis spectrophotometers.
Light falling on the grating is reflected at different angles, depending on the wavelength. Holographic gratings yield a linear angular dispersion with wavelengths and are temperature insensitive. However, they reflect light in different orders, which may overlap. As a result, filters must be used to ensure that only the light from the desired reflection order reaches the detector. Detectors
A detector converts a light signal into an electrical signal. Ideally, it should give a linear response over a wide range with low noise and high sensitivity. Spectrophotometers normally contain either a photomultiplier tube detector or a photodiode detector.
The photomultiplier tube combines signal conversion with several stages of amplification within the body of the tube. It consists of a photoemissive cathode, a number of dynodes (which emit several electrons for each electron striking them) and an anode.
Photodiodes are increasingly being used as detectors in modern spectrophotometers. Photodiode detectors have a wider dynamic range and are more robust than photomultiplier tube detectors. In a photodiode, light falling on the semiconductor material allows electrons to flow through it, thereby depleting the charge in a capacitor connected across the material. The amount of charge needed to recharge the capacitor at regular intervals is proportional to the intensity of the light.<br>
slide7. Cells
These are containers for the sample and reference solutions. They must be transparent to the radiation passing through.
For UV region: Quartz or fused silica cuvettes are usually used.
VIS/NIR regions: Silicate glass or plastic cuvettes (350 - 2000 nm) can also be used Applications
It is the most widely used technique for quantitative molecular analysis and obeys Beer - Lambert law. Sometimes, it is used in conjunction with other techniques such as NMR, IR, etc., in the identification and structural analysis, of organic compounds. For qualitative analysis it provides valuable information through the absorption spectrum which is unique for a given compound<br>
slide8. Thank You<br>
Assistant Professor
PG and Research Department of Chemistry
C.P.A. College, Bodinayakanur<br>
slide2. ULTRAVIOLET - VISIBLE SPECTROSCOPY Principle
Molecules absorb energy and this energy can bring out translational, rotational or vibrational motion or ionization of the molecules depending upon the frequency of the electromagnetic radiation.
Excited molecules are unstable and quickly drop down to ground state again giving off the received energy in the form electromagnetic radiation.
The wavelength and intensity of the electromagnetic radiation absorbed or emitted can be recorded to get a spectrum.
Spectral analysis yields qualitative and quantitative information about the materials under study.<br>
slide3. Ultraviolet-visible (UV-vis) spectroscopy is useful tool to characterize the absorption, transmission, and reflection of a variety of compounds and materials, such as pigments, coatings etc.
The UV - vis spectra has broad features including sample identification and very useful for quantitative measurements.<br>
slide4. Instrumentation
The instruments has the following components:
A light source that generates a broad band of electromagnetic radiation
A dispersion device that selects a particular wavelength (or, more correctly a waveband) from the broadband radiation of the source
A sample area (component)
One or more detectors to measure the intensity of radiation
Other optical components, such as lenses or mirrors, relay light through the instrument.
A schematic representation of a UV/vis spectrophotometer is shown in Figure 2.5. Normal working range for a spectrometer is 190 – 900 nm, working beyond 180 nm requires special arrangements Functional block diagram of UV - visible spectrophotometer<br>
slide5. The Light Source A deuterium discharge lamp for UV region (160-375 nm) A tungsten filament lamp or tungsten-halogen lamp for Visible and NIR regions (350 - 2500 nm) The instrument automatically swaps lamps when scanning between the UV and VIS-NIR regions The Monochromator
All monochromators contain the following component parts:
An entrance slit
A collimating lens
A dispersing device
A focusing lens
An exit slit
Ideally, the output from a monochromator is monochromatic light. However, in practice, the output is always a band, optimally symmetrical in shape.<br>
slide6. Dispersion devices
Dispersion devices cause different wavelengths of light to be dispersed at different angles. When combined with an appropriate exit slit, these devices can be used to select a particular wavelength (or, more precisely, a narrow waveband) of light from a continuous source. Two types of dispersion devices, prisms and holographic gratings are commonly used in UV-vis spectrophotometers.
Light falling on the grating is reflected at different angles, depending on the wavelength. Holographic gratings yield a linear angular dispersion with wavelengths and are temperature insensitive. However, they reflect light in different orders, which may overlap. As a result, filters must be used to ensure that only the light from the desired reflection order reaches the detector. Detectors
A detector converts a light signal into an electrical signal. Ideally, it should give a linear response over a wide range with low noise and high sensitivity. Spectrophotometers normally contain either a photomultiplier tube detector or a photodiode detector.
The photomultiplier tube combines signal conversion with several stages of amplification within the body of the tube. It consists of a photoemissive cathode, a number of dynodes (which emit several electrons for each electron striking them) and an anode.
Photodiodes are increasingly being used as detectors in modern spectrophotometers. Photodiode detectors have a wider dynamic range and are more robust than photomultiplier tube detectors. In a photodiode, light falling on the semiconductor material allows electrons to flow through it, thereby depleting the charge in a capacitor connected across the material. The amount of charge needed to recharge the capacitor at regular intervals is proportional to the intensity of the light.<br>
slide7. Cells
These are containers for the sample and reference solutions. They must be transparent to the radiation passing through.
For UV region: Quartz or fused silica cuvettes are usually used.
VIS/NIR regions: Silicate glass or plastic cuvettes (350 - 2000 nm) can also be used Applications
It is the most widely used technique for quantitative molecular analysis and obeys Beer - Lambert law. Sometimes, it is used in conjunction with other techniques such as NMR, IR, etc., in the identification and structural analysis, of organic compounds. For qualitative analysis it provides valuable information through the absorption spectrum which is unique for a given compound<br>
slide8. Thank You<br>