04
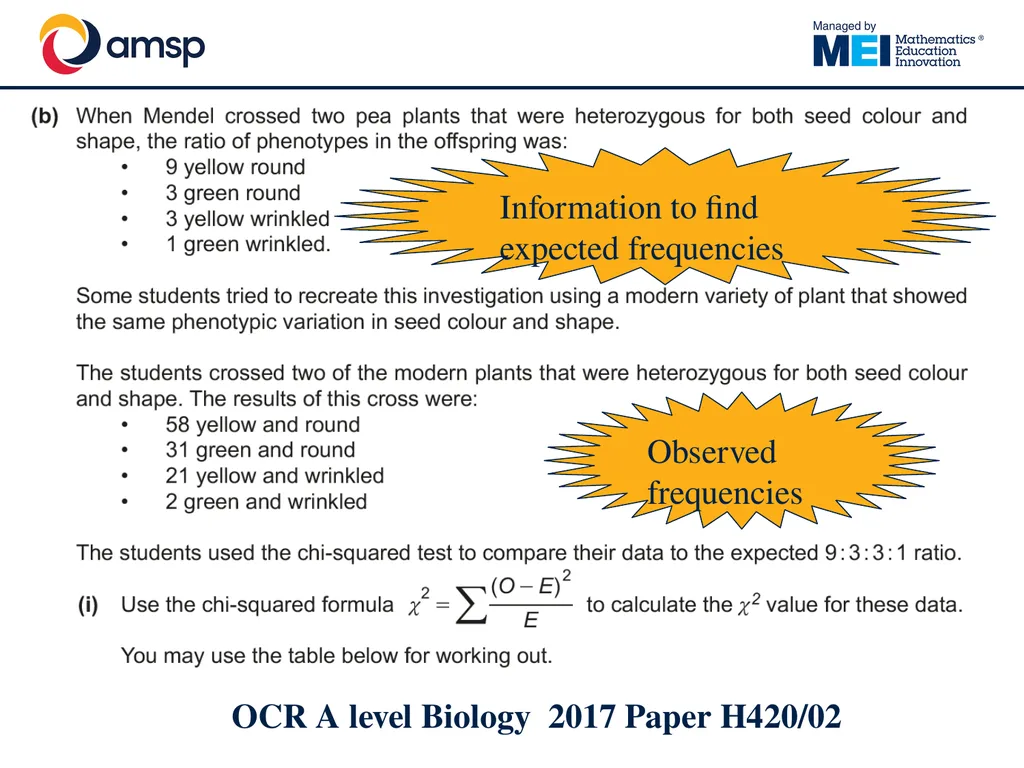
OCR A level Biology 2017 Paper H420/02 Observed frequencies Information to find expected frequencies<br>
05
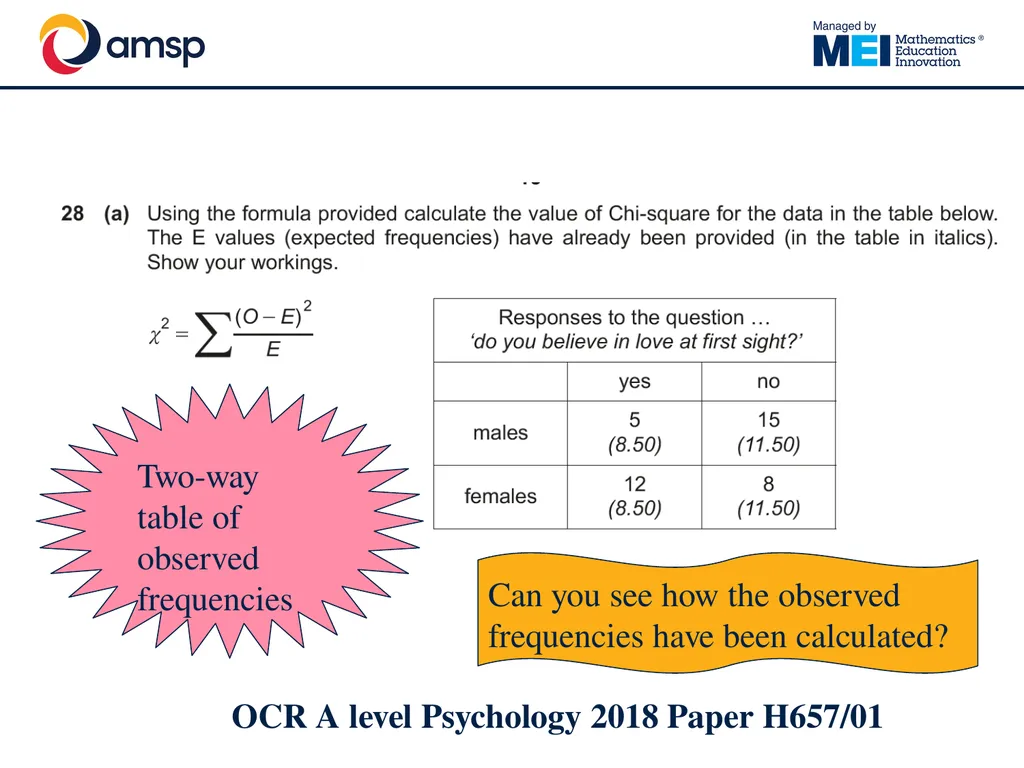
OCR A level Psychology 2018 Paper H657/01 Two-way table of observed frequencies Can you see how the observed frequencies have been calculated?<br>
06
Robin wants to investigate if there is a difference in the types of cycling accidents between adults and young people.
He considered cyclists of age 20 and under to be in the category ‘Young person’ and cyclists over 20 to be ‘Adult’.
He categorised the types of cycling accidents as ‘Hit by other vehicle’, ‘Hit something stationary’, ‘Skidded’ and ‘Fell off’. The counts are in the table below.
(i) Use the data to carry out a χ2 test, using a 5 % significance level. State clearly your null and alternative hypotheses. OCR Core Maths B, Practice paper<br>
07
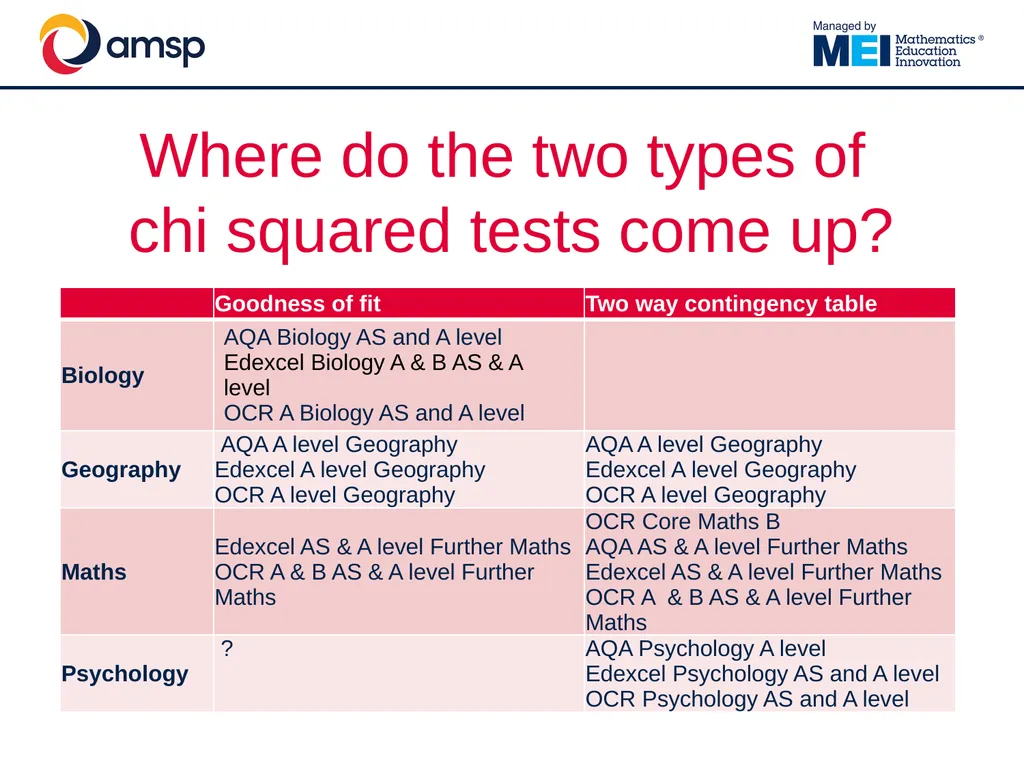
Where do the two types of �chi squared tests come up?<br>
08
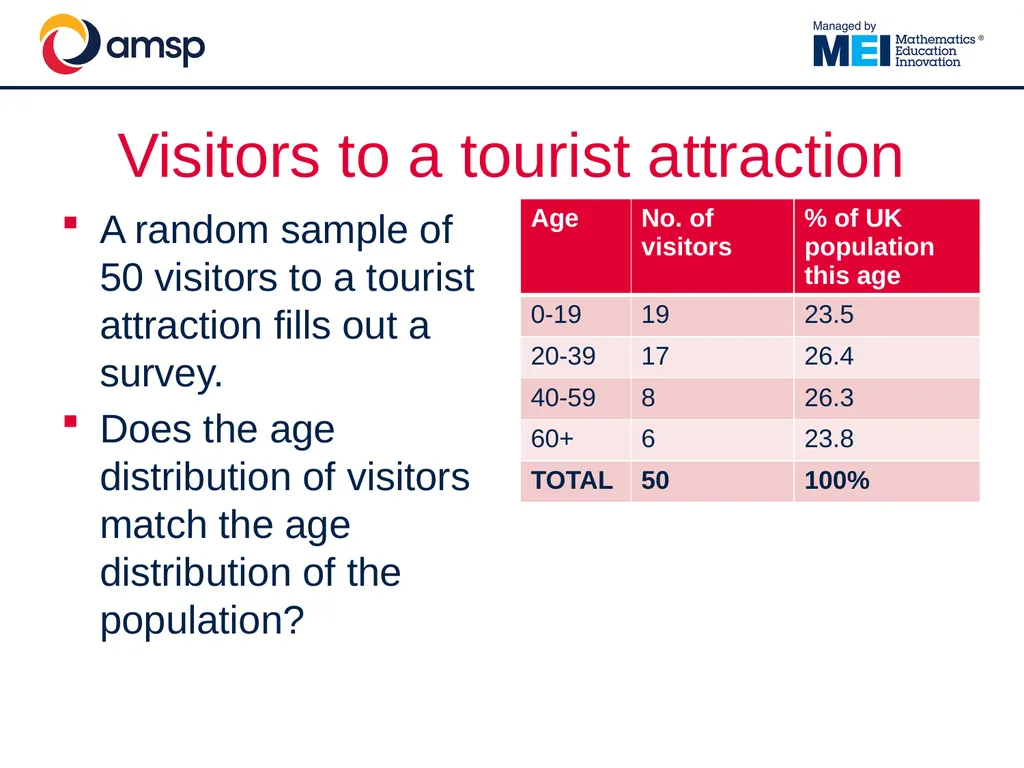
A random sample of 50 visitors to a tourist attraction fills out a survey.
Does the age distribution of visitors match the age distribution of the population? Visitors to a tourist attraction<br>
09
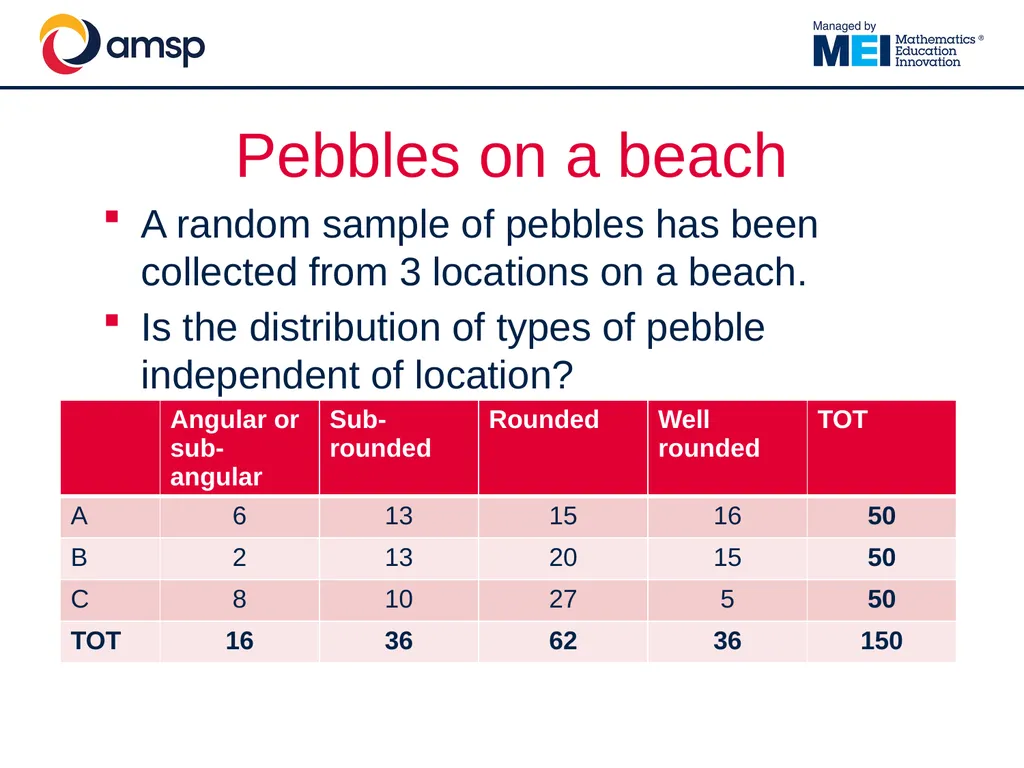
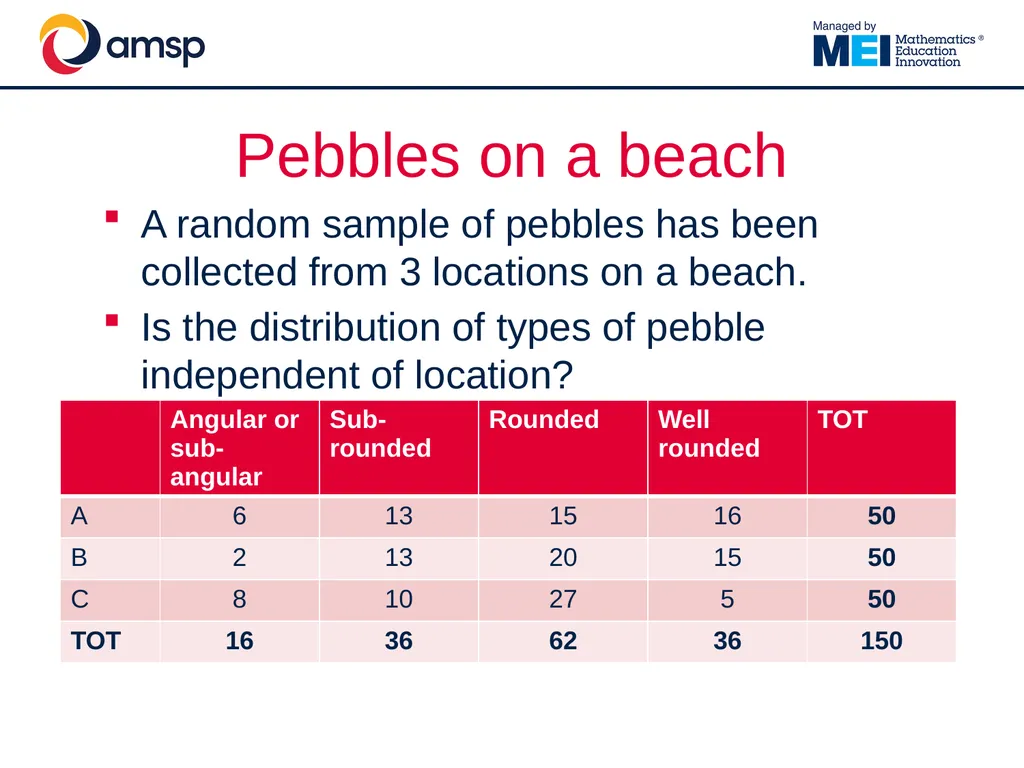
A random sample of pebbles has been collected from 3 locations on a beach.
Is the distribution of types of pebble independent of location? Pebbles on a beach<br>
11
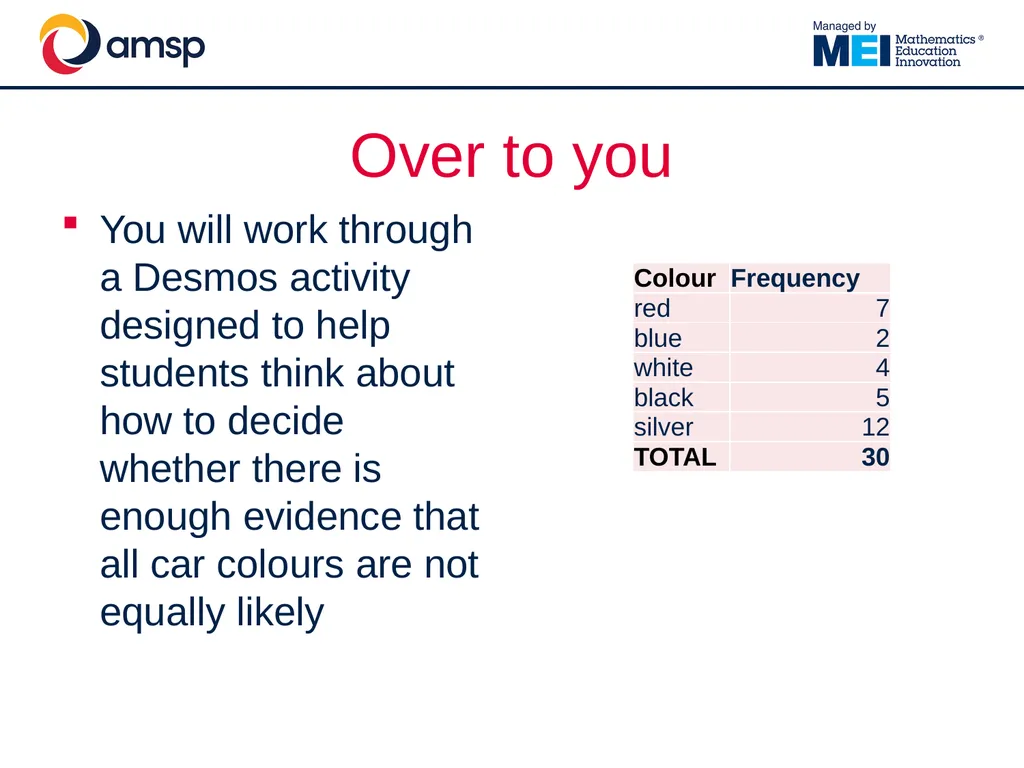
You will work through a Desmos activity designed to help students think about how to decide whether there is enough evidence that all car colours are not equally likely Over to you<br>
12
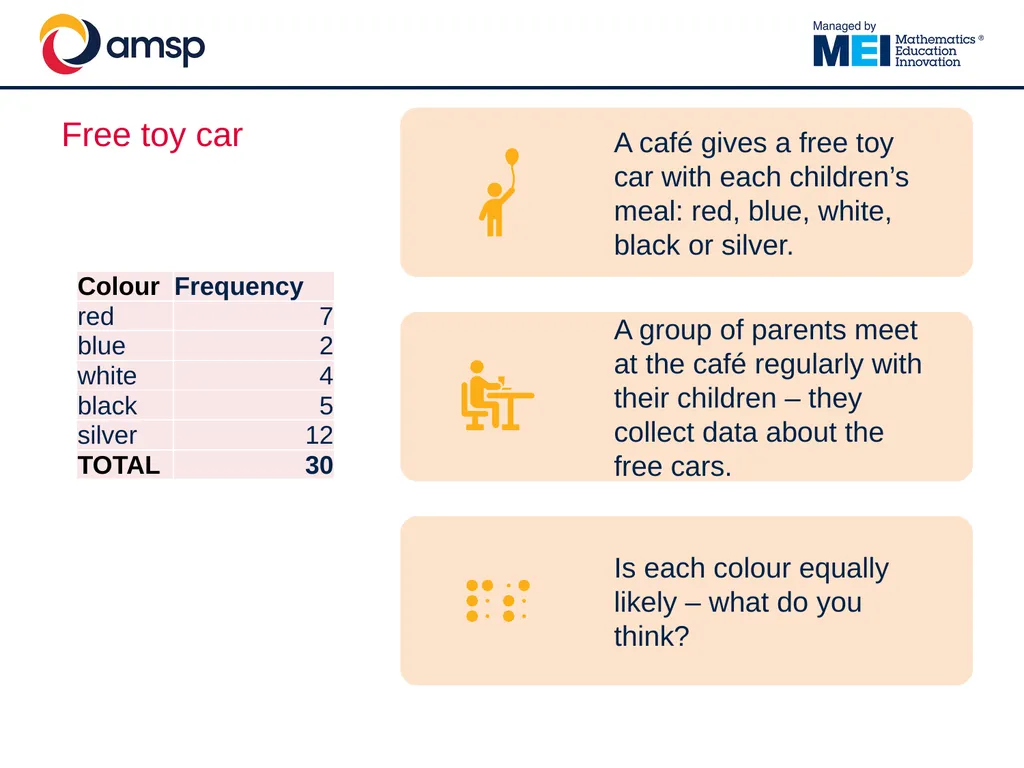
Testing whether there is evidence that the car colours are not equally likely Basic idea:
Start by assuming that they are equally likely.
The technical way of saying this is that the null hypothesis is that all car colours are equally likely.
Calculate the expected frequencies you would expect if they were equally likely.
Compare observed and expected frequencies.<br>
13
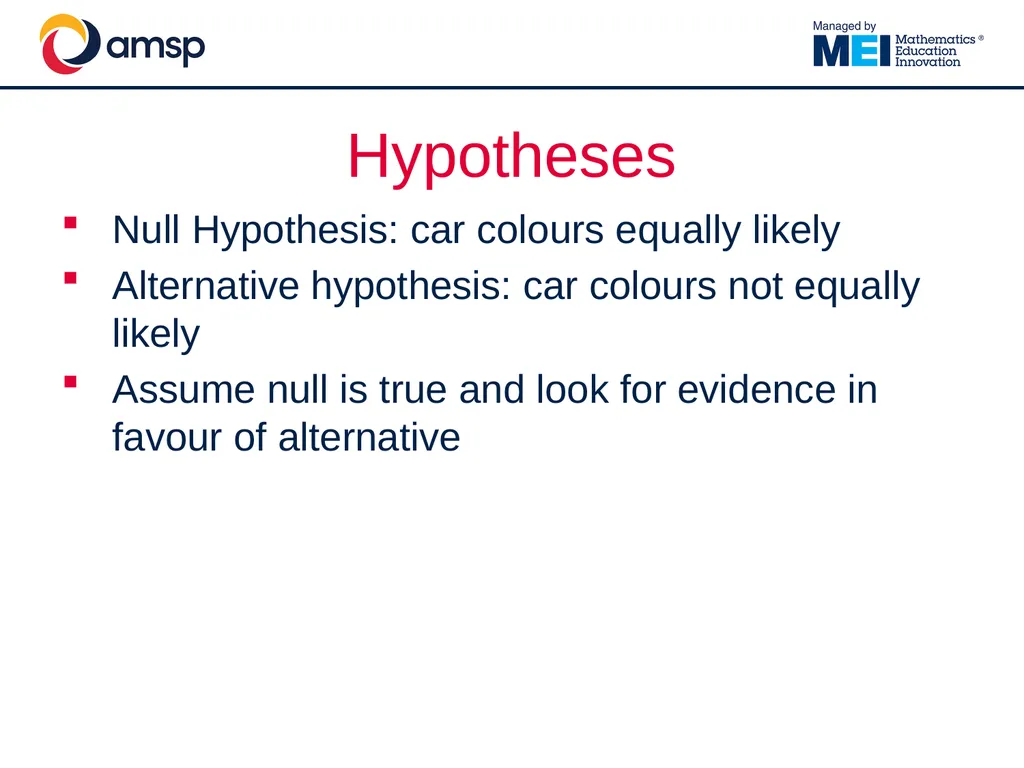
Hypotheses Null Hypothesis: car colours equally likely
Alternative hypothesis: car colours not equally likely
Assume null is true and look for evidence in favour of alternative<br>
14
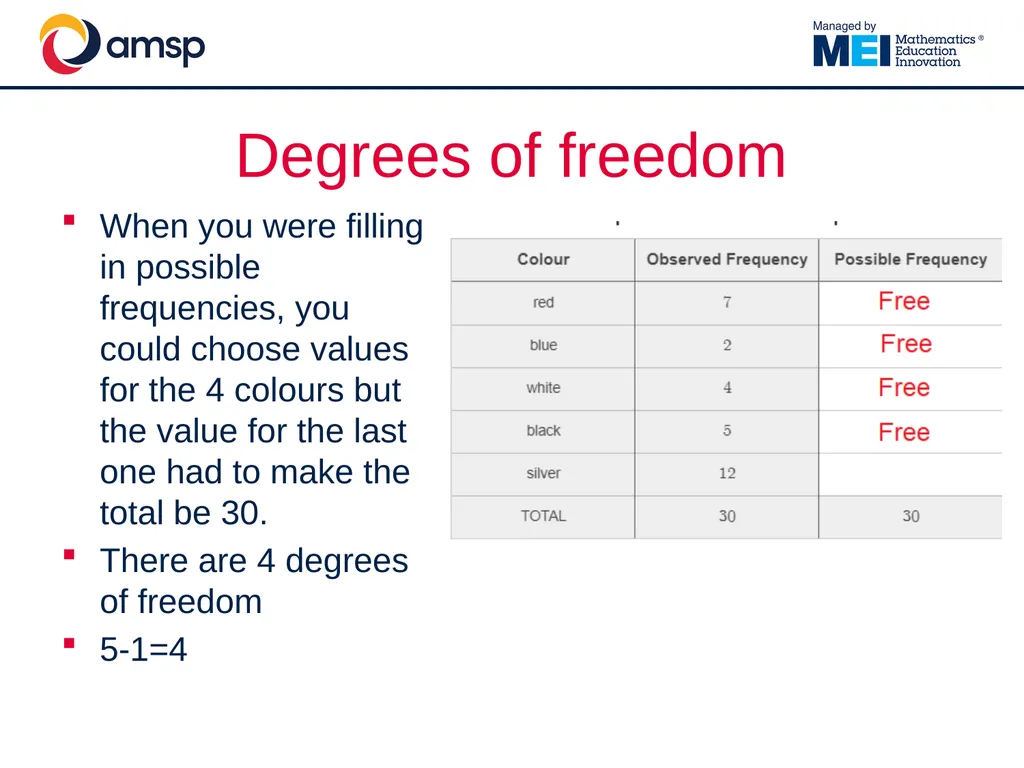
When you were filling in possible frequencies, you could choose values for the 4 colours but the value for the last one had to make the total be 30.
There are 4 degrees of freedom
5-1=4 Degrees of freedom<br>
15
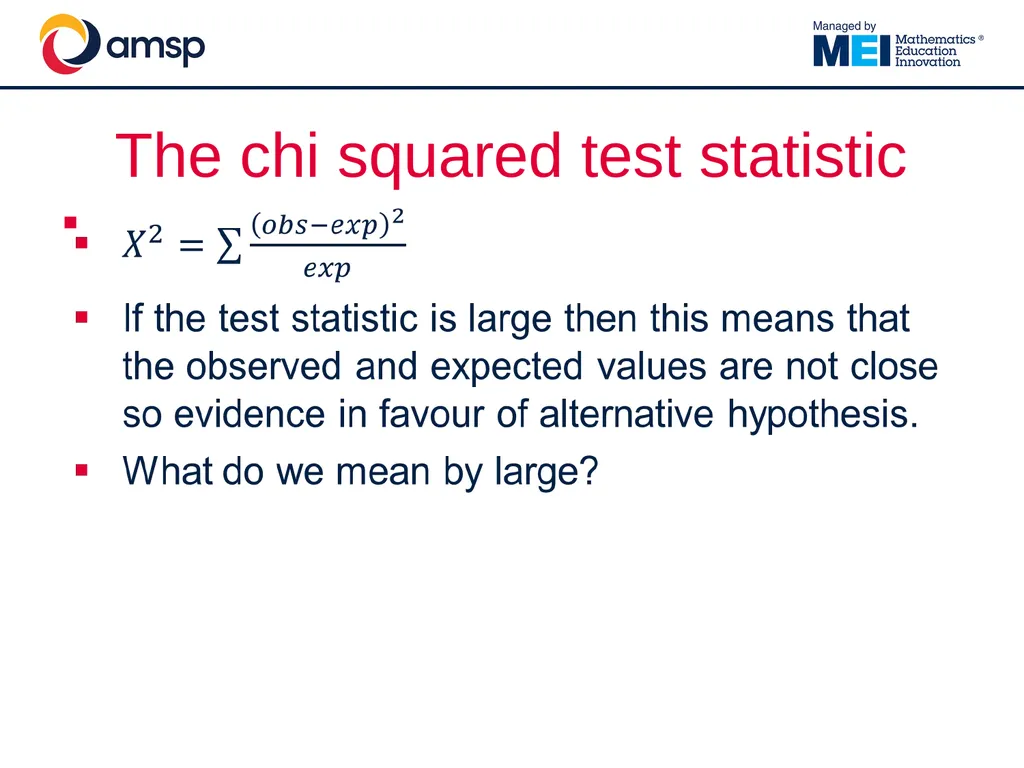
The chi squared test statistic<br>
16
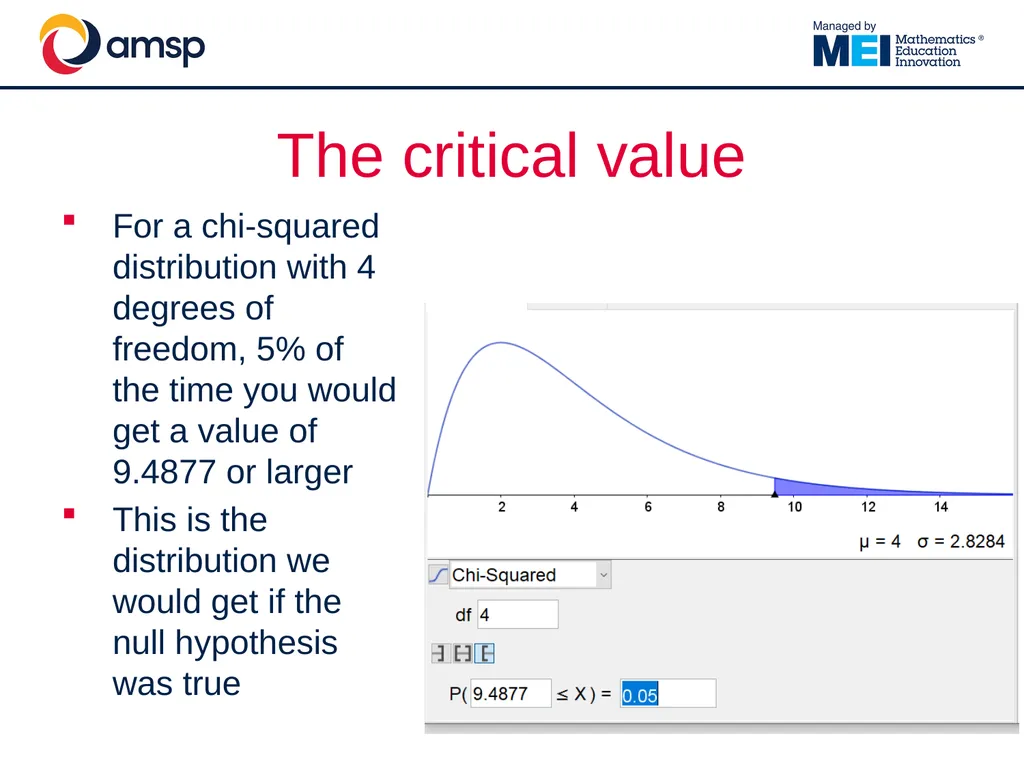
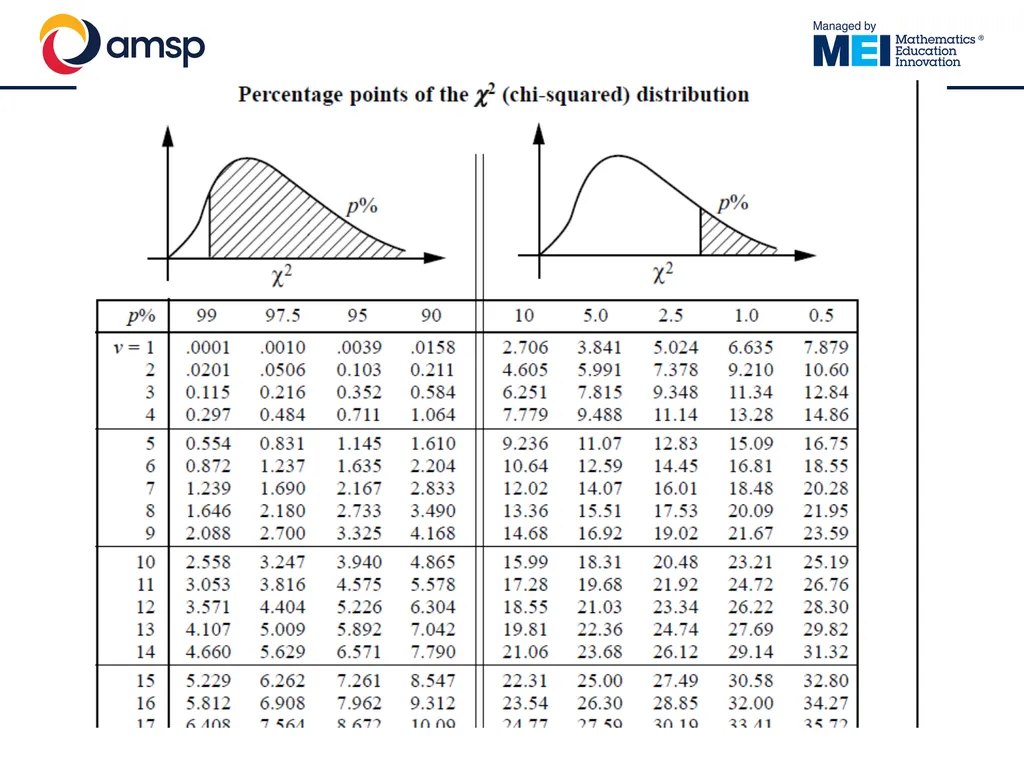
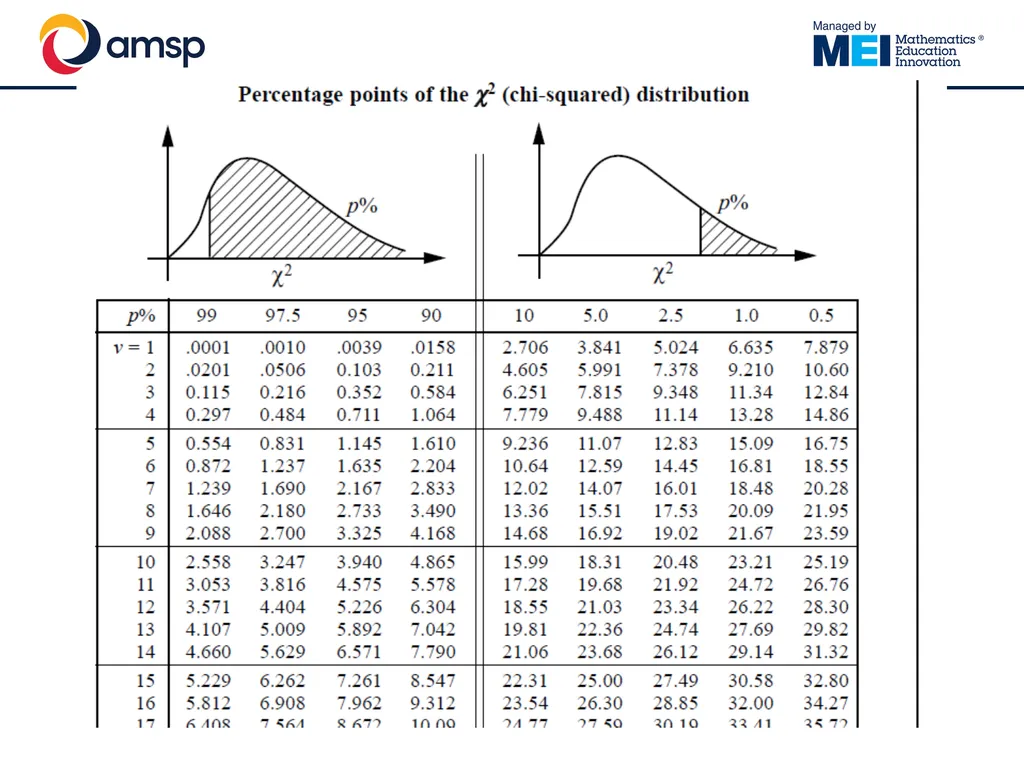
The critical value For a chi-squared distribution with 4 degrees of freedom, 5% of the time you would get a value of 9.4877 or larger
This is the distribution we would get if the null hypothesis was true<br>
18
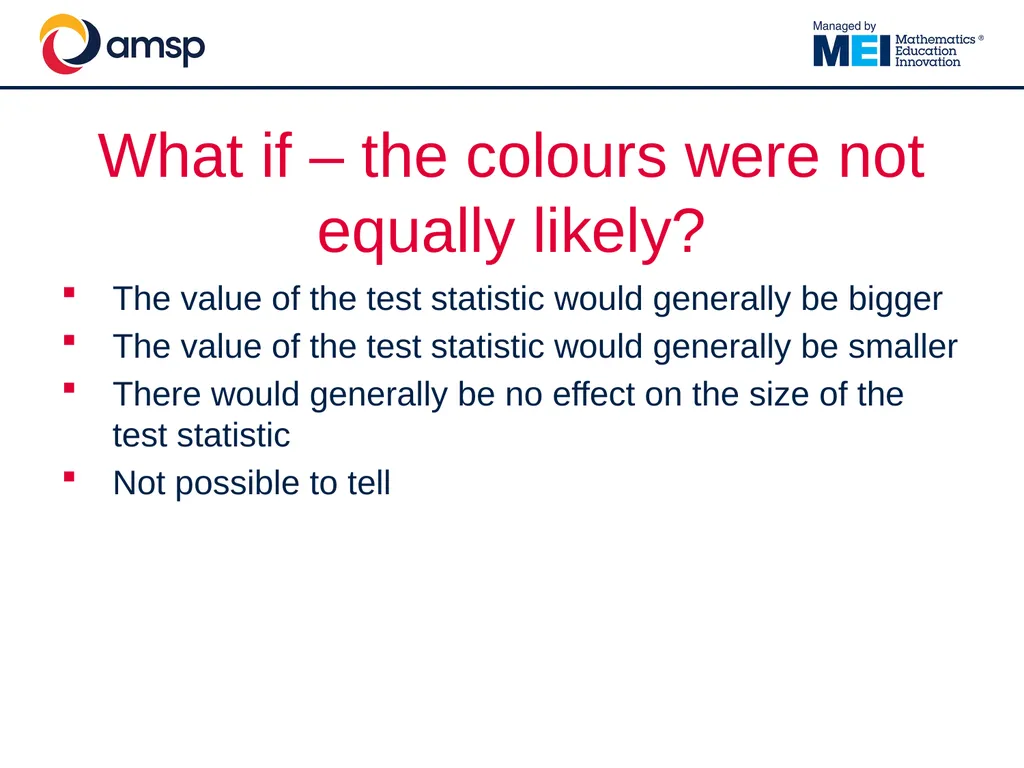
What if – the colours were not equally likely? The value of the test statistic would generally be bigger
The value of the test statistic would generally be smaller
There would generally be no effect on the size of the test statistic
Not possible to tell<br>
19
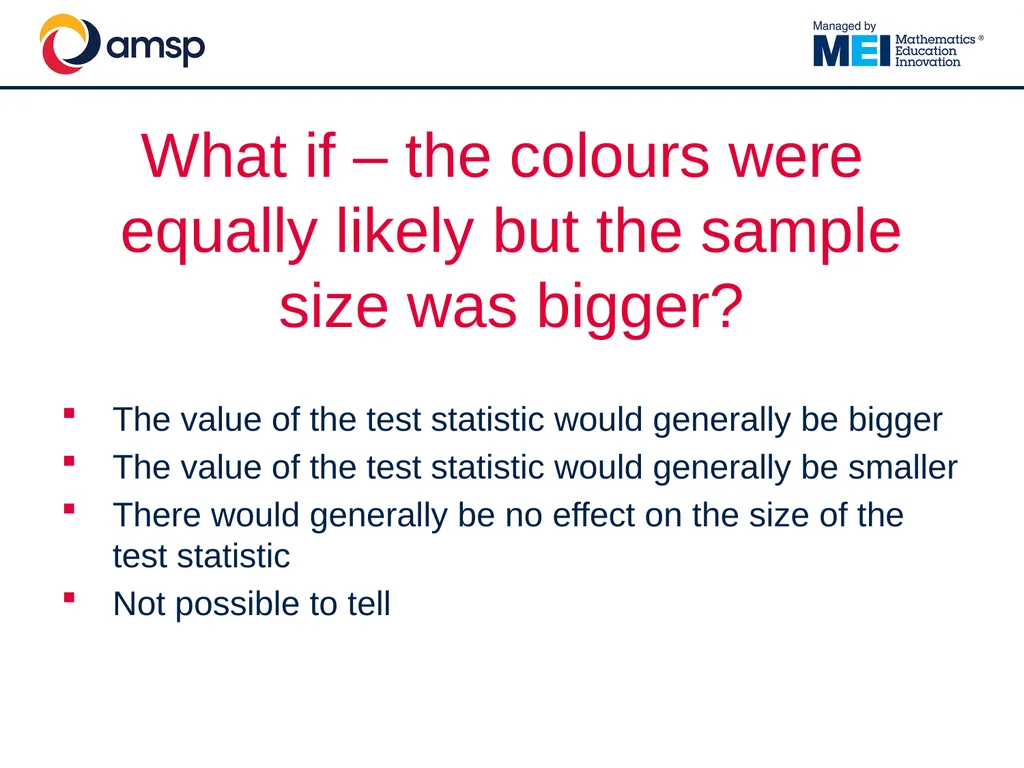
What if – the colours were equally likely but the sample size was bigger? The value of the test statistic would generally be bigger
The value of the test statistic would generally be smaller
There would generally be no effect on the size of the test statistic
Not possible to tell<br>
20
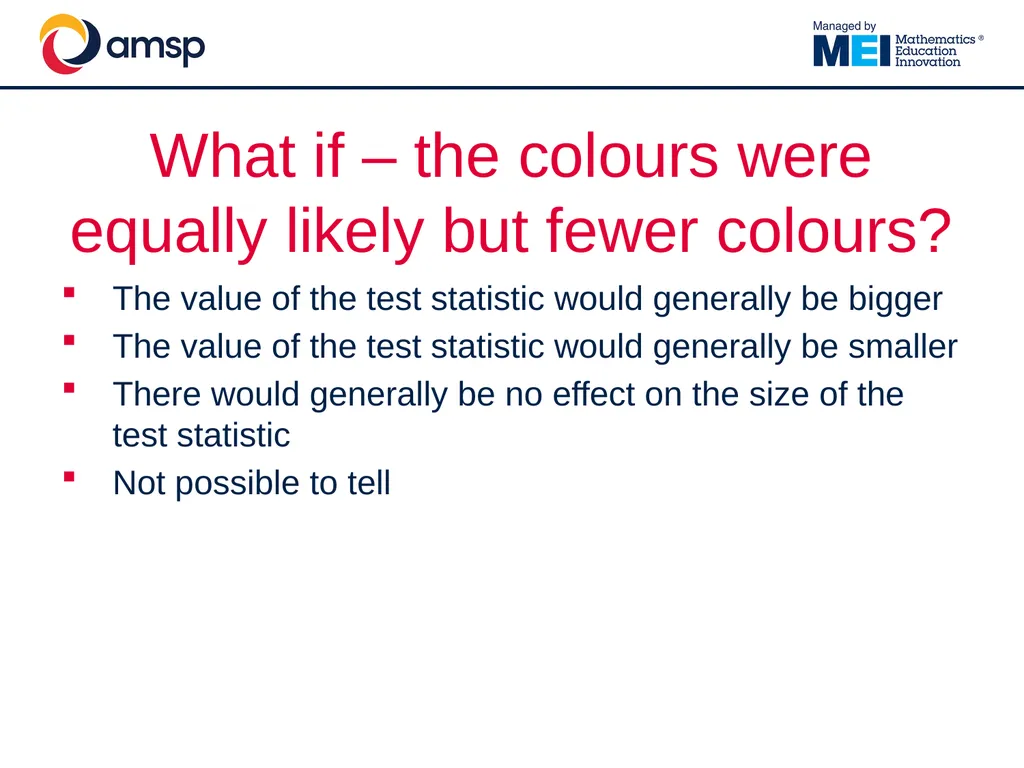
What if – the colours were equally likely but fewer colours? The value of the test statistic would generally be bigger
The value of the test statistic would generally be smaller
There would generally be no effect on the size of the test statistic
Not possible to tell<br>
21
Moving on to two way contingency tables<br>
22
A random sample of pebbles has been collected from 3 locations on a beach.
Is the distribution of types of pebble independent of location? Pebbles on a beach<br>
23
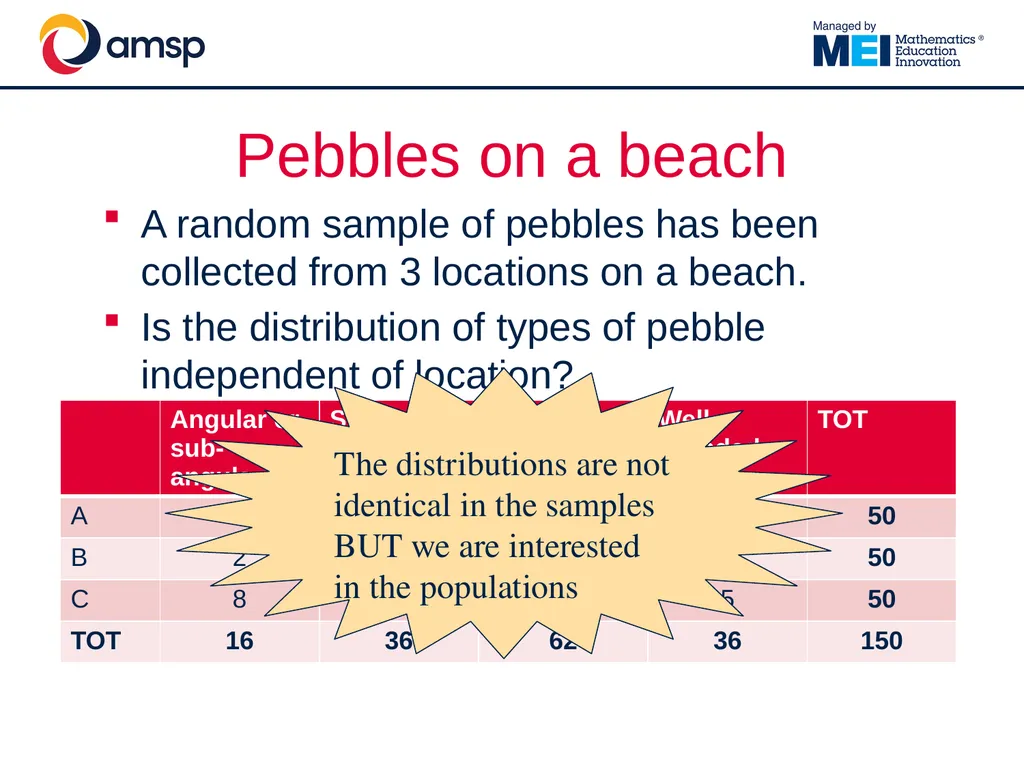
A random sample of pebbles has been collected from 3 locations on a beach.
Is the distribution of types of pebble independent of location? Pebbles on a beach The distributions are not identical in the samples BUT we are interested in the populations<br>
24
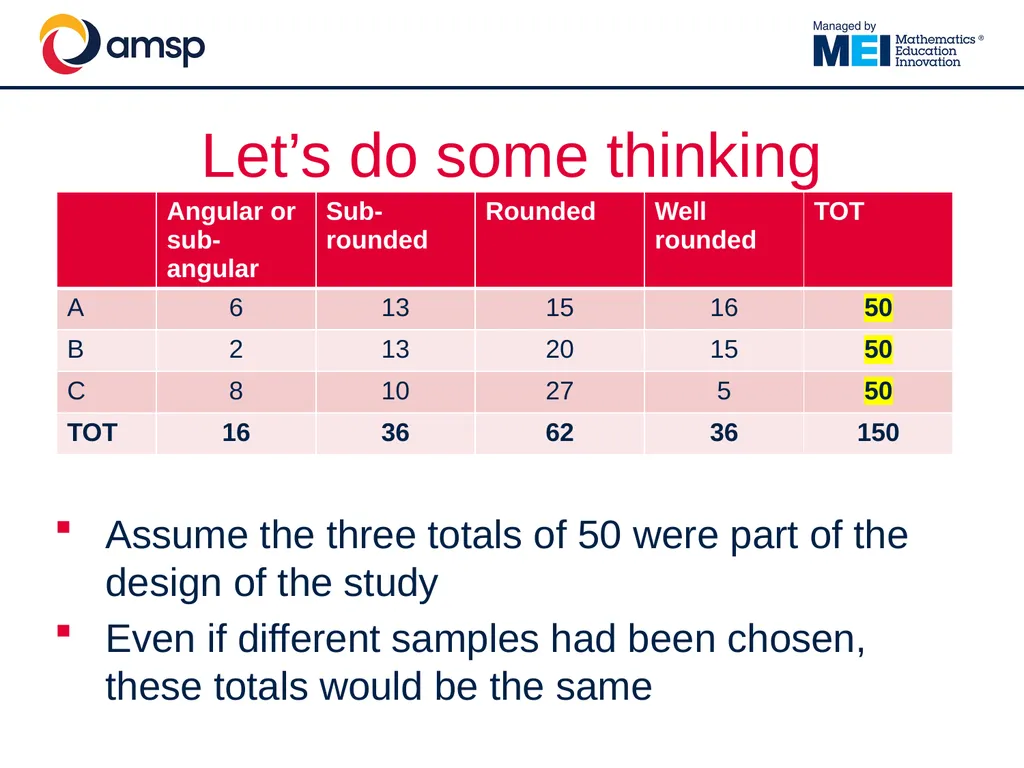
Let’s do some thinking Assume the three totals of 50 were part of the design of the study
Even if different samples had been chosen, these totals would be the same<br>
25
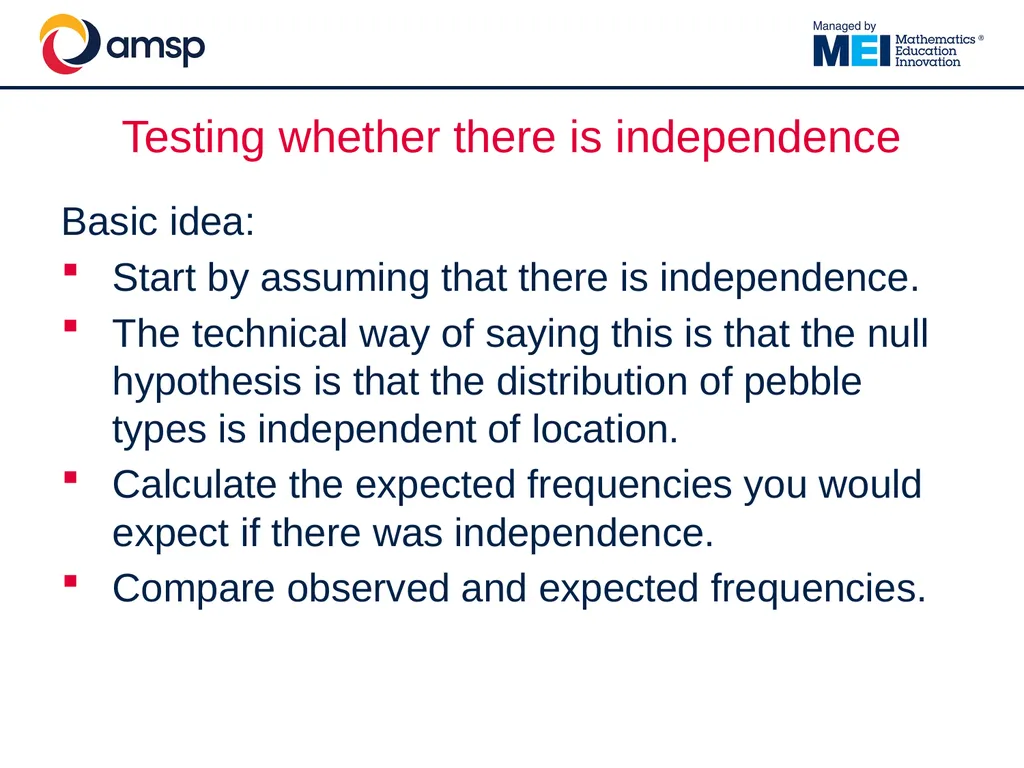
Testing whether there is independence Basic idea:
Start by assuming that there is independence.
The technical way of saying this is that the null hypothesis is that the distribution of pebble types is independent of location.
Calculate the expected frequencies you would expect if there was independence.
Compare observed and expected frequencies.<br>
26
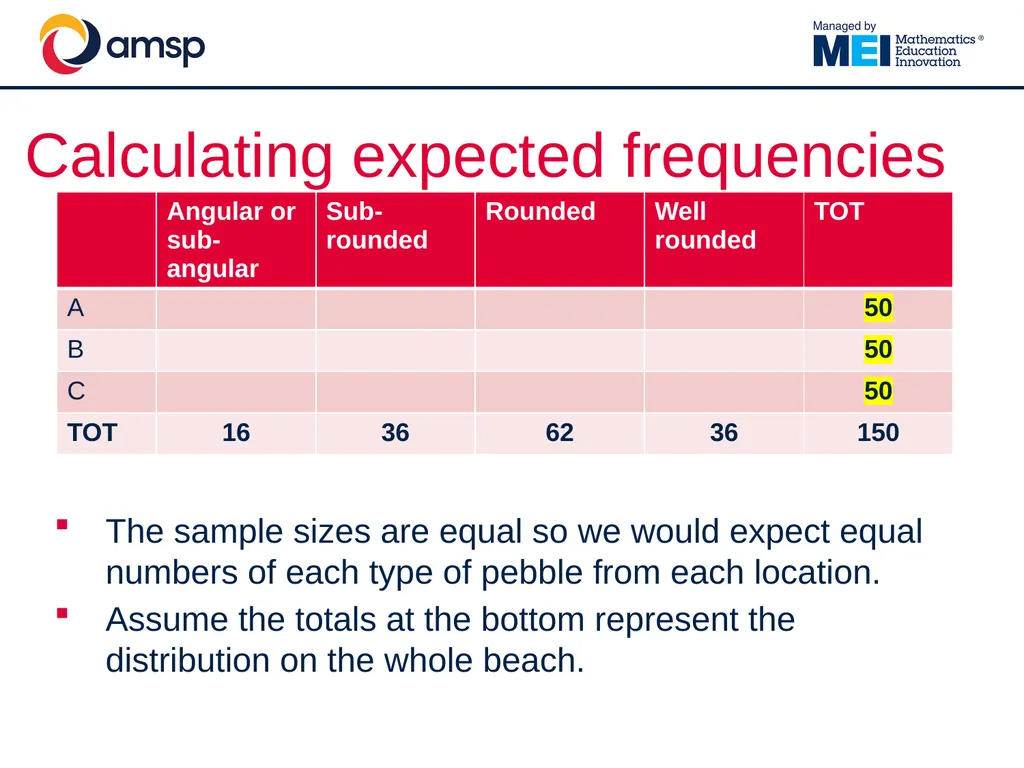
Calculating expected frequencies The sample sizes are equal so we would expect equal numbers of each type of pebble from each location.
Assume the totals at the bottom represent the distribution on the whole beach.<br>
27
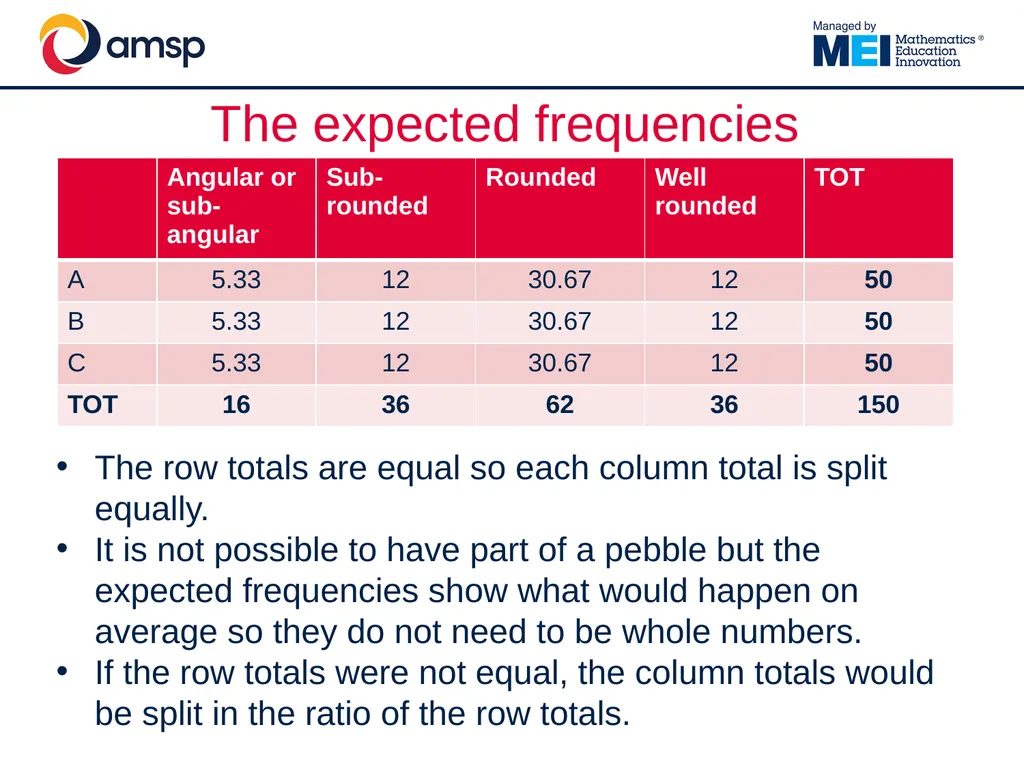
The expected frequencies The row totals are equal so each column total is split equally.
It is not possible to have part of a pebble but the expected frequencies show what would happen on average so they do not need to be whole numbers.
If the row totals were not equal, the column totals would be split in the ratio of the row totals.<br>
28
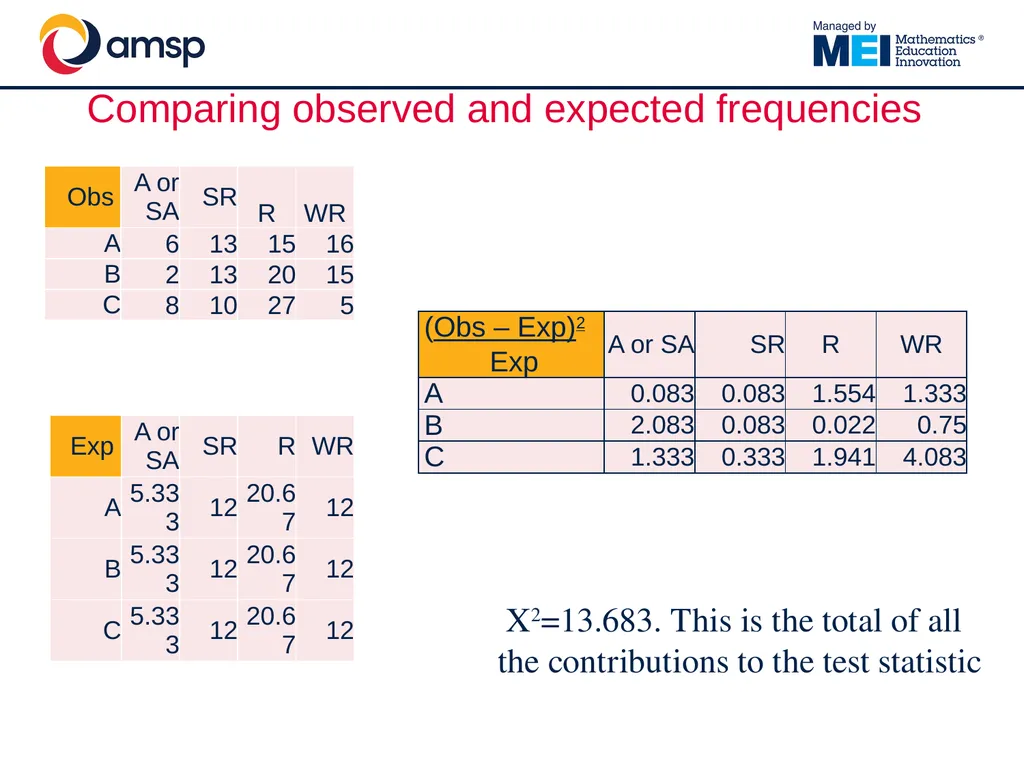
Comparing observed and expected frequencies X2=13.683. This is the total of all the contributions to the test statistic<br>
29
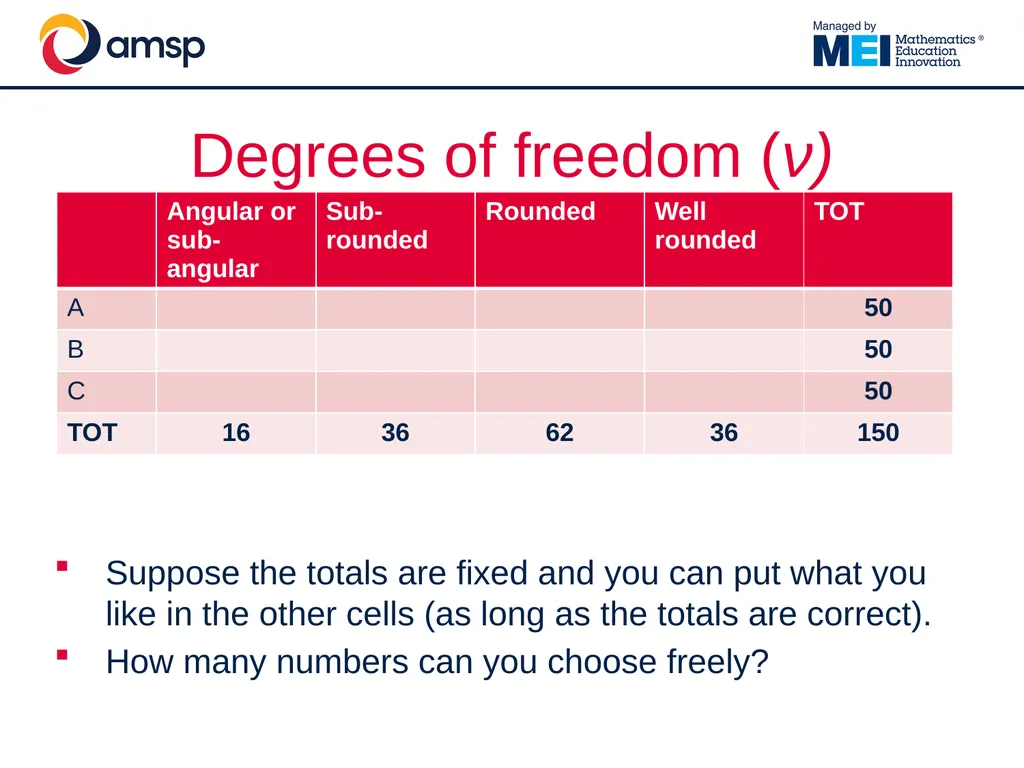
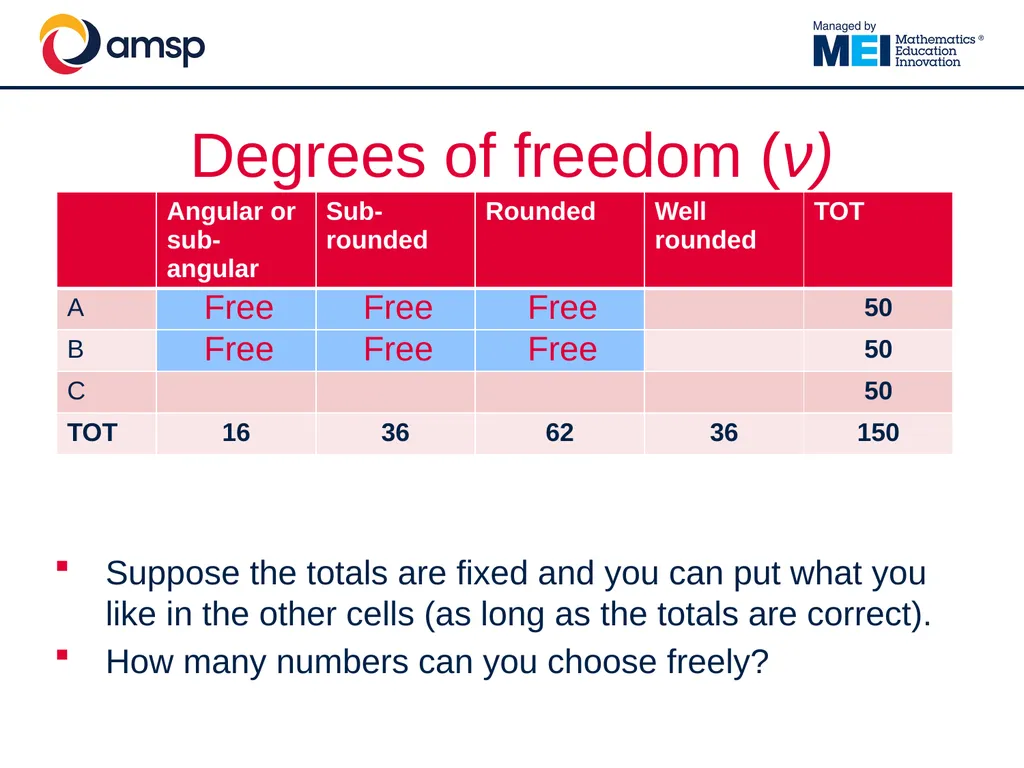
Degrees of freedom (ν) Suppose the totals are fixed and you can put what you like in the other cells (as long as the totals are correct).
How many numbers can you choose freely?<br>
30
Degrees of freedom (ν) Suppose the totals are fixed and you can put what you like in the other cells (as long as the totals are correct).
How many numbers can you choose freely?<br>
31
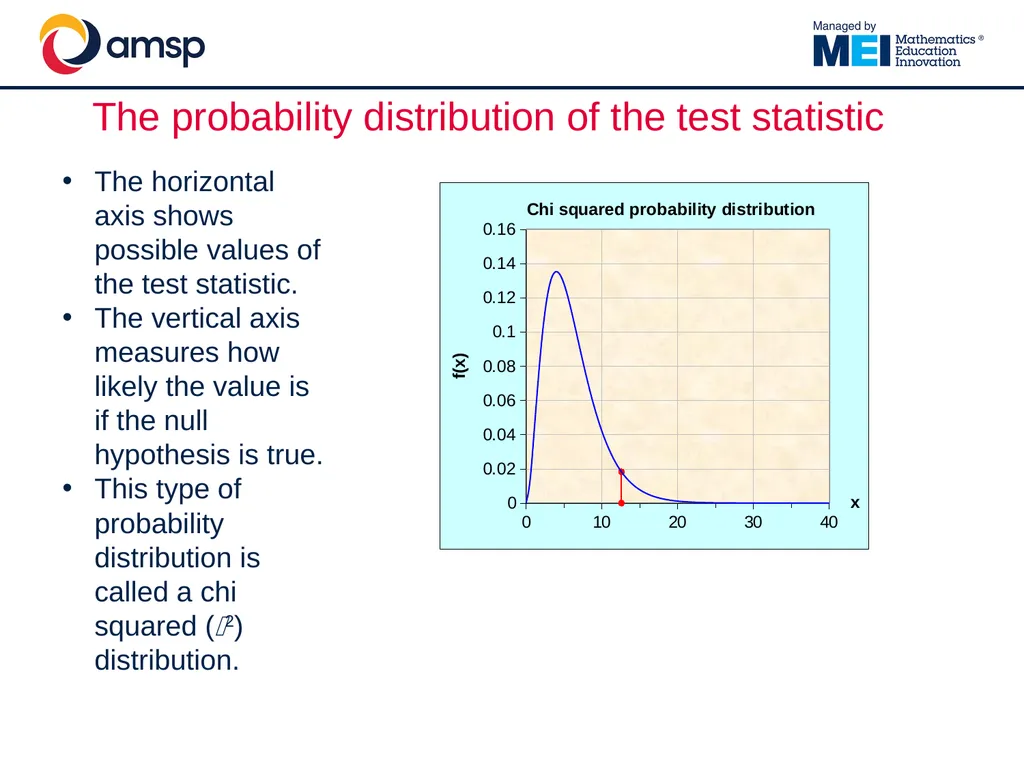
The probability distribution of the test statistic The horizontal axis shows possible values of the test statistic.
The vertical axis measures how likely the value is if the null hypothesis is true.
This type of probability distribution is called a chi squared (2) distribution.<br>
32
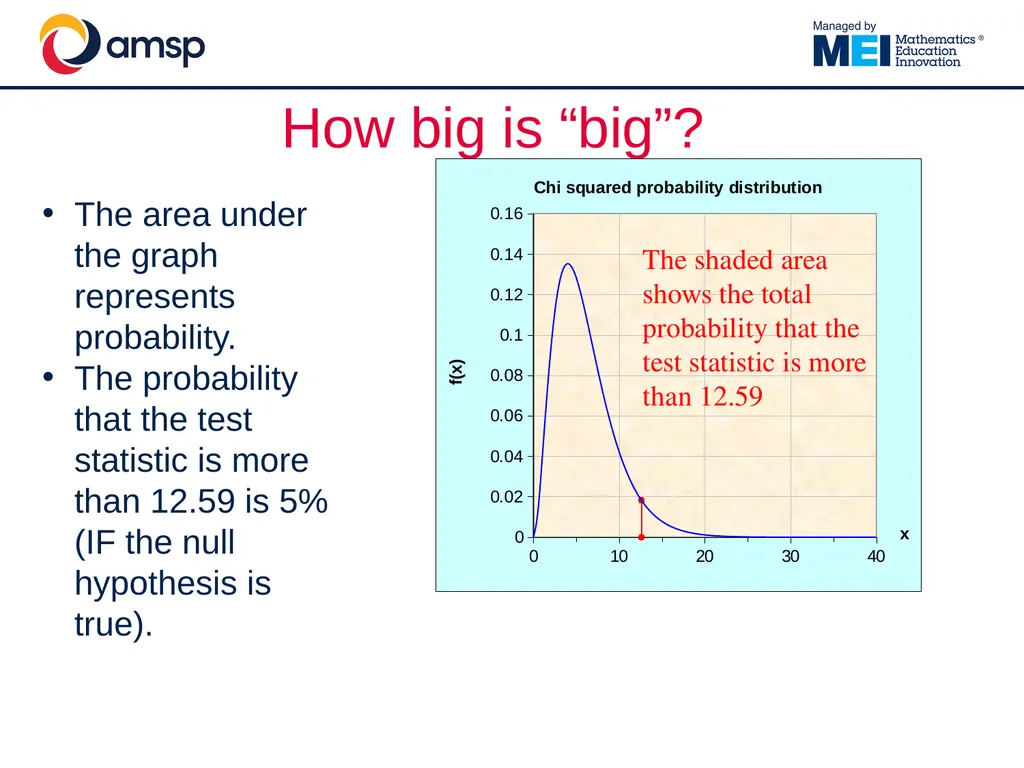
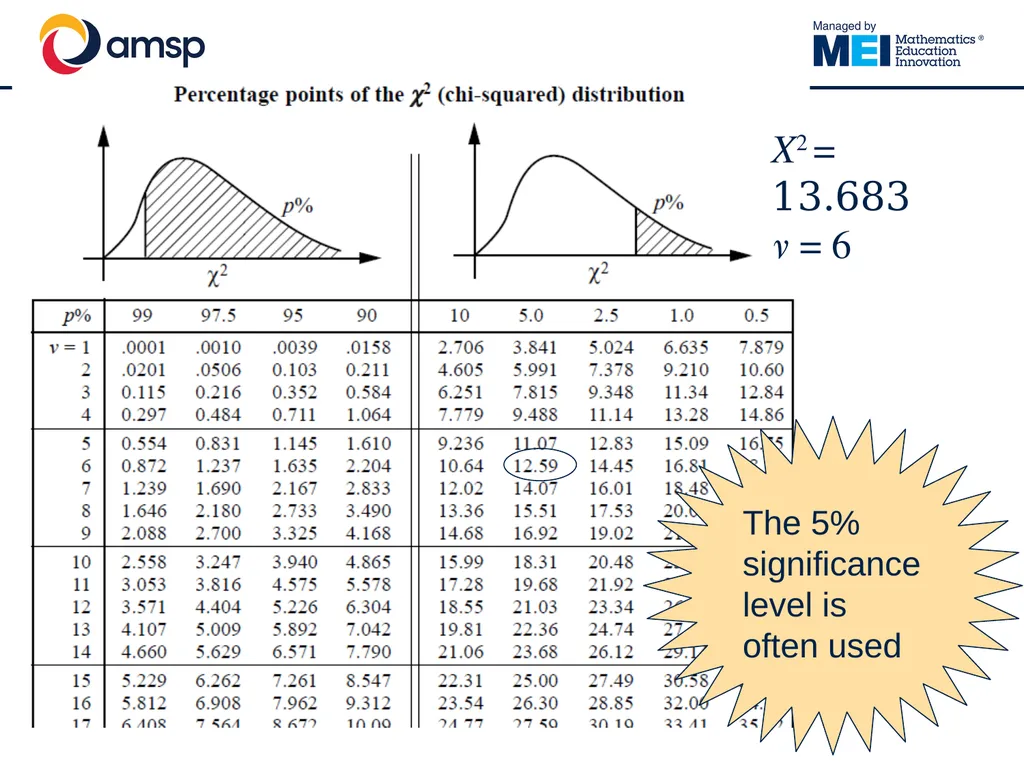
How big is “big”? The shaded area shows the total probability that the test statistic is more than 12.59 The area under the graph represents probability.
The probability that the test statistic is more than 12.59 is 5% (IF the null hypothesis is true).<br>
33
X2 = 13.683
ν = 6 The 5% significance level is often used<br>
34
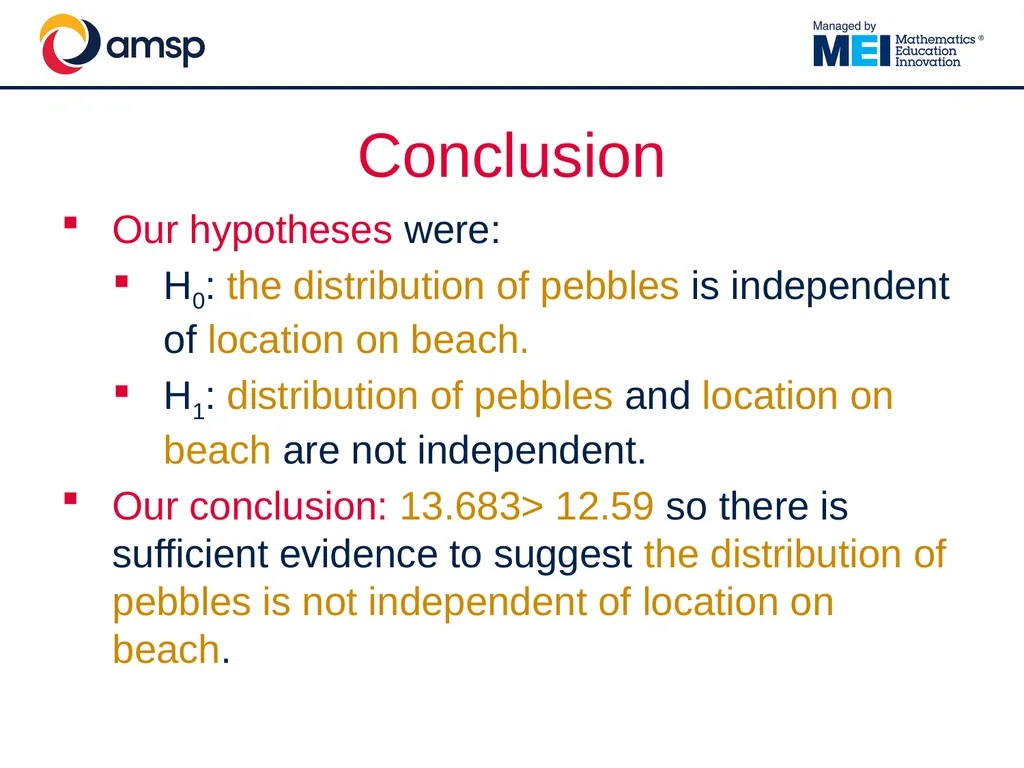
Conclusion Our hypotheses were:
H0: the distribution of pebbles is independent of location on beach.
H1: distribution of pebbles and location on beach are not independent.
Our conclusion: 13.683> 12.59 so there is sufficient evidence to suggest the distribution of pebbles is not independent of location on beach.<br>
35
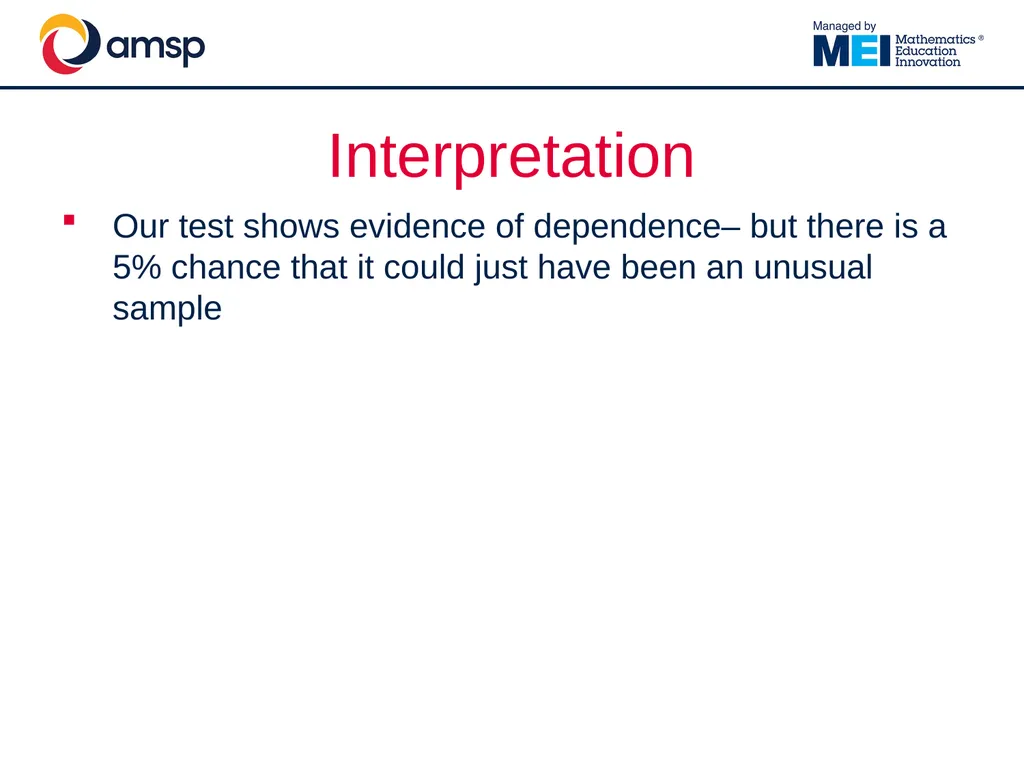
Interpretation Our test shows evidence of dependence– but there is a 5% chance that it could just have been an unusual sample<br>
36
A government-funded initiative, managed by MEI, providing national support for teachers and students in all state-funded schools and colleges in England.
It aims to increase participation in AS/A level Mathematics and Further Mathematics, and Core Maths, and improve the teaching of these qualifications.
Additional support is given to those in priority areas to boost social mobility so that, whatever their gender, background or location, students can choose their best maths pathway post-16, and have access to high quality maths teaching. About the AMSP<br>