
Understanding Statistics for HCI and Related



Description: Understanding Statistics for HCI and Related Disciplines Part 1 Wild and Wide concerning randomness and distributions Alan Dix http:alandix.comstatistics unexpected wildness of random just how random is the world? raindrops and horse
Related Topics
Download Presentation
"Understanding Statistics for HCI and Related" is the property of its rightful owner. Permission is granted to download and print the materials on this website for personal, non-commercial use only, and to display it on your personal computer provided you do not modify the materials and that you retain all copyright notices contained in the materials. By downloading content from our website, you accept the terms of this agreement.
Presentation Transcript
slide1. Understanding Statistics for
HCI and Related Disciplines
Part 1 – Wild and Wide
concerning randomness and distributions Alan Dix
http://alandix.com/statistics/<br>
slide2. unexpected wildness of random just how random is the world?
raindrops and horse races<br>
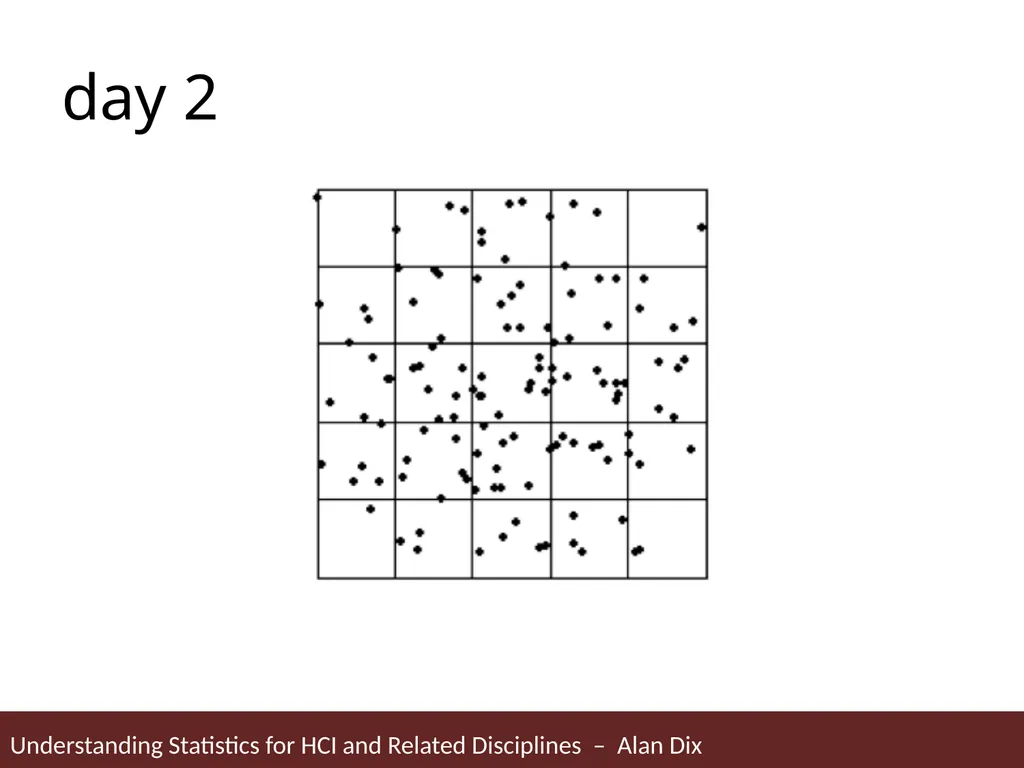
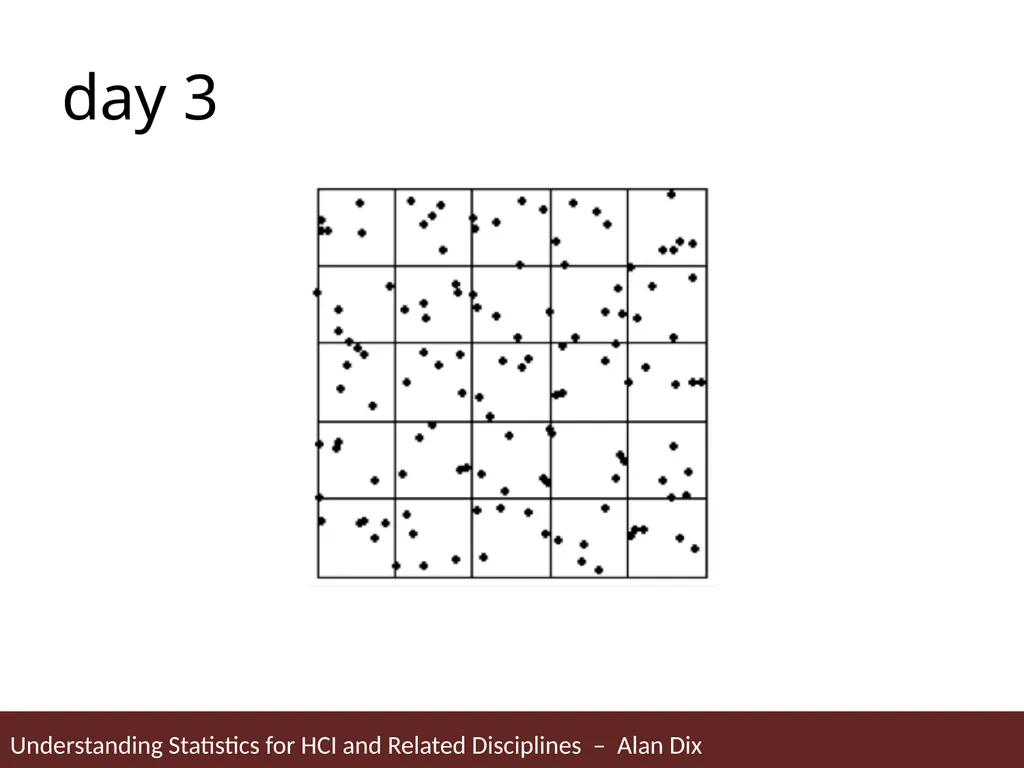
slide3. a story In the far off land of Gheisra there lies the plain of Nali. For one hundred miles in each direction it spreads, featureless and flat, no vegetation, no habitation; except, at its very centre, a pavement of 25 tiles of stone, each perfectly level with the others and with the surrounding land.
The origins of this pavement are unknown – whether it was set there by some ancient race for its own purposes, or whether it was there from the beginning of the world.
Rain falls but rarely on that barren plain, but when clouds are seen gathering over the plain of Nali, the monks of Gheisra journey on pilgrimage to this shrine of the ancients, to watch for the patterns of the raindrops on the tiles. Oftentimes the rain falls by chance, but sometimes the raindrops form patterns, giving omens of events afar off.
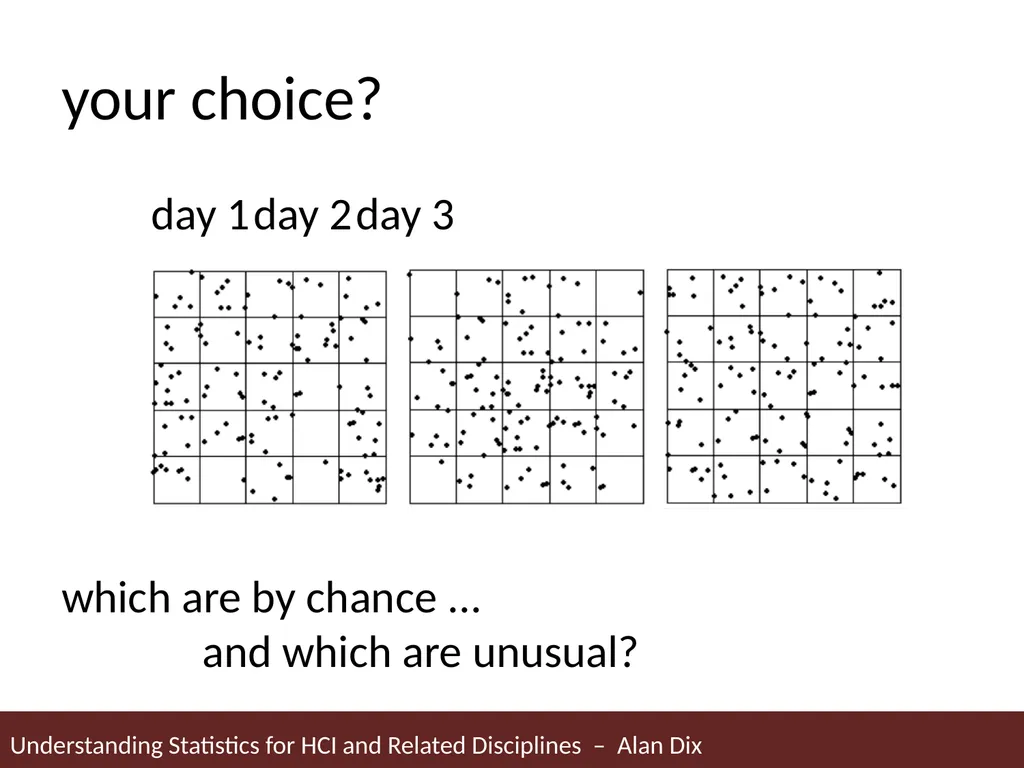
Some of the patterns recorded by the monks are shown on the following pages. Which are mere chance and which foretell great omens?<br>
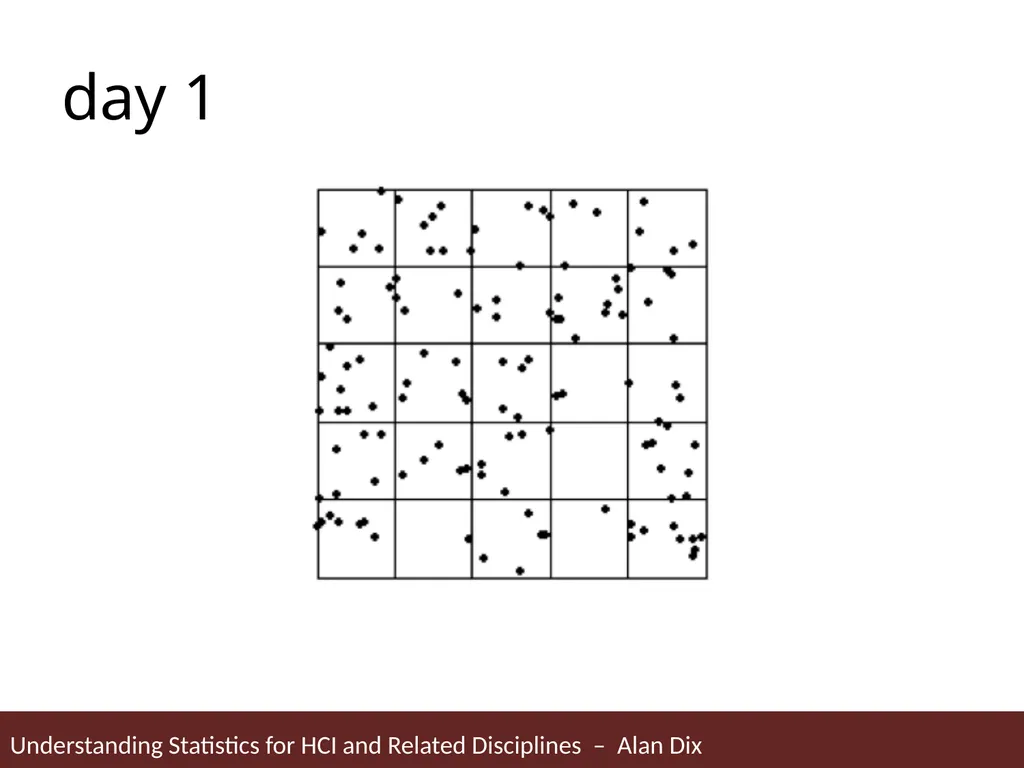
slide4. day 1<br>
slide5. day 2<br>
slide6. day 3<br>
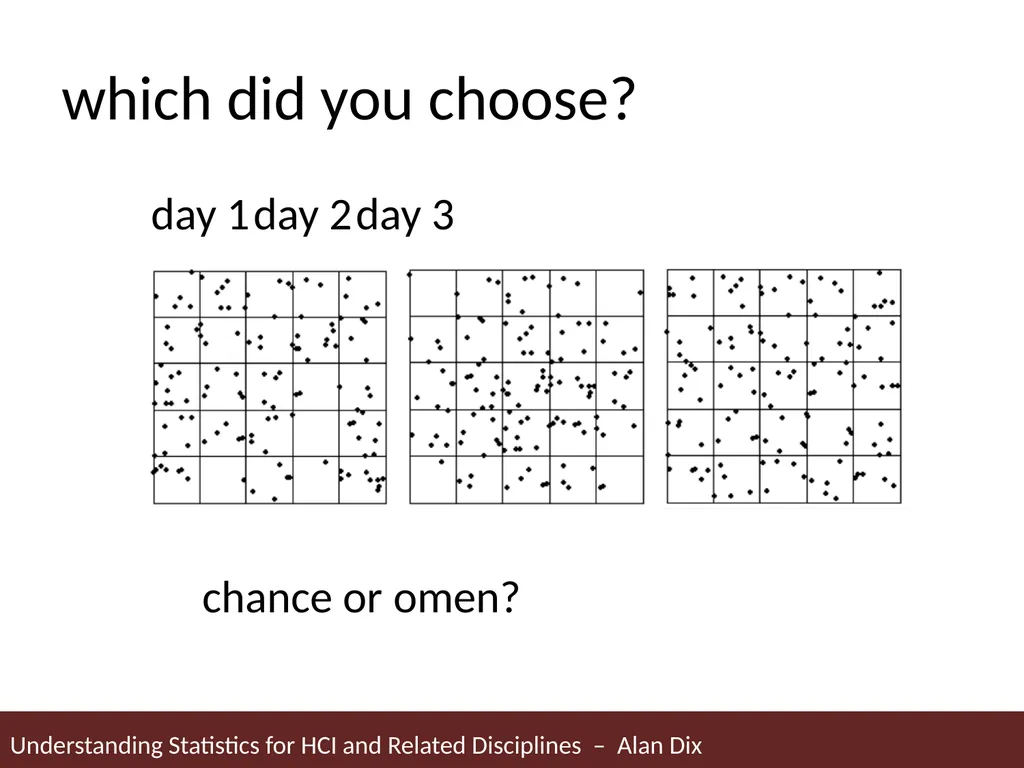
slide7. your choice? day 1 day 2 day 3
which are by chance ... and which are unusual?<br>
slide8. why? ……………………………………….
……………………………………….
……………………………………….<br>
slide9. which did you choose? day 1 day 2 day 3
chance or omen?<br>
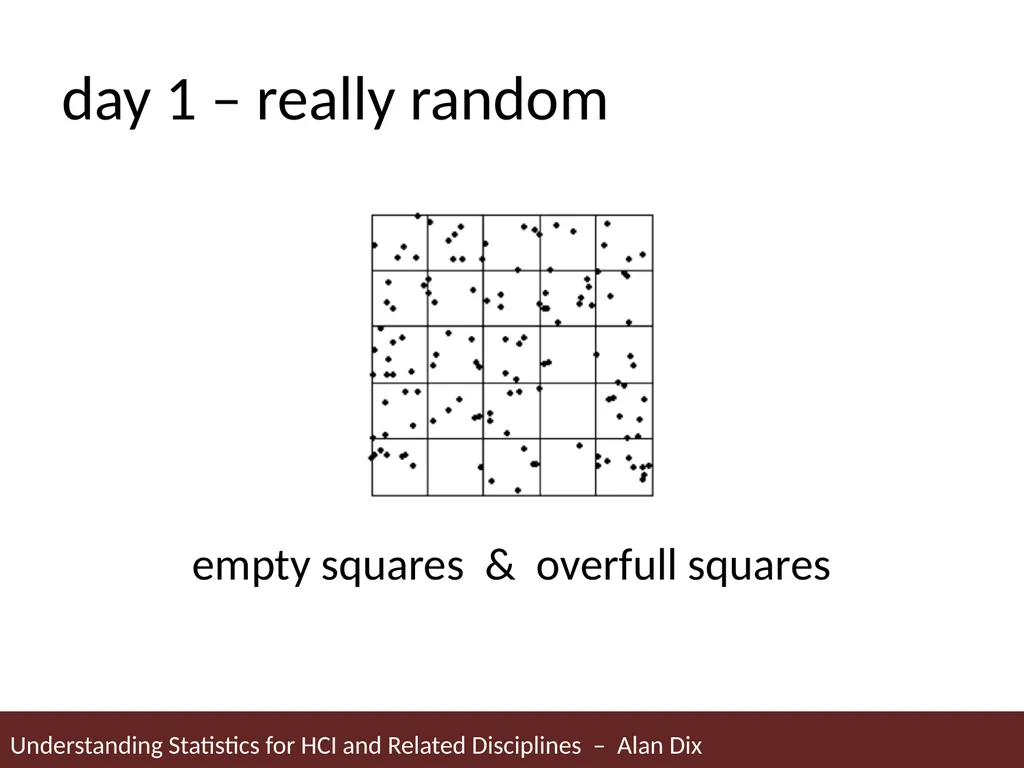
slide10. day 1 – really random empty squares & overfull squares<br>
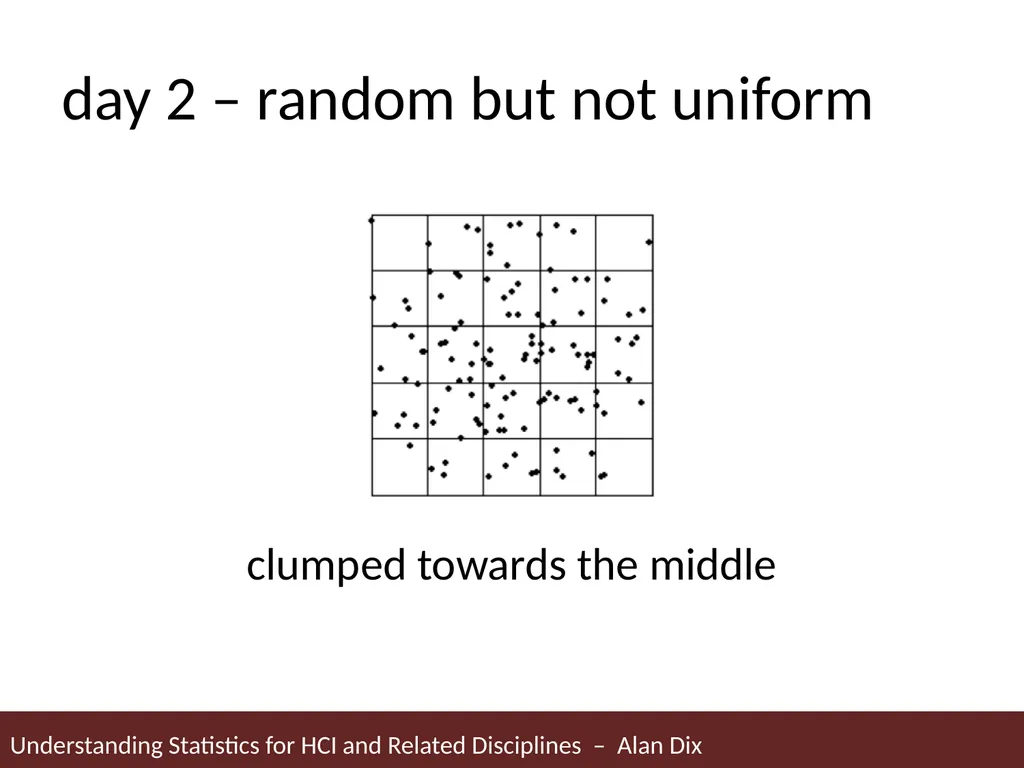
slide11. day 2 – random but not uniform clumped towards the middle<br>
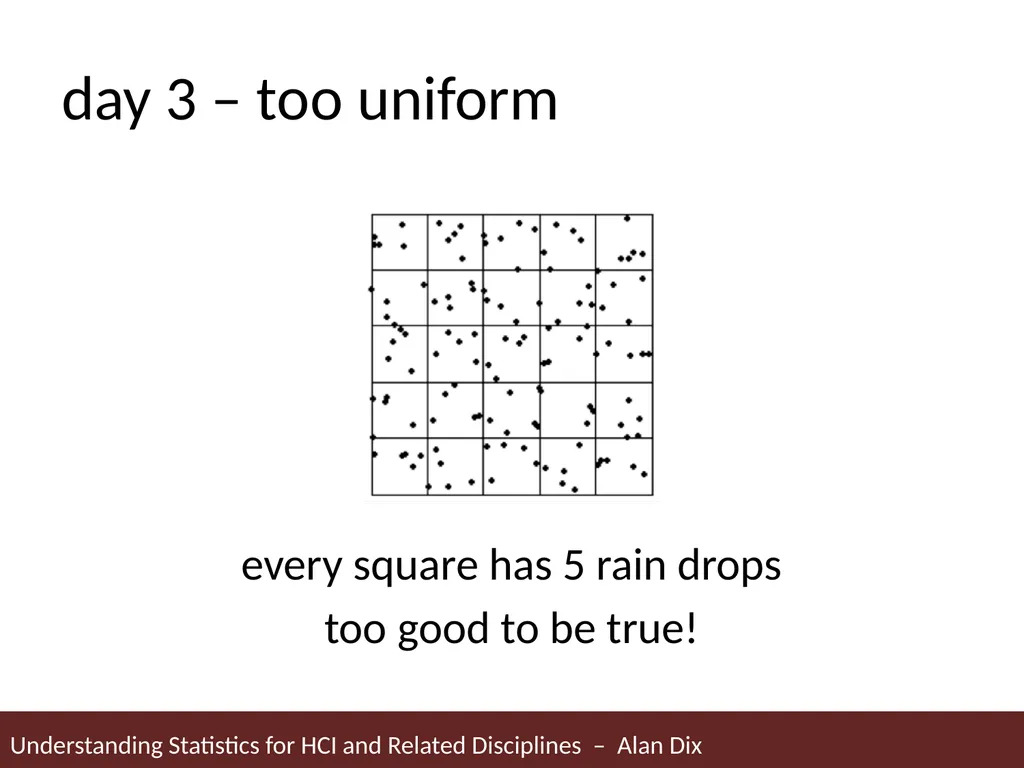
slide12. day 3 – too uniform every square has 5 rain drops
too good to be true!<br>
slide13. two horse races toss 20 coins
add the heads to one row the tails to a second
the winner is the first row to 10
before you start: what do you think will happen?<br>
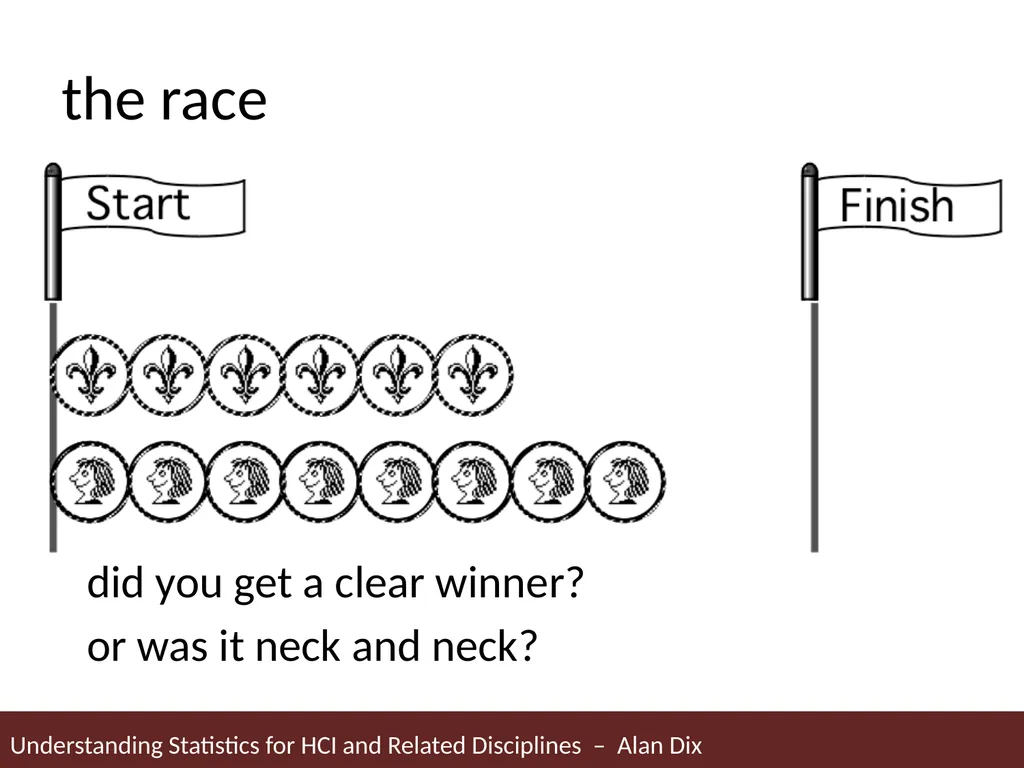
slide14. the race did you get a clear winner?
or was it neck and neck?<br>
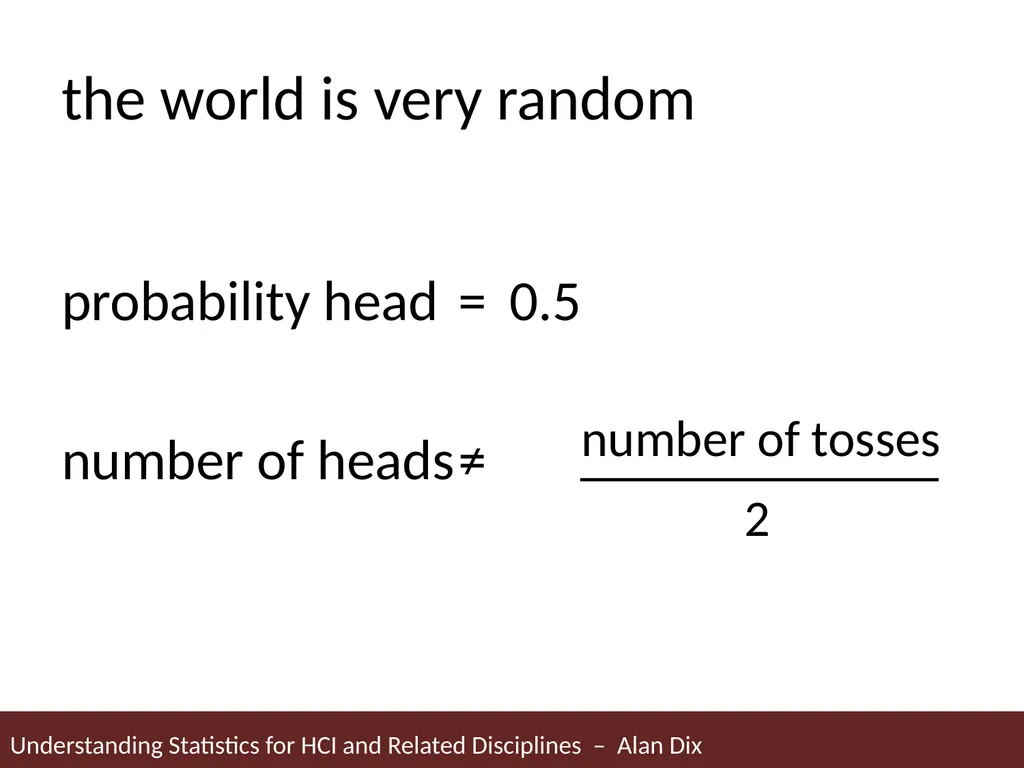
slide15. the world is very random probability head = 0.5
number of heads ≠<br>
slide16. lessons apparent differences may be chance
real data has some bad values
e.g. Mendel's sweet peas and electron charge discovery were both too good!<br>
slide18. quick (and dirty!) tip for survey or other count data
do square root times two<br>
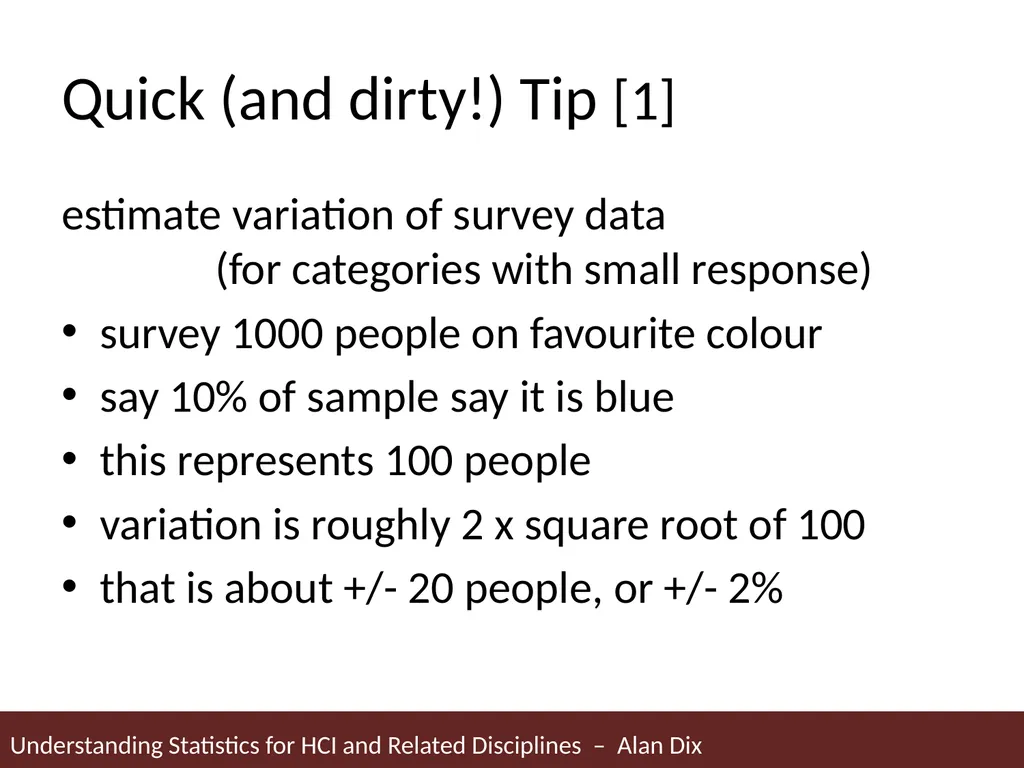
slide19. Quick (and dirty!) Tip [1] estimate variation of survey data (for categories with small response)
survey 1000 people on favourite colour
say 10% of sample say it is blue
this represents 100 people
variation is roughly 2 x square root of 100
that is about +/- 20 people, or +/- 2%<br>
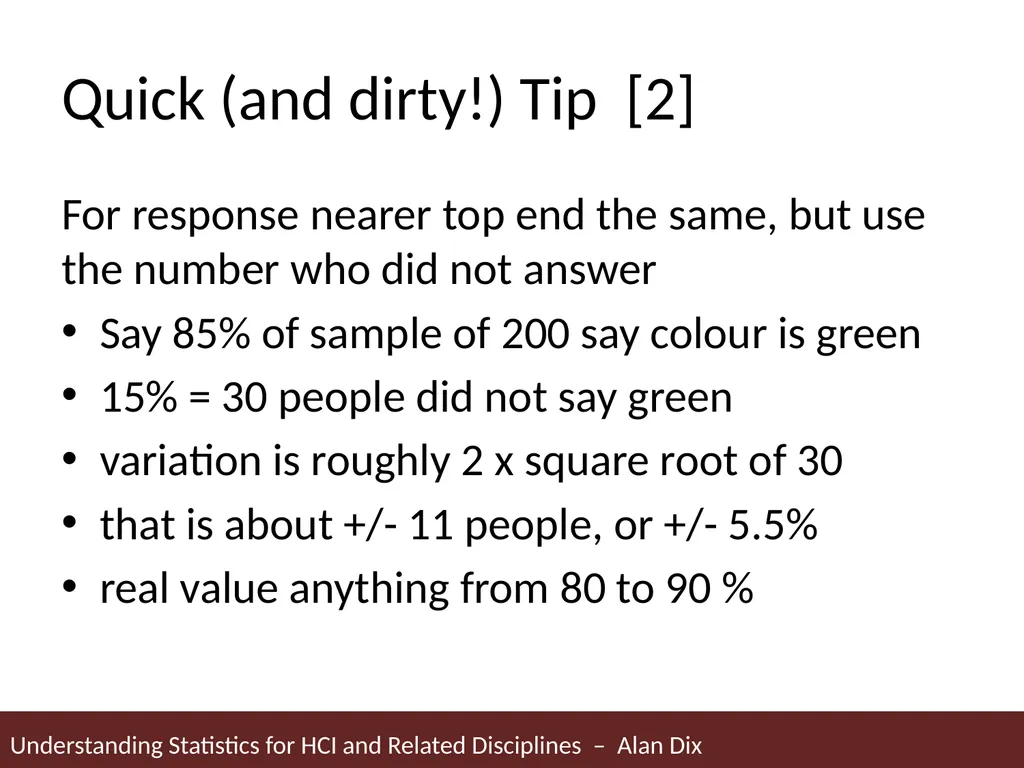
slide20. Quick (and dirty!) Tip [2] For response nearer top end the same, but use the number who did not answer
Say 85% of sample of 200 say colour is green
15% = 30 people did not say green
variation is roughly 2 x square root of 30
that is about +/- 11 people, or +/- 5.5%
real value anything from 80 to 90 %<br>
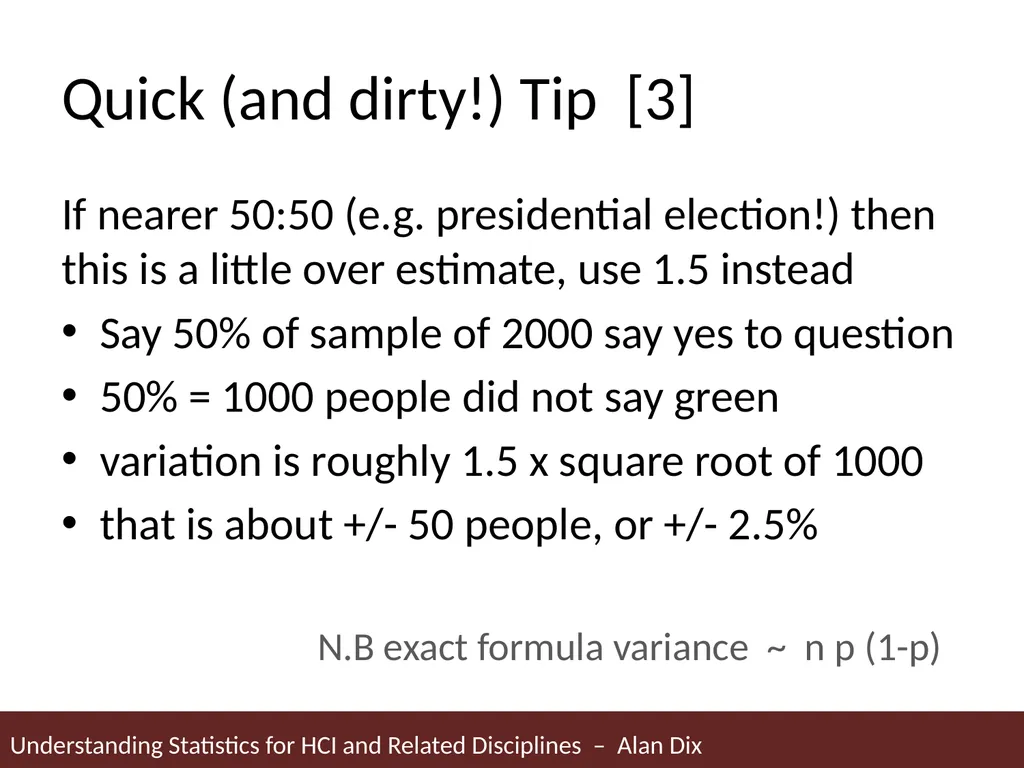
slide21. Quick (and dirty!) Tip [3] If nearer 50:50 (e.g. presidential election!) then this is a little over estimate, use 1.5 instead
Say 50% of sample of 2000 say yes to question
50% = 1000 people did not say green
variation is roughly 1.5 x square root of 1000
that is about +/- 50 people, or +/- 2.5%
N.B exact formula variance ~ n p (1-p)<br>
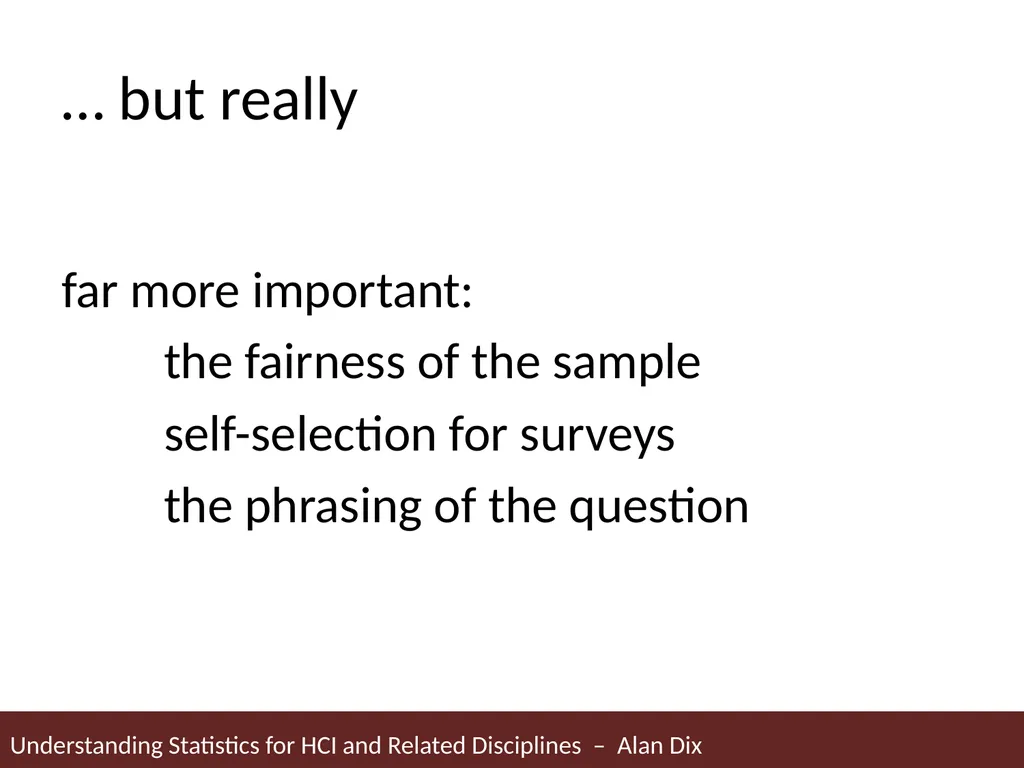
slide22. … but really far more important:
the fairness of the sample
self-selection for surveys
the phrasing of the question<br>
slide24. bias and variability is it fair?
is it reliable?<br>
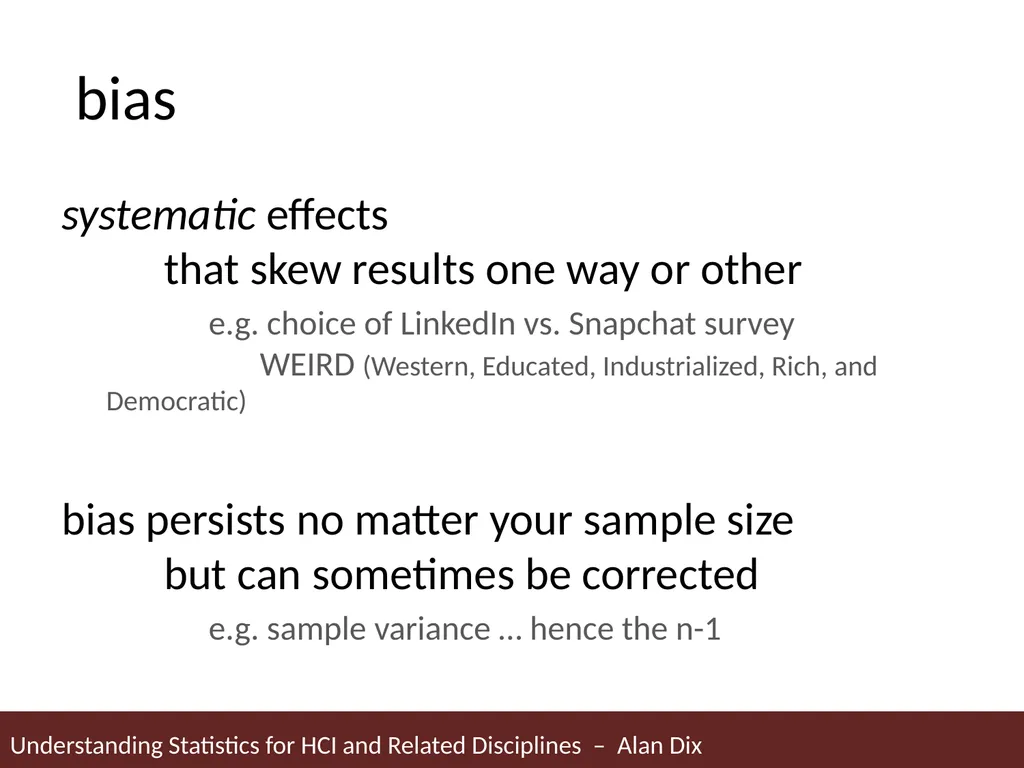
slide25. bias systematic effects that skew results one way or other
e.g. choice of LinkedIn vs. Snapchat survey WEIRD (Western, Educated, Industrialized, Rich, and Democratic)
bias persists no matter your sample size but can sometimes be corrected
e.g. sample variance … hence the n-1<br>
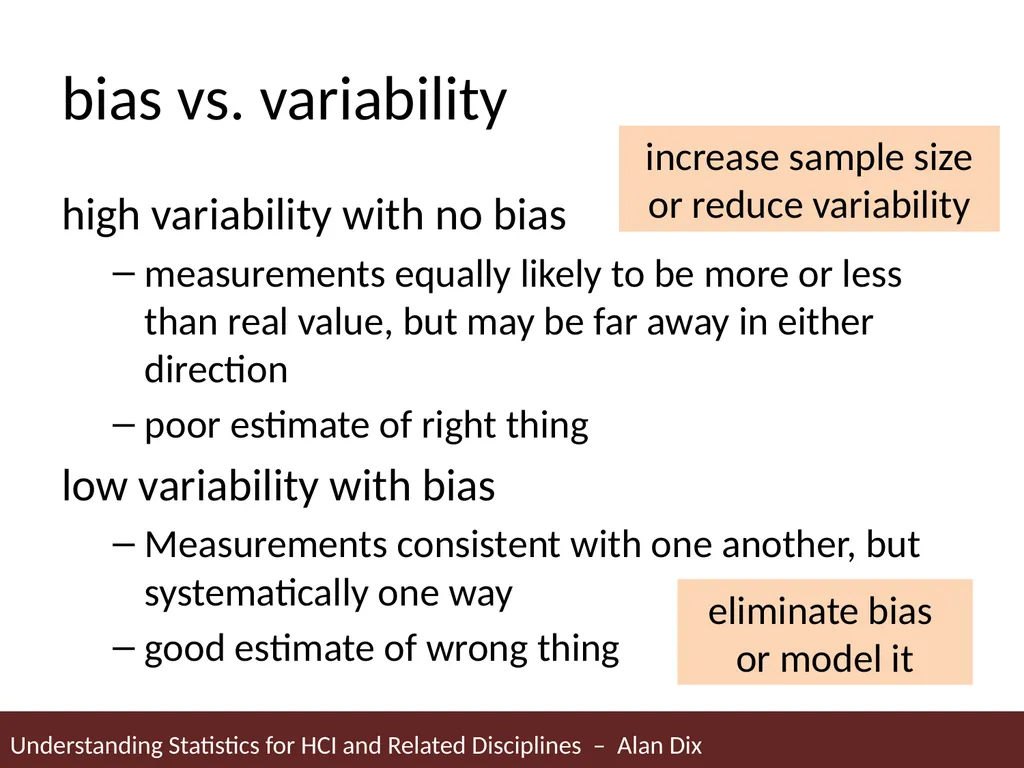
slide26. bias vs. variability high variability with no bias
measurements equally likely to be more or less than real value, but may be far away in either direction
poor estimate of right thing
low variability with bias
Measurements consistent with one another, but systematically one way
good estimate of wrong thing increase sample size or reduce variability eliminate bias or model it<br>
slide28. independence and non-independence do buses really come in threes?<br>
slide29. independence different kinds of independence:
measurements (normal kind)
factor effects
sample prevalence
non-independence often increases variability
… but may cause bias too<br>
slide30. independence – measurements measurements may be related to each other:
order effects
sequential measures on same person (learning, etc.)
‘day effects’
e.g. sunny day improves productivity
experimenter effects
your mood effects participants
all increase variability<br>
slide31. independence – factor effects Relationships and correlations between things you are measuring (or failing to measure)
can confuse causality
e.g. death rates often higher in specialist hospitals
… because more sick people sent there
even reverse effects
… Simpson Paradox<br>
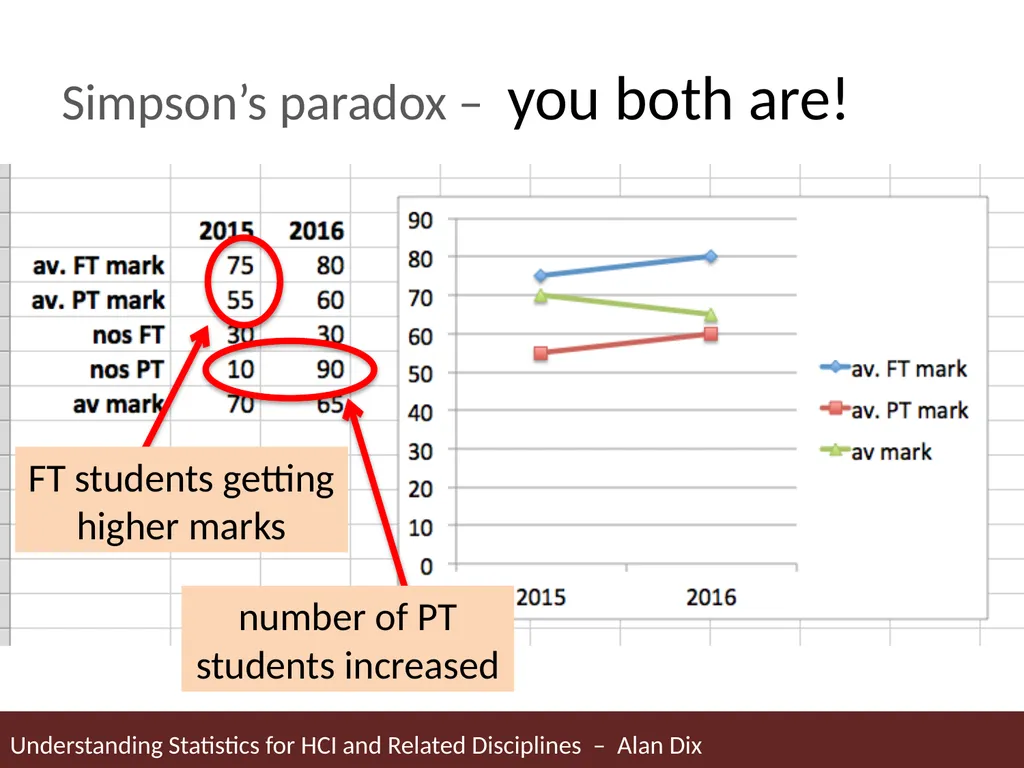
slide32. Simpson’s Paradox You run a course with some full-time and some part-time students
You calculate:
average FT student marks increase each year
average PT student marks also increase each year
University complains your marks are going down
Who is right?<br>
slide33. Simpson’s paradox – you both are!<br>
slide34. independence – sample the way you obtain your sample
internal – subjects related to each other
e.g. snowball sampling
if not external – increases variance
external – subject choice related to topic
e.g. measuring age based on mobile app survey
may create bias<br>
slide35. crucial question Is the way I’ve organised my sample likely to be independent of the thing I want to measure?
e.g. Fitts’ law with different colour targets. Are student subjects likely to behave differently than the general population?<br>
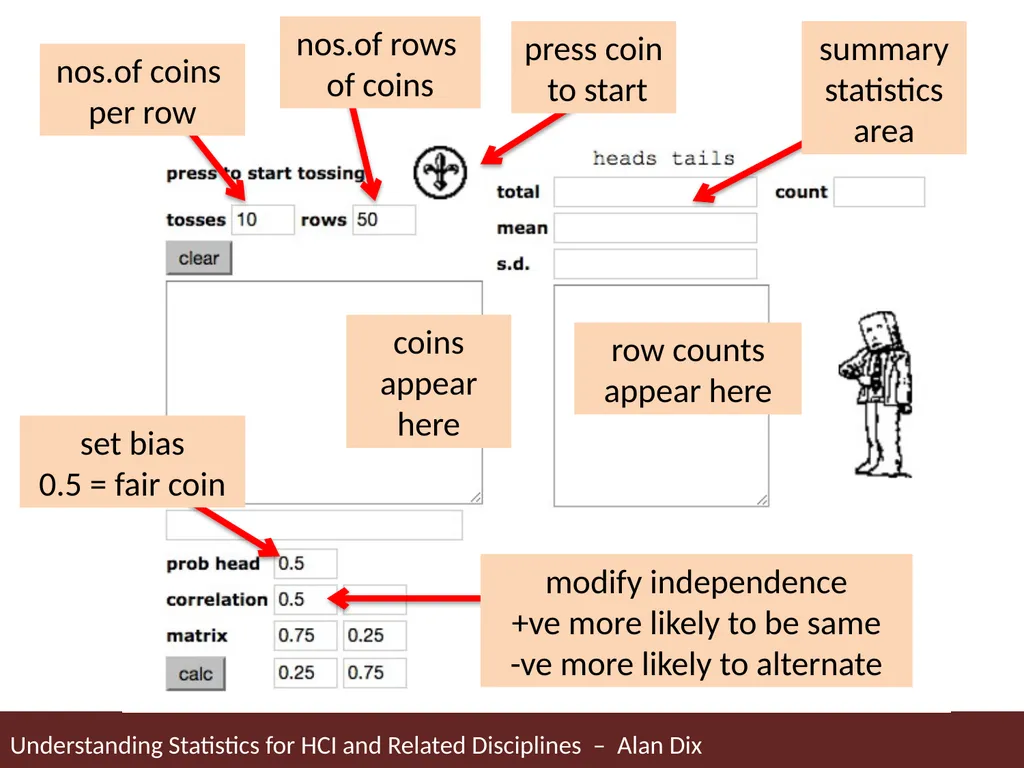
slide37. play! experiment with bias and independence http://www.meandeviation.com/tutorials/stats/morecoin.html<br>
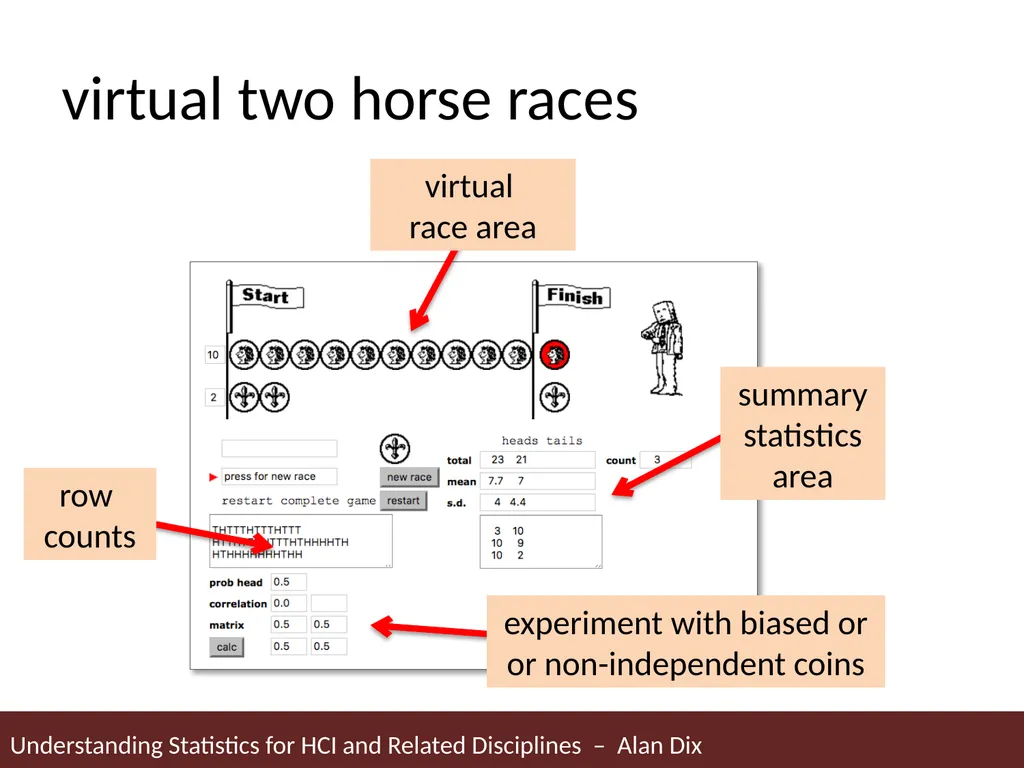
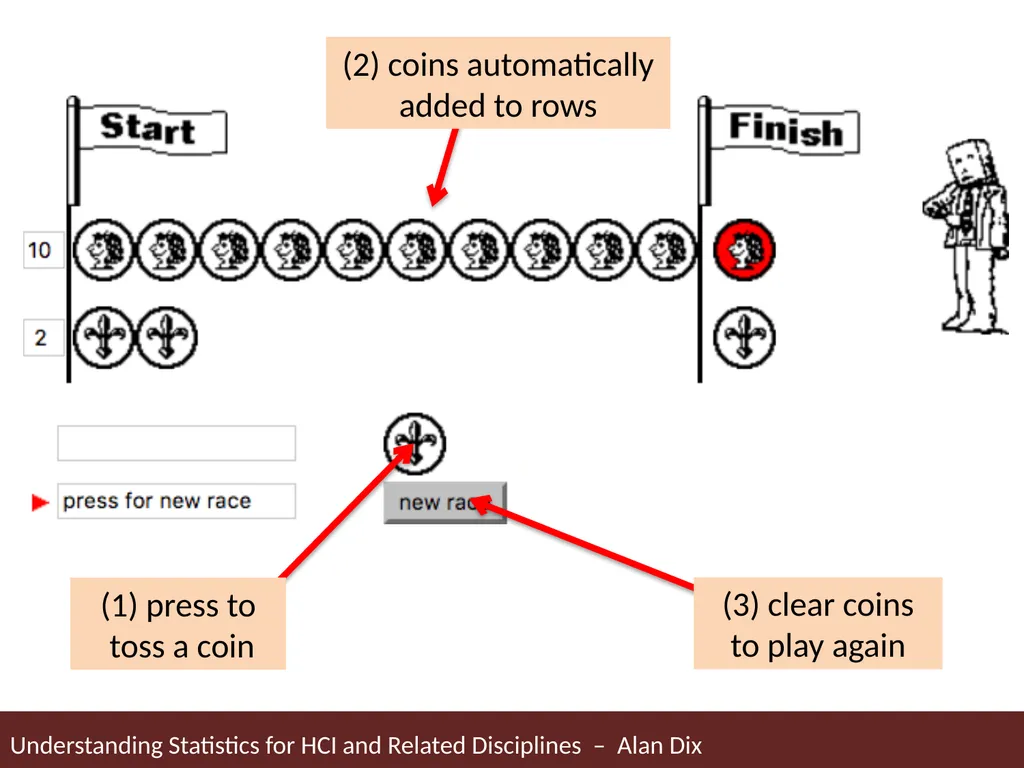
slide38. virtual two horse races<br>
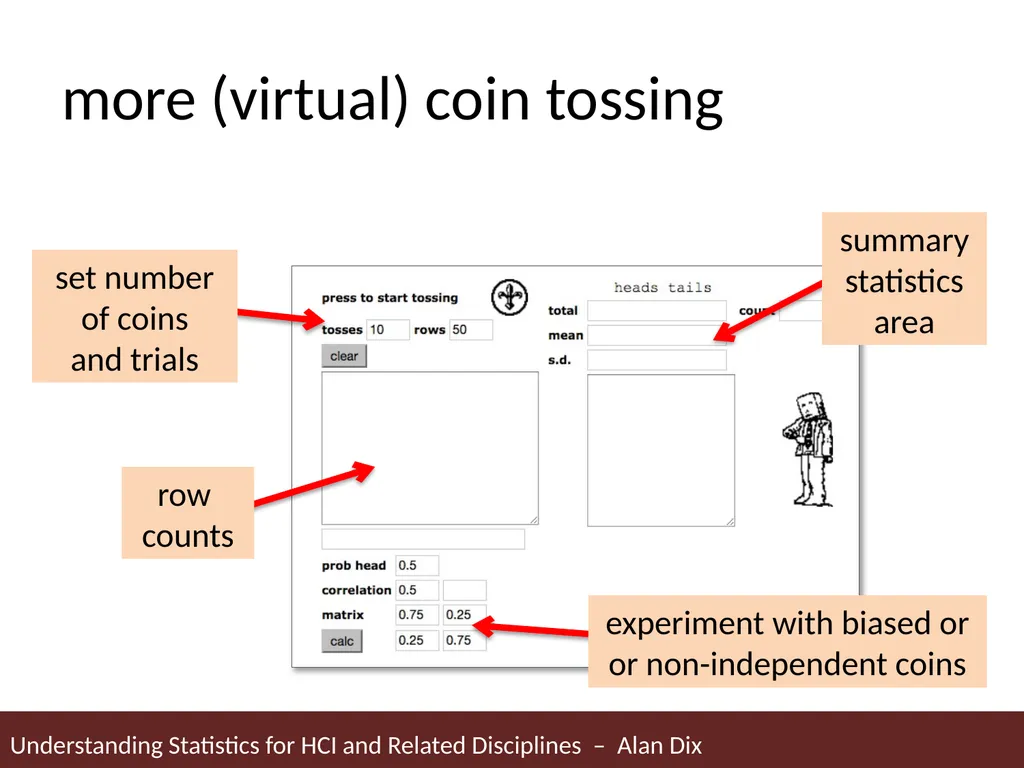
slide41. more (virtual) coin tossing<br>
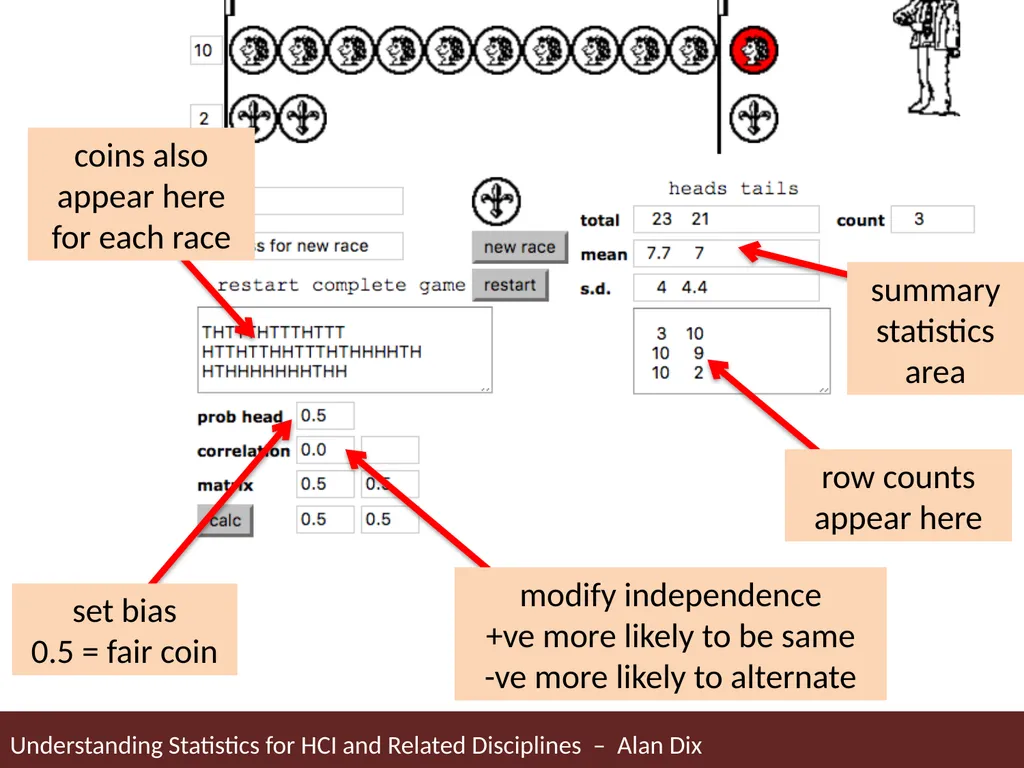
slide42. coins appear here row counts appear here<br>
slide43. fair coin (independent tosses)<br>
slide44. biased coin (independent)<br>
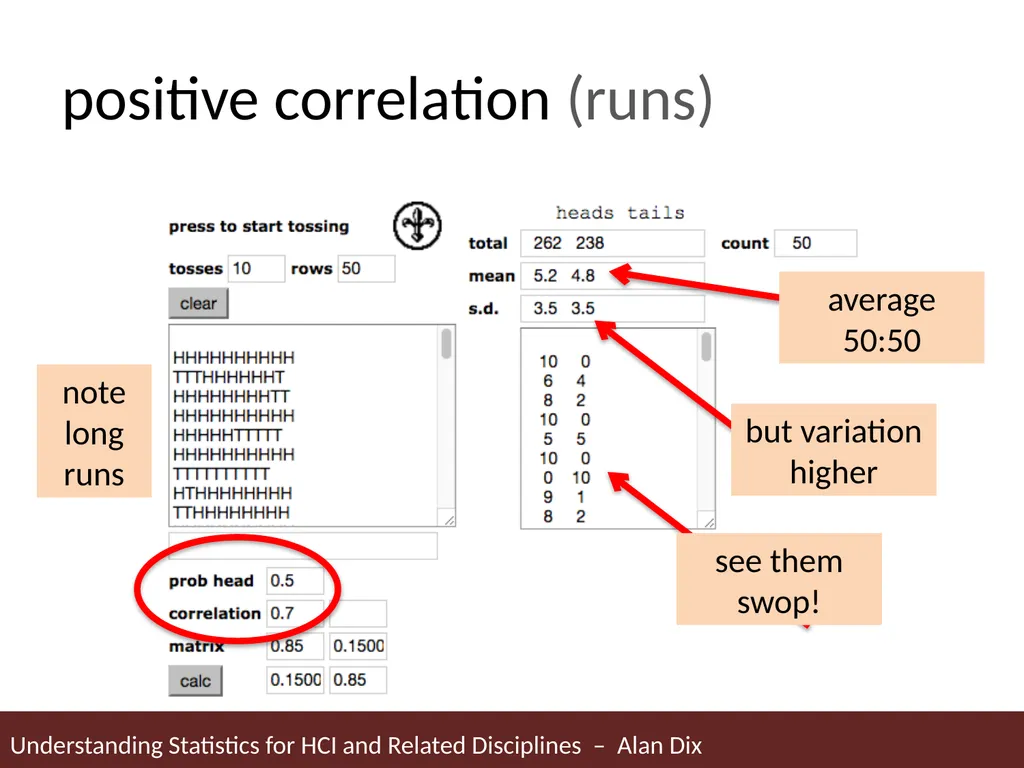
slide45. positive correlation (runs) note long runs<br>
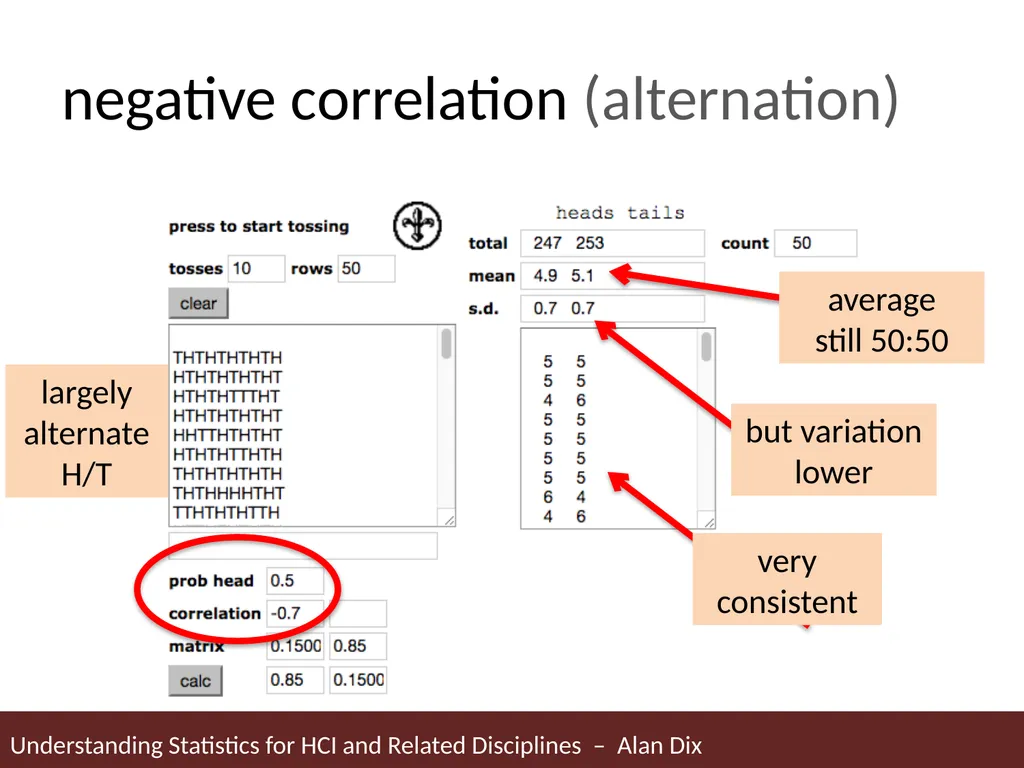
slide46. negative correlation (alternation) largely alternate H/T<br>
slide48. distributions discrete or continuous bounds and tails<br>
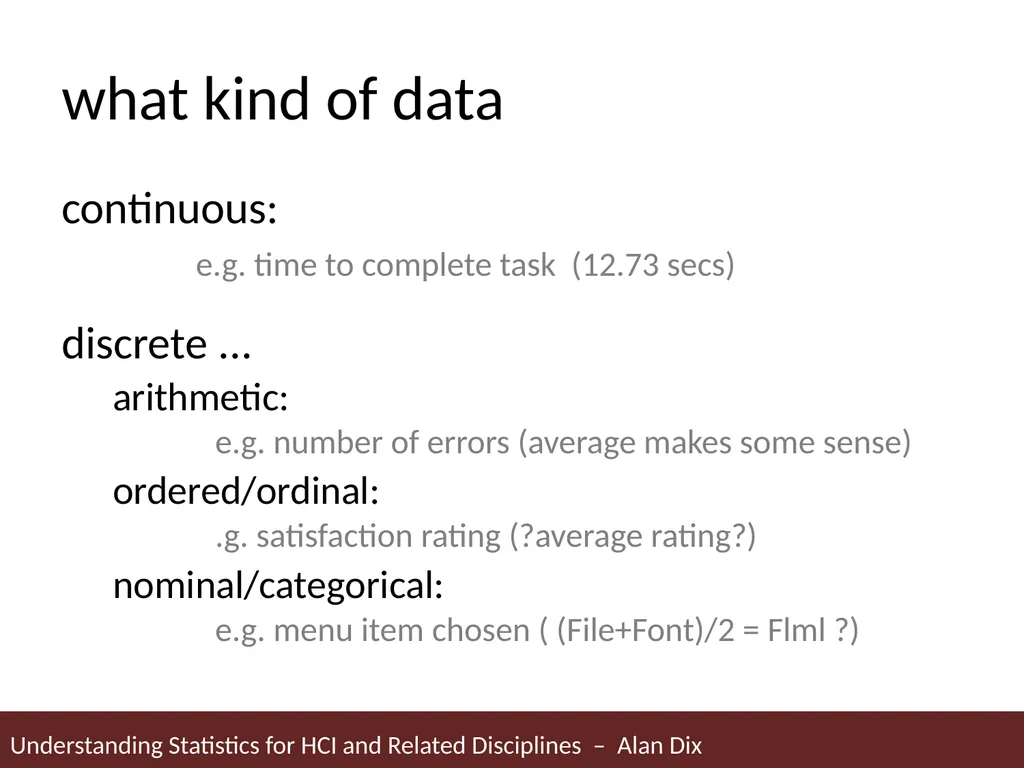
slide49. what kind of data continuous:
e.g. time to complete task (12.73 secs)
discrete ...
arithmetic: e.g. number of errors (average makes some sense)
ordered/ordinal: .g. satisfaction rating (?average rating?)
nominal/categorical: e.g. menu item chosen ( (File+Font)/2 = Flml ?)<br>
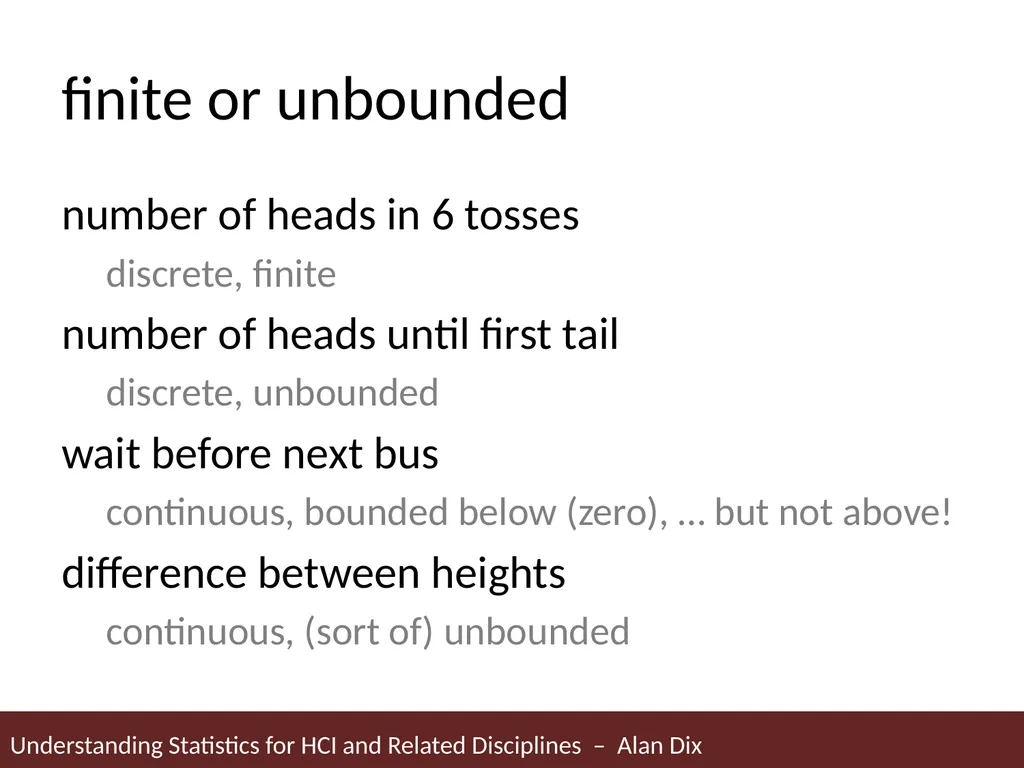
slide50. finite or unbounded number of heads in 6 tosses
discrete, finite
number of heads until first tail
discrete, unbounded
wait before next bus
continuous, bounded below (zero), … but not above!
difference between heights
continuous, (sort of) unbounded<br>
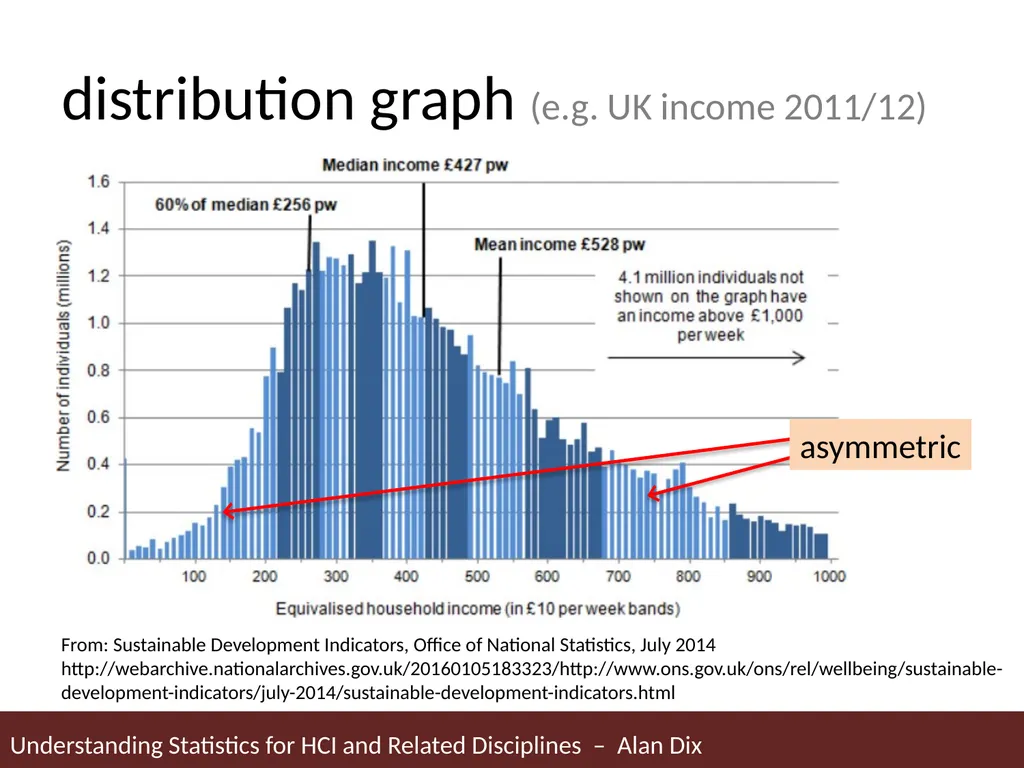
slide51. distribution graph (e.g. UK income 2011/12) From: Sustainable Development Indicators, Office of National Statistics, July 2014 http://webarchive.nationalarchives.gov.uk/20160105183323/http://www.ons.gov.uk/ons/rel/wellbeing/sustainable-development-indicators/july-2014/sustainable-development-indicators.html<br>
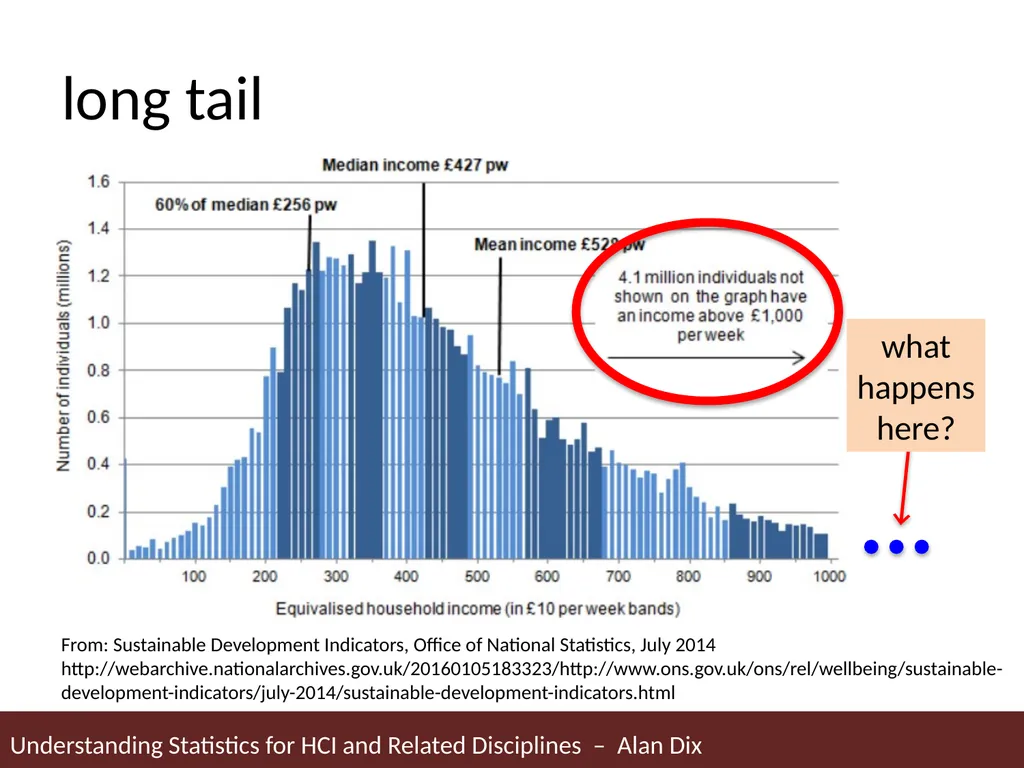
slide52. long tail From: Sustainable Development Indicators, Office of National Statistics, July 2014 http://webarchive.nationalarchives.gov.uk/20160105183323/http://www.ons.gov.uk/ons/rel/wellbeing/sustainable-development-indicators/july-2014/sustainable-development-indicators.html what happens here?<br>
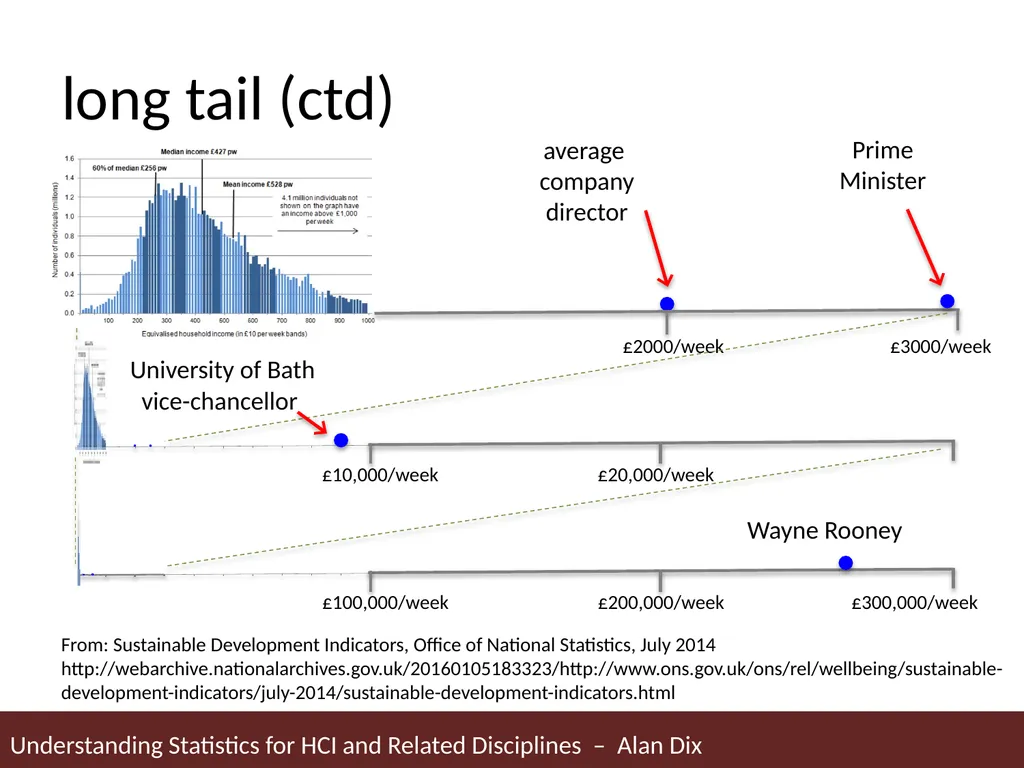
slide53. long tail (ctd) From: Sustainable Development Indicators, Office of National Statistics, July 2014 http://webarchive.nationalarchives.gov.uk/20160105183323/http://www.ons.gov.uk/ons/rel/wellbeing/sustainable-development-indicators/july-2014/sustainable-development-indicators.html average company director £2000/week Prime Minister £3000/week<br>
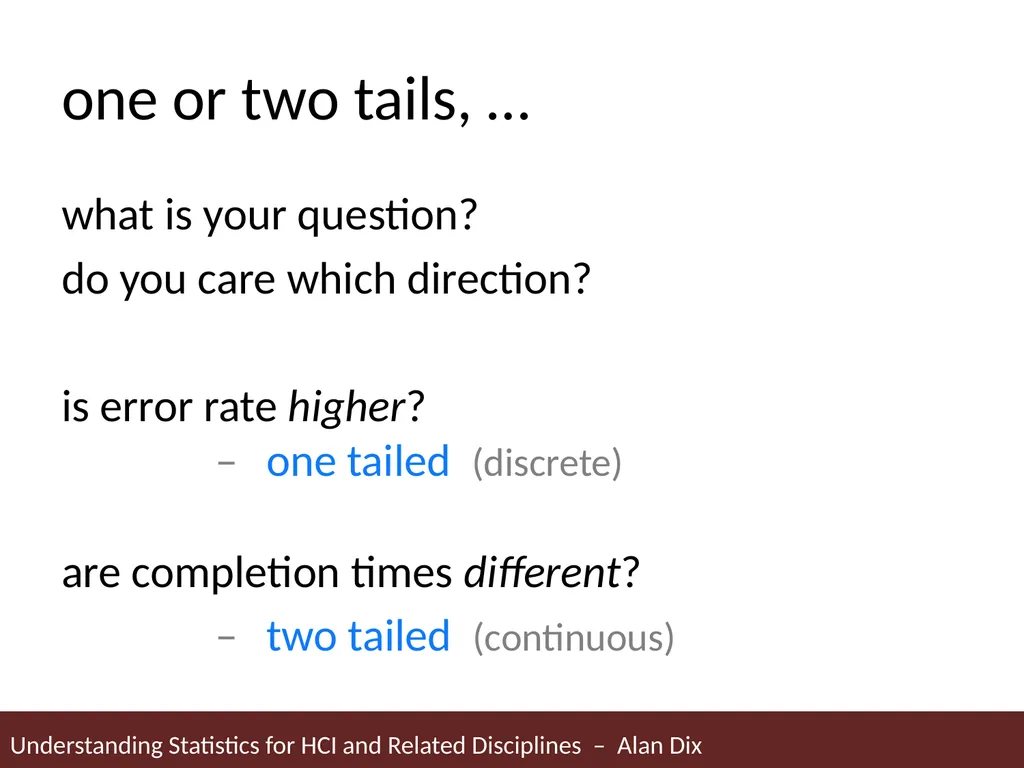
slide54. one or two tails, … what is your question?
do you care which direction?
is error rate higher? – one tailed (discrete)
are completion times different?
– two tailed (continuous)<br>
slide56. normal or not approximations central limit theorem power law<br>
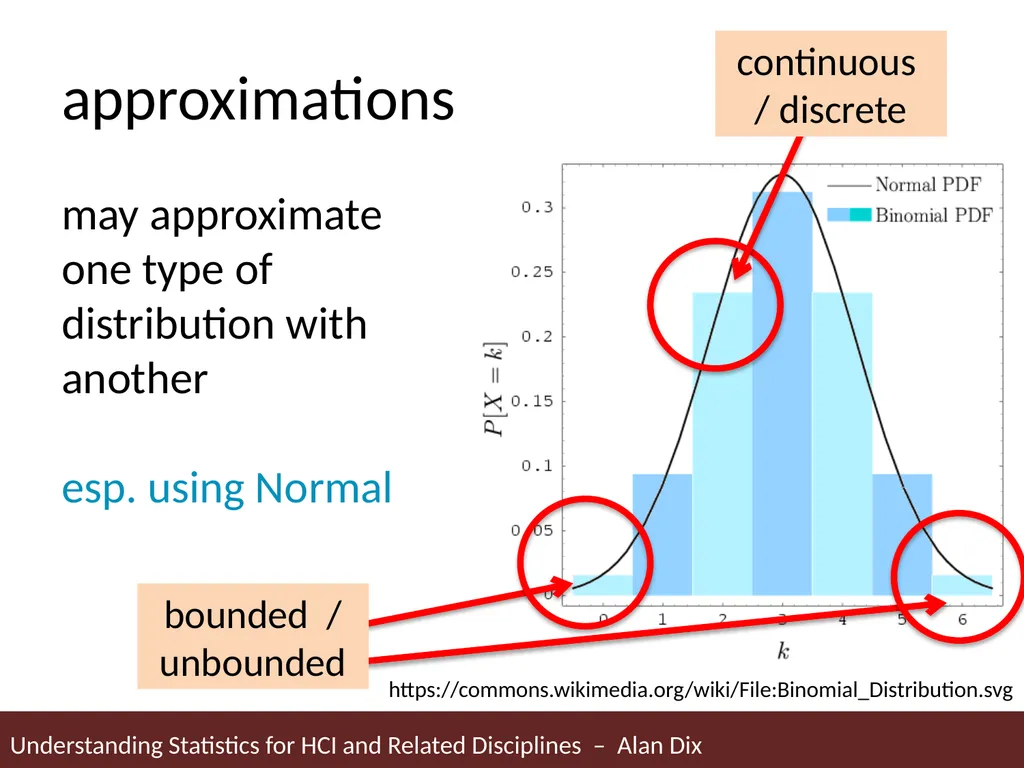
slide57. approximations may approximate one type of distribution with another esp. using Normal https://commons.wikimedia.org/wiki/File:Binomial_Distribution.svg<br>
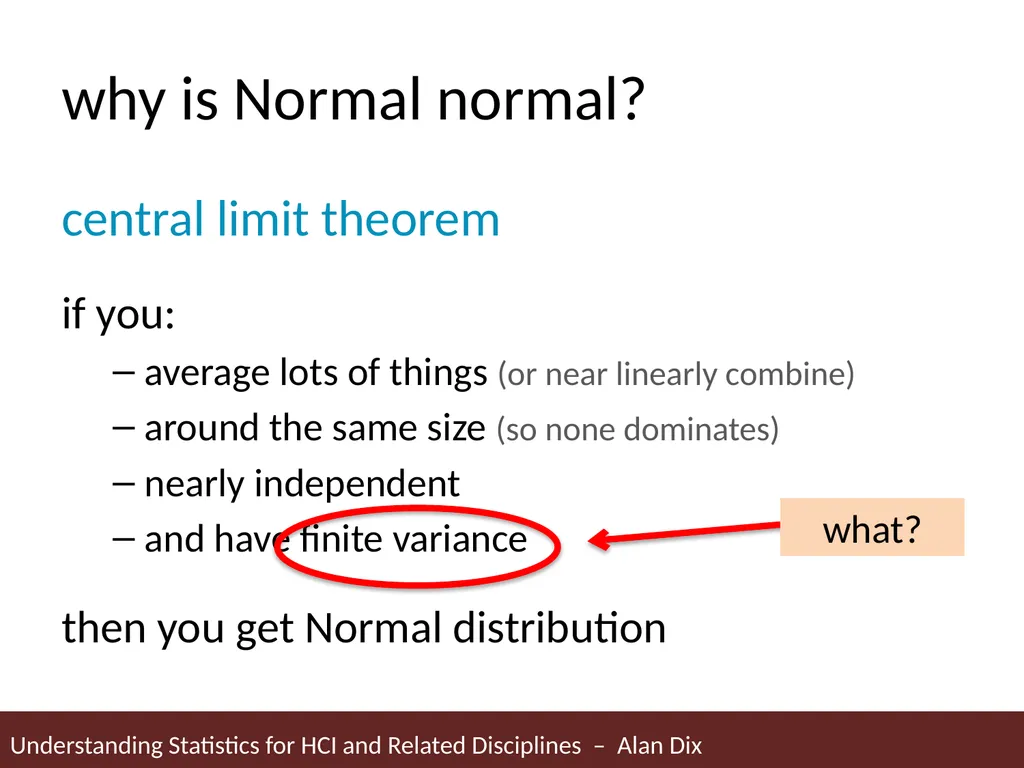
slide58. why is Normal normal? central limit theorem
if you:
average lots of things (or near linearly combine)
around the same size (so none dominates)
nearly independent
and have finite variance
then you get Normal distribution<br>
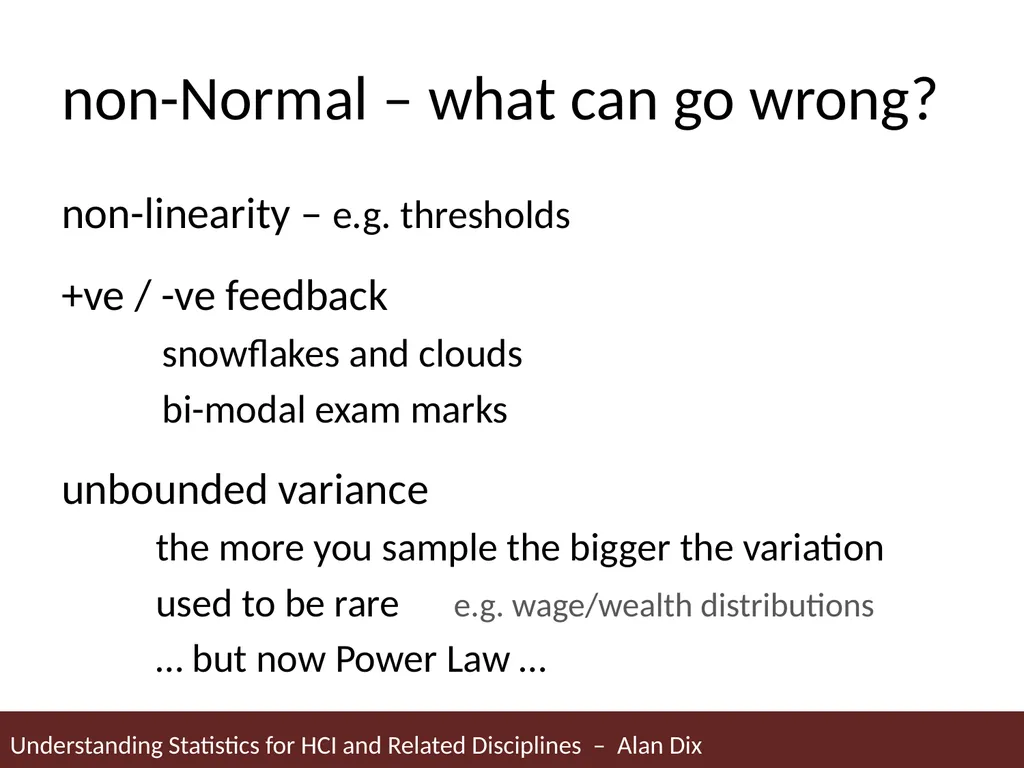
slide59. non-Normal – what can go wrong? non-linearity – e.g. thresholds
+ve / -ve feedback
snowflakes and clouds
bi-modal exam marks
unbounded variance
the more you sample the bigger the variation
used to be rare e.g. wage/wealth distributions
… but now Power Law …<br>
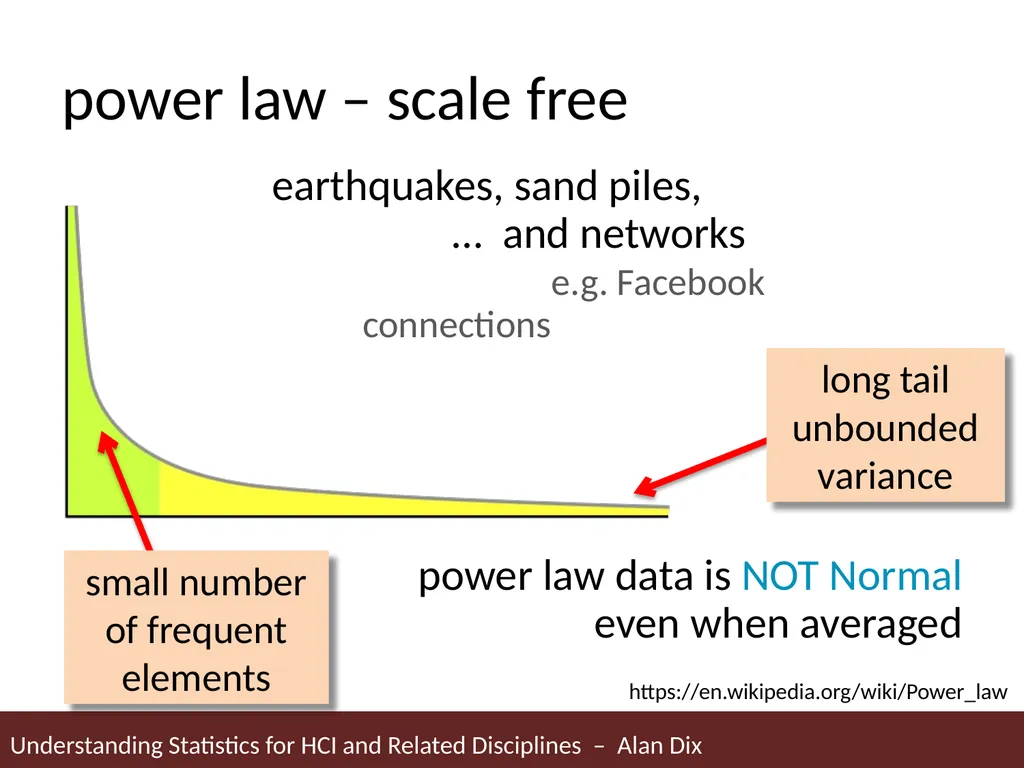
slide60. earthquakes, sand piles, … and networks e.g. Facebook connections
power law data is NOT Normal even when averaged power law – scale free https://en.wikipedia.org/wiki/Power_law<br>
http://alandix.com/statistics/<br>
slide2. unexpected wildness of random just how random is the world?
raindrops and horse races<br>
slide3. a story In the far off land of Gheisra there lies the plain of Nali. For one hundred miles in each direction it spreads, featureless and flat, no vegetation, no habitation; except, at its very centre, a pavement of 25 tiles of stone, each perfectly level with the others and with the surrounding land.
The origins of this pavement are unknown – whether it was set there by some ancient race for its own purposes, or whether it was there from the beginning of the world.
Rain falls but rarely on that barren plain, but when clouds are seen gathering over the plain of Nali, the monks of Gheisra journey on pilgrimage to this shrine of the ancients, to watch for the patterns of the raindrops on the tiles. Oftentimes the rain falls by chance, but sometimes the raindrops form patterns, giving omens of events afar off.
Some of the patterns recorded by the monks are shown on the following pages. Which are mere chance and which foretell great omens?<br>
slide4. day 1<br>
slide5. day 2<br>
slide6. day 3<br>
slide7. your choice? day 1 day 2 day 3
which are by chance ... and which are unusual?<br>
slide8. why? ……………………………………….
……………………………………….
……………………………………….<br>
slide9. which did you choose? day 1 day 2 day 3
chance or omen?<br>
slide10. day 1 – really random empty squares & overfull squares<br>
slide11. day 2 – random but not uniform clumped towards the middle<br>
slide12. day 3 – too uniform every square has 5 rain drops
too good to be true!<br>
slide13. two horse races toss 20 coins
add the heads to one row the tails to a second
the winner is the first row to 10
before you start: what do you think will happen?<br>
slide14. the race did you get a clear winner?
or was it neck and neck?<br>
slide15. the world is very random probability head = 0.5
number of heads ≠<br>
slide16. lessons apparent differences may be chance
real data has some bad values
e.g. Mendel's sweet peas and electron charge discovery were both too good!<br>
slide18. quick (and dirty!) tip for survey or other count data
do square root times two<br>
slide19. Quick (and dirty!) Tip [1] estimate variation of survey data (for categories with small response)
survey 1000 people on favourite colour
say 10% of sample say it is blue
this represents 100 people
variation is roughly 2 x square root of 100
that is about +/- 20 people, or +/- 2%<br>
slide20. Quick (and dirty!) Tip [2] For response nearer top end the same, but use the number who did not answer
Say 85% of sample of 200 say colour is green
15% = 30 people did not say green
variation is roughly 2 x square root of 30
that is about +/- 11 people, or +/- 5.5%
real value anything from 80 to 90 %<br>
slide21. Quick (and dirty!) Tip [3] If nearer 50:50 (e.g. presidential election!) then this is a little over estimate, use 1.5 instead
Say 50% of sample of 2000 say yes to question
50% = 1000 people did not say green
variation is roughly 1.5 x square root of 1000
that is about +/- 50 people, or +/- 2.5%
N.B exact formula variance ~ n p (1-p)<br>
slide22. … but really far more important:
the fairness of the sample
self-selection for surveys
the phrasing of the question<br>
slide24. bias and variability is it fair?
is it reliable?<br>
slide25. bias systematic effects that skew results one way or other
e.g. choice of LinkedIn vs. Snapchat survey WEIRD (Western, Educated, Industrialized, Rich, and Democratic)
bias persists no matter your sample size but can sometimes be corrected
e.g. sample variance … hence the n-1<br>
slide26. bias vs. variability high variability with no bias
measurements equally likely to be more or less than real value, but may be far away in either direction
poor estimate of right thing
low variability with bias
Measurements consistent with one another, but systematically one way
good estimate of wrong thing increase sample size or reduce variability eliminate bias or model it<br>
slide28. independence and non-independence do buses really come in threes?<br>
slide29. independence different kinds of independence:
measurements (normal kind)
factor effects
sample prevalence
non-independence often increases variability
… but may cause bias too<br>
slide30. independence – measurements measurements may be related to each other:
order effects
sequential measures on same person (learning, etc.)
‘day effects’
e.g. sunny day improves productivity
experimenter effects
your mood effects participants
all increase variability<br>
slide31. independence – factor effects Relationships and correlations between things you are measuring (or failing to measure)
can confuse causality
e.g. death rates often higher in specialist hospitals
… because more sick people sent there
even reverse effects
… Simpson Paradox<br>
slide32. Simpson’s Paradox You run a course with some full-time and some part-time students
You calculate:
average FT student marks increase each year
average PT student marks also increase each year
University complains your marks are going down
Who is right?<br>
slide33. Simpson’s paradox – you both are!<br>
slide34. independence – sample the way you obtain your sample
internal – subjects related to each other
e.g. snowball sampling
if not external – increases variance
external – subject choice related to topic
e.g. measuring age based on mobile app survey
may create bias<br>
slide35. crucial question Is the way I’ve organised my sample likely to be independent of the thing I want to measure?
e.g. Fitts’ law with different colour targets. Are student subjects likely to behave differently than the general population?<br>
slide37. play! experiment with bias and independence http://www.meandeviation.com/tutorials/stats/morecoin.html<br>
slide38. virtual two horse races<br>
slide41. more (virtual) coin tossing<br>
slide42. coins appear here row counts appear here<br>
slide43. fair coin (independent tosses)<br>
slide44. biased coin (independent)<br>
slide45. positive correlation (runs) note long runs<br>
slide46. negative correlation (alternation) largely alternate H/T<br>
slide48. distributions discrete or continuous bounds and tails<br>
slide49. what kind of data continuous:
e.g. time to complete task (12.73 secs)
discrete ...
arithmetic: e.g. number of errors (average makes some sense)
ordered/ordinal: .g. satisfaction rating (?average rating?)
nominal/categorical: e.g. menu item chosen ( (File+Font)/2 = Flml ?)<br>
slide50. finite or unbounded number of heads in 6 tosses
discrete, finite
number of heads until first tail
discrete, unbounded
wait before next bus
continuous, bounded below (zero), … but not above!
difference between heights
continuous, (sort of) unbounded<br>
slide51. distribution graph (e.g. UK income 2011/12) From: Sustainable Development Indicators, Office of National Statistics, July 2014 http://webarchive.nationalarchives.gov.uk/20160105183323/http://www.ons.gov.uk/ons/rel/wellbeing/sustainable-development-indicators/july-2014/sustainable-development-indicators.html<br>
slide52. long tail From: Sustainable Development Indicators, Office of National Statistics, July 2014 http://webarchive.nationalarchives.gov.uk/20160105183323/http://www.ons.gov.uk/ons/rel/wellbeing/sustainable-development-indicators/july-2014/sustainable-development-indicators.html what happens here?<br>
slide53. long tail (ctd) From: Sustainable Development Indicators, Office of National Statistics, July 2014 http://webarchive.nationalarchives.gov.uk/20160105183323/http://www.ons.gov.uk/ons/rel/wellbeing/sustainable-development-indicators/july-2014/sustainable-development-indicators.html average company director £2000/week Prime Minister £3000/week<br>
slide54. one or two tails, … what is your question?
do you care which direction?
is error rate higher? – one tailed (discrete)
are completion times different?
– two tailed (continuous)<br>
slide56. normal or not approximations central limit theorem power law<br>
slide57. approximations may approximate one type of distribution with another esp. using Normal https://commons.wikimedia.org/wiki/File:Binomial_Distribution.svg<br>
slide58. why is Normal normal? central limit theorem
if you:
average lots of things (or near linearly combine)
around the same size (so none dominates)
nearly independent
and have finite variance
then you get Normal distribution<br>
slide59. non-Normal – what can go wrong? non-linearity – e.g. thresholds
+ve / -ve feedback
snowflakes and clouds
bi-modal exam marks
unbounded variance
the more you sample the bigger the variation
used to be rare e.g. wage/wealth distributions
… but now Power Law …<br>
slide60. earthquakes, sand piles, … and networks e.g. Facebook connections
power law data is NOT Normal even when averaged power law – scale free https://en.wikipedia.org/wiki/Power_law<br>