
Use of Bayesian Hierarchical Models in the
YM
Published · 60 slides · 0 views

1 / 1







Description
Use of Bayesian Hierarchical Models in the Presentation of Subgroup Analyses Mark Rothmann U.S. Food and Drug Administration DIA Bayesian Scientific Working Group Webinar Series November 19, 2021 Disclaimer The views expressed in this
Related Topics
Share
Embed code
Download this presentation From Below
"Use of Bayesian Hierarchical Models in the" is the property of its rightful owner. Permission is granted to download and print the materials on this website for personal, non-commercial use only, and to display it on your personal computer provided you do not modify the materials and that you retain all copyright notices contained in the materials. By downloading content from our website, you accept the terms of this agreement.
Presentation Transcript
01
Use of Bayesian Hierarchical Models in the Presentation of Subgroup Analyses* Mark Rothmann
U.S. Food and Drug Administration
DIA Bayesian Scientific Working Group Webinar Series
November 19, 2021<br>
U.S. Food and Drug Administration
DIA Bayesian Scientific Working Group Webinar Series
November 19, 2021<br>
02
Disclaimer * The views expressed in this talk are those of the speaker and not necessarily those of the FDA<br>
03
Outline Drug Trials Snapshots (DTS)
Heterogeneous Treatment Effects
Different Perspectives
Story
Shrinkage Estimation
Bayesian Hierarchical Models
Examples
Concluding Remarks<br>
Heterogeneous Treatment Effects
Different Perspectives
Story
Shrinkage Estimation
Bayesian Hierarchical Models
Examples
Concluding Remarks<br>
04
Drug Trials Snapshots www.fda.gov<br>
05
FDASIA 2012 Section 907 SEC. 907. REPORTING OF INCLUSION OF DEMOGRAPHIC SUBGROUPS IN CLINICAL TRIALS AND DATA ANALYSIS IN APPLICATIONS FOR DRUGS, BIOLOGICS, AND DEVICES.
(1) IN GENERAL.—Not later than 1 year after the date of enactment of this Act, the Secretary, acting through the Commissioner, shall publish on the Internet web site of the Food and Drug Administration a report, consistent with the regulations of the Food and Drug Administration pertaining to the protection of sponsors’ confidential commercial information as of the date of enactment of this Act, addressing the extent to which clinical trial participation and the inclusion of safety and effectiveness data by demographic subgroups including sex, age, race, and ethnicity, is included in applications submitted to the Food and Drug Administration, and shall provide such publication to Congress www.fda.gov<br>
(1) IN GENERAL.—Not later than 1 year after the date of enactment of this Act, the Secretary, acting through the Commissioner, shall publish on the Internet web site of the Food and Drug Administration a report, consistent with the regulations of the Food and Drug Administration pertaining to the protection of sponsors’ confidential commercial information as of the date of enactment of this Act, addressing the extent to which clinical trial participation and the inclusion of safety and effectiveness data by demographic subgroups including sex, age, race, and ethnicity, is included in applications submitted to the Food and Drug Administration, and shall provide such publication to Congress www.fda.gov<br>
06
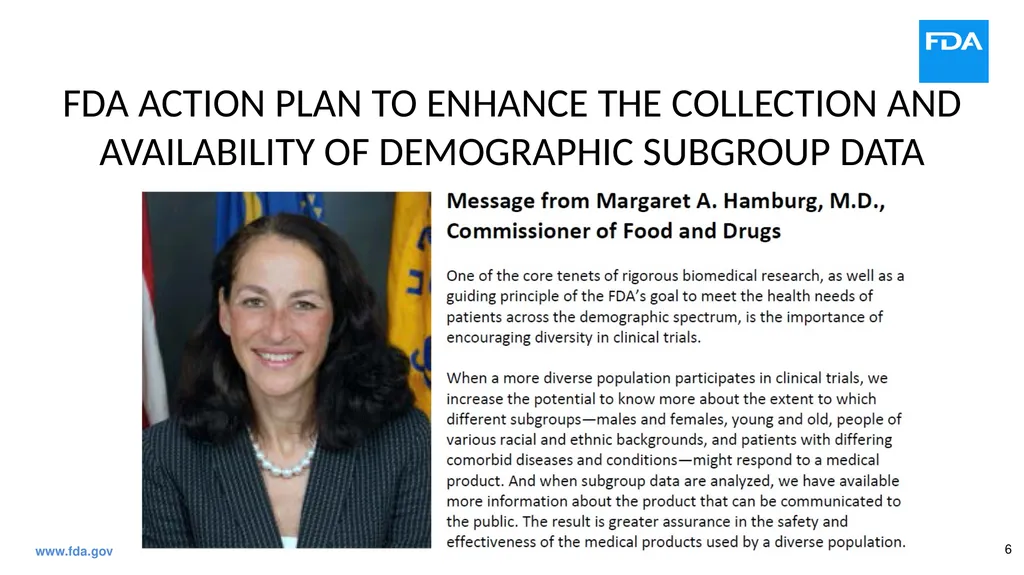
FDA ACTION PLAN TO ENHANCE THE COLLECTION AND AVAILABILITY OF DEMOGRAPHIC SUBGROUP DATA www.fda.gov<br>
07
Message from Margaret A. Hamburg, M.D., Commissioner of Food and Drugs (continue) … Advances in science are also playing an increasingly important role in deepening our understanding of how patients within various subgroups respond to medical products. … an action plan outlining “recommendations for improving the completeness and quality of analyses of data on demographic subgroups in summaries of product safety and effectiveness data … .”<br>
08
Purpose of DTS Provide consumers and healthcare professionals with information about who participated in clinical trials that supported the FDA approval of new drugs (NMEs and original biologics).
Provide information on study design.
Highlight potential differences in efficacy and safety results among gender, race, and age subgroups.
Increase transparency. www.fda.gov<br>
Provide information on study design.
Highlight potential differences in efficacy and safety results among gender, race, and age subgroups.
Increase transparency. www.fda.gov<br>
09
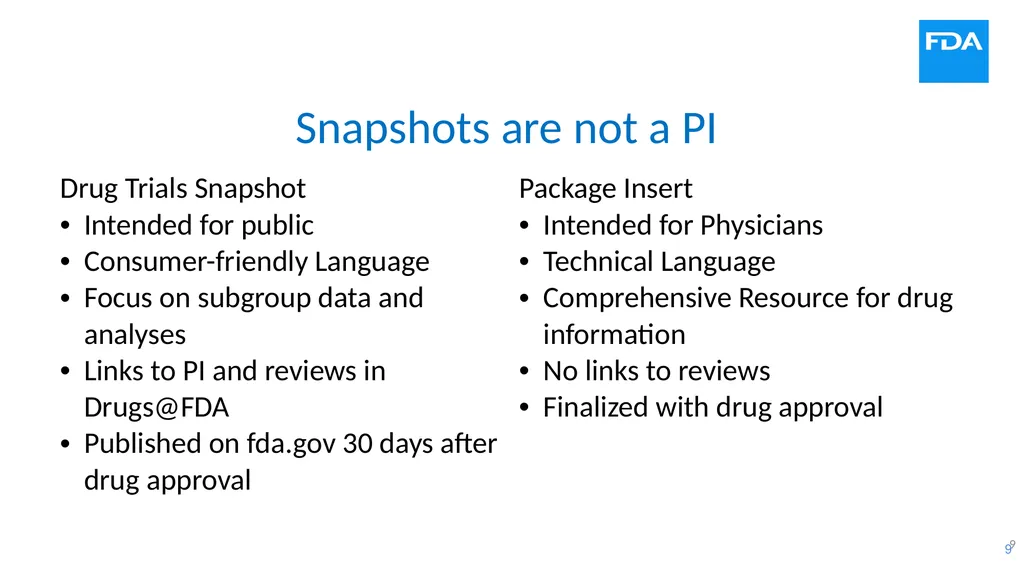
Snapshots are not a PI 9<br>
10
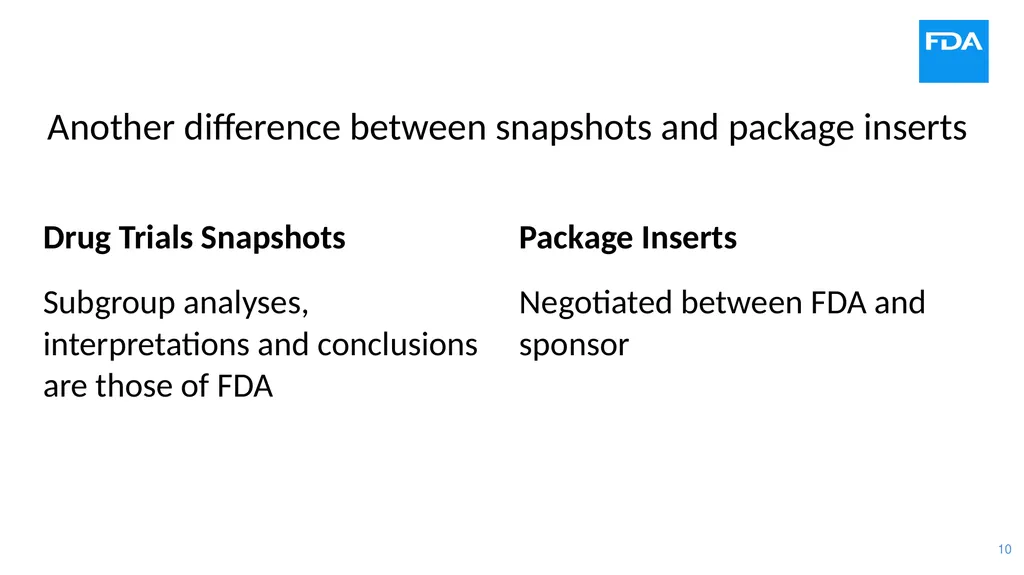
Another difference between snapshots and package inserts<br>
11
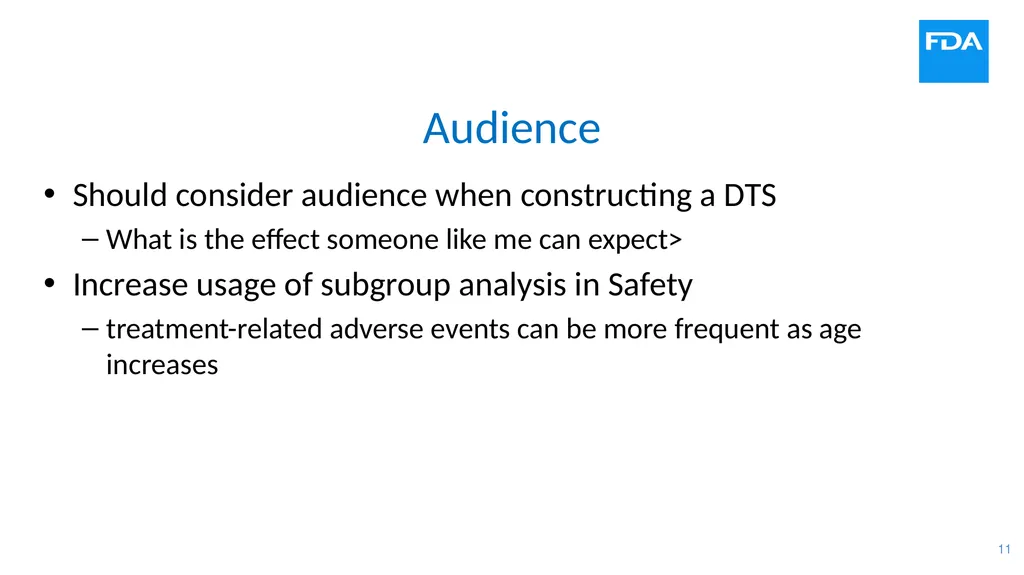
Audience Should consider audience when constructing a DTS
What is the effect someone like me can expect>
Increase usage of subgroup analysis in Safety
treatment-related adverse events can be more frequent as age increases<br>
What is the effect someone like me can expect>
Increase usage of subgroup analysis in Safety
treatment-related adverse events can be more frequent as age increases<br>
12
Heterogeneous Treatment Effects (HTE) www.fda.gov<br>
13
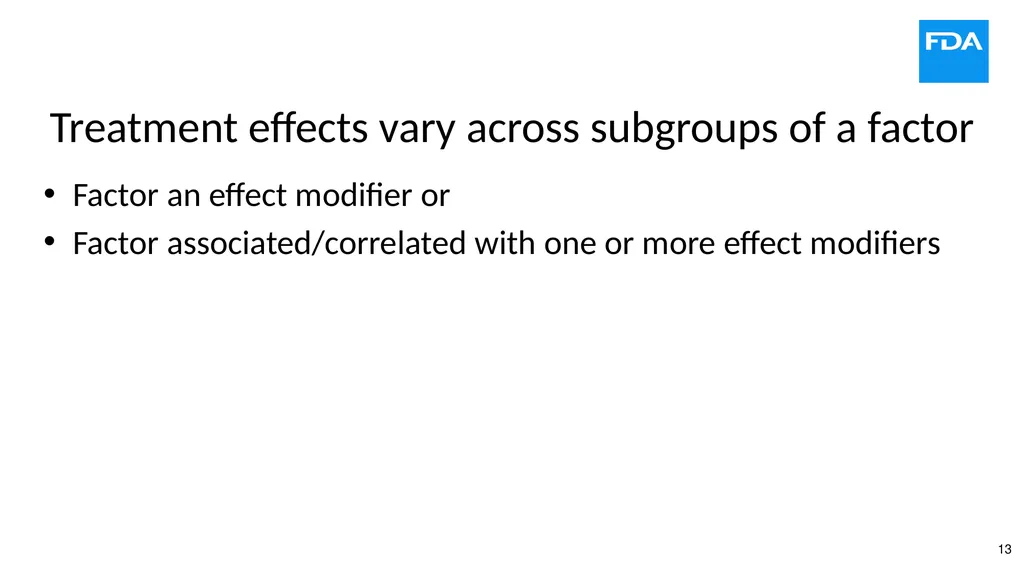
Treatment effects vary across subgroups of a factor Factor an effect modifier or
Factor associated/correlated with one or more effect modifiers<br>
Factor associated/correlated with one or more effect modifiers<br>
14
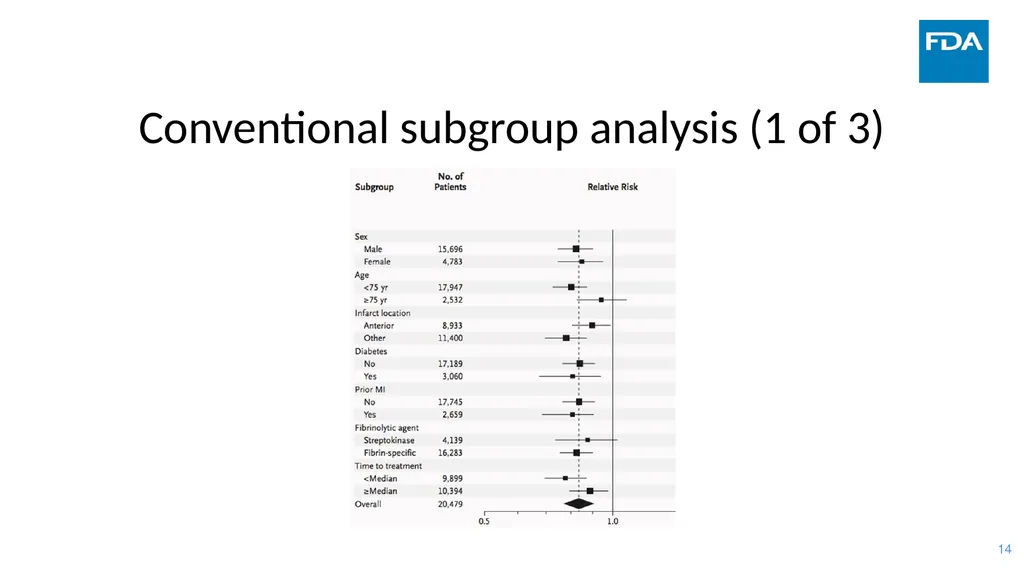
Conventional subgroup analysis (1 of 3)<br>
15
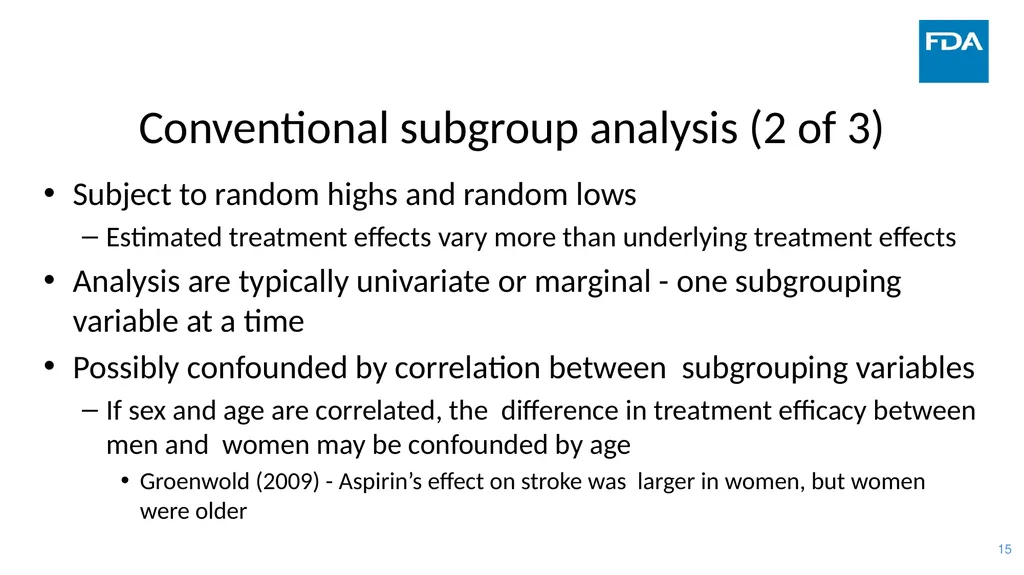
Conventional subgroup analysis (2 of 3) Subject to random highs and random lows
Estimated treatment effects vary more than underlying treatment effects
Analysis are typically univariate or marginal - one subgrouping variable at a time
Possibly confounded by correlation between subgrouping variables
If sex and age are correlated, the difference in treatment efficacy between men and women may be confounded by age
Groenwold (2009) - Aspirin’s effect on stroke was larger in women, but women were older<br>
Estimated treatment effects vary more than underlying treatment effects
Analysis are typically univariate or marginal - one subgrouping variable at a time
Possibly confounded by correlation between subgrouping variables
If sex and age are correlated, the difference in treatment efficacy between men and women may be confounded by age
Groenwold (2009) - Aspirin’s effect on stroke was larger in women, but women were older<br>
16
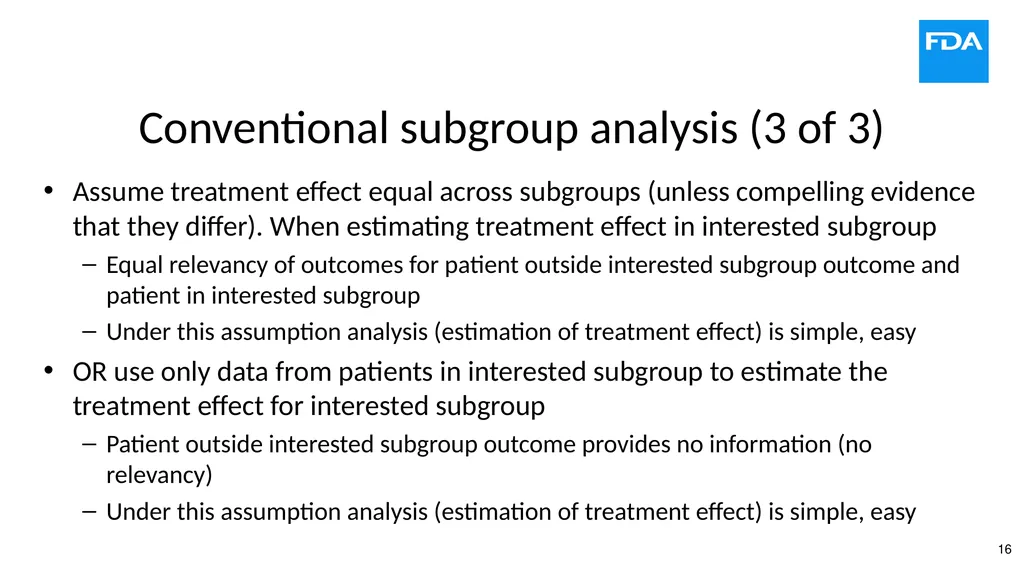
Conventional subgroup analysis (3 of 3) Assume treatment effect equal across subgroups (unless compelling evidence that they differ). When estimating treatment effect in interested subgroup
Equal relevancy of outcomes for patient outside interested subgroup outcome and patient in interested subgroup
Under this assumption analysis (estimation of treatment effect) is simple, easy
OR use only data from patients in interested subgroup to estimate the treatment effect for interested subgroup
Patient outside interested subgroup outcome provides no information (no relevancy)
Under this assumption analysis (estimation of treatment effect) is simple, easy<br>
Equal relevancy of outcomes for patient outside interested subgroup outcome and patient in interested subgroup
Under this assumption analysis (estimation of treatment effect) is simple, easy
OR use only data from patients in interested subgroup to estimate the treatment effect for interested subgroup
Patient outside interested subgroup outcome provides no information (no relevancy)
Under this assumption analysis (estimation of treatment effect) is simple, easy<br>
17
Recent Symposiums and Workshops co-sponsored by FDA on Heterogeneous Treatment Effects Nov 28, 2018, Symposium of Assessing and Communicating Heterogeneity of Treatment Effects for Patient Subpopulations: Challenges and Opportunities
Agenda, Slides and Recording at https://www.jhsph.edu/research/centers-and-institutes/center-of-excellence-in-regulatory-science-and-innovation/news-and-events/Critical-Issues-in-Heterogeneity-of-Treatment-Effect.html
Nov 30 - Dec 1, 2020, Workshop on Heterogeneity of Treatment Effects in Clinical Trials: Methods and Innovations
Agenda and Recording at https://mrctcenter.org/news-events/heterogeneity-of-treatment-effects-in-clinical-trials-methods-and-innovations/#1602863324215-1289c9d5-a82a<br>
Agenda, Slides and Recording at https://www.jhsph.edu/research/centers-and-institutes/center-of-excellence-in-regulatory-science-and-innovation/news-and-events/Critical-Issues-in-Heterogeneity-of-Treatment-Effect.html
Nov 30 - Dec 1, 2020, Workshop on Heterogeneity of Treatment Effects in Clinical Trials: Methods and Innovations
Agenda and Recording at https://mrctcenter.org/news-events/heterogeneity-of-treatment-effects-in-clinical-trials-methods-and-innovations/#1602863324215-1289c9d5-a82a<br>
18
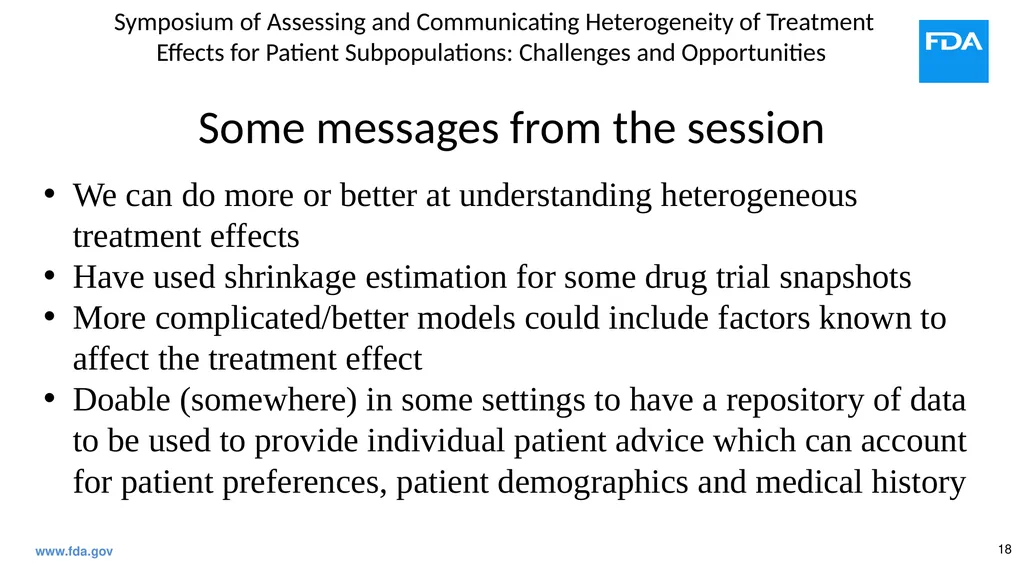
Some messages from the session We can do more or better at understanding heterogeneous treatment effects
Have used shrinkage estimation for some drug trial snapshots
More complicated/better models could include factors known to affect the treatment effect
Doable (somewhere) in some settings to have a repository of data to be used to provide individual patient advice which can account for patient preferences, patient demographics and medical history www.fda.gov Symposium of Assessing and Communicating Heterogeneity of Treatment Effects for Patient Subpopulations: Challenges and Opportunities<br>
Have used shrinkage estimation for some drug trial snapshots
More complicated/better models could include factors known to affect the treatment effect
Doable (somewhere) in some settings to have a repository of data to be used to provide individual patient advice which can account for patient preferences, patient demographics and medical history www.fda.gov Symposium of Assessing and Communicating Heterogeneity of Treatment Effects for Patient Subpopulations: Challenges and Opportunities<br>
19
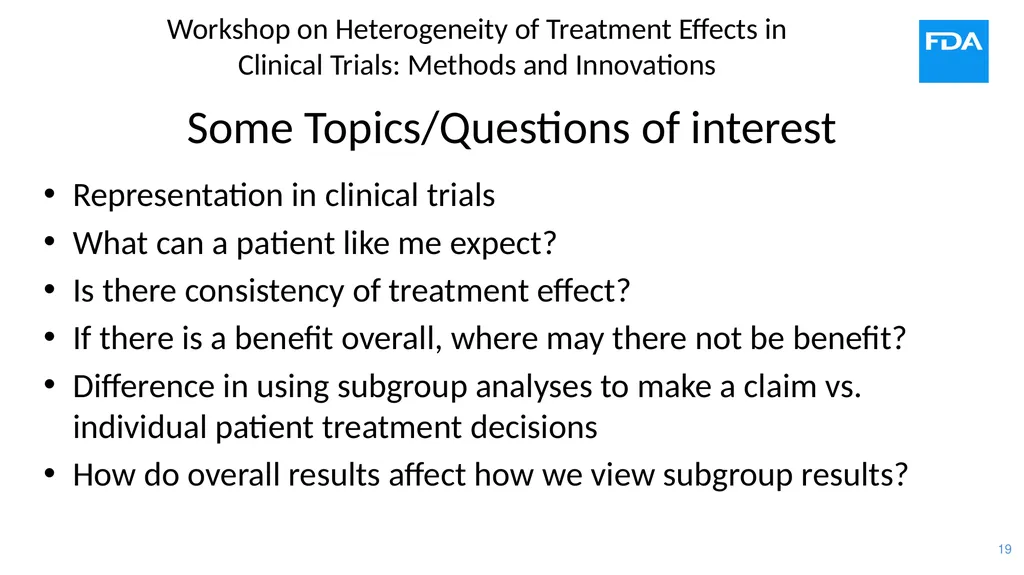
Some Topics/Questions of interest Representation in clinical trials
What can a patient like me expect?
Is there consistency of treatment effect?
If there is a benefit overall, where may there not be benefit?
Difference in using subgroup analyses to make a claim vs. individual patient treatment decisions
How do overall results affect how we view subgroup results? Workshop on Heterogeneity of Treatment Effects in Clinical Trials: Methods and Innovations<br>
What can a patient like me expect?
Is there consistency of treatment effect?
If there is a benefit overall, where may there not be benefit?
Difference in using subgroup analyses to make a claim vs. individual patient treatment decisions
How do overall results affect how we view subgroup results? Workshop on Heterogeneity of Treatment Effects in Clinical Trials: Methods and Innovations<br>
20
Different Perspectives/ Frameworks www.fda.gov<br>
21
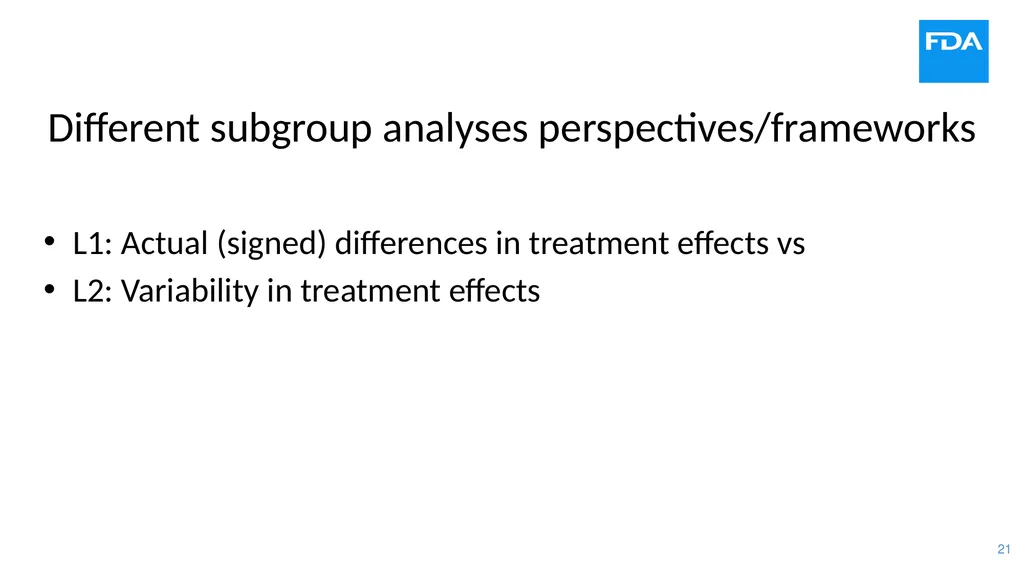
Different subgroup analyses perspectives/frameworks L1: Actual (signed) differences in treatment effects vs
L2: Variability in treatment effects<br>
L2: Variability in treatment effects<br>
22
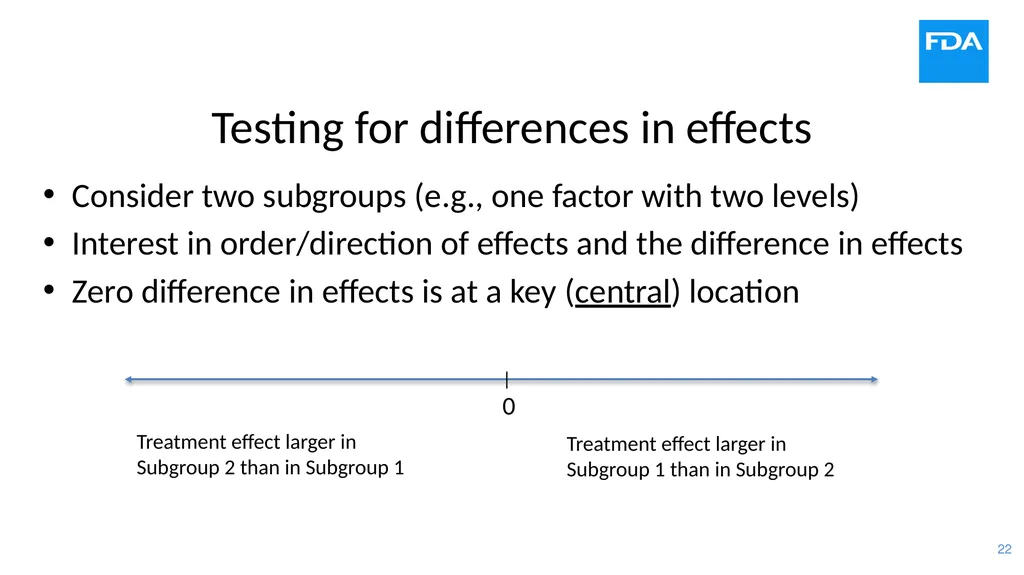
Testing for differences in effects Consider two subgroups (e.g., one factor with two levels)
Interest in order/direction of effects and the difference in effects
Zero difference in effects is at a key (central) location |
0 Treatment effect larger in
Subgroup 2 than in Subgroup 1 Treatment effect larger in
Subgroup 1 than in Subgroup 2<br>
Interest in order/direction of effects and the difference in effects
Zero difference in effects is at a key (central) location |
0 Treatment effect larger in
Subgroup 2 than in Subgroup 1 Treatment effect larger in
Subgroup 1 than in Subgroup 2<br>
23
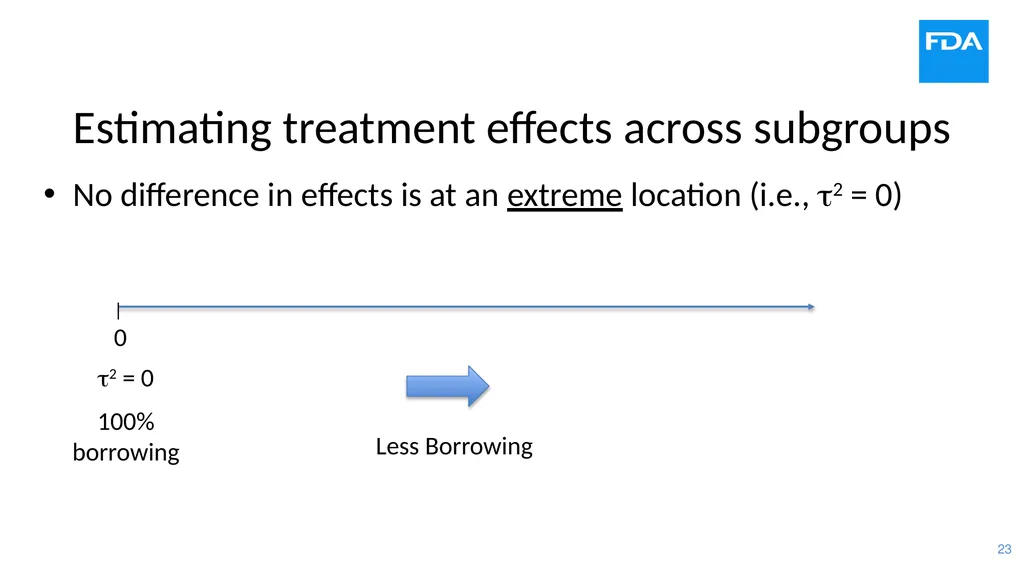
Estimating treatment effects across subgroups No difference in effects is at an extreme location (i.e., 2 = 0) |
0 2 = 0
100% borrowing Less Borrowing<br>
0 2 = 0
100% borrowing Less Borrowing<br>
24
Story www.fda.gov<br>
25
Introductory Paragraph from the Impact Story When evaluating drug treatments, determining how and to what extent a drug works in different patient subgroups can be addressed by statistical approaches that make use of results from every subgroup when understanding the treatment effect for a given subgroup.
using-innovative-statistical-approaches-provide-most-reliable-treatment-outcomes<br>
using-innovative-statistical-approaches-provide-most-reliable-treatment-outcomes<br>
26
Treatment Decisions Physicians make treatment decisions on past experience with patients<br>
27
New Drug Sex may or may not be an effect modifier
No other factor is considered as a possible effect modifier
Physician has experience on the use of the new drug and outcomes in 2 males and 2 females
The next patient, a female, is prescribed the new drug from that physician. What can she expect?
Probably use information from all four previous patients.
Outcomes from females may be more relevant than the outcomes from males.<br>
No other factor is considered as a possible effect modifier
Physician has experience on the use of the new drug and outcomes in 2 males and 2 females
The next patient, a female, is prescribed the new drug from that physician. What can she expect?
Probably use information from all four previous patients.
Outcomes from females may be more relevant than the outcomes from males.<br>
28
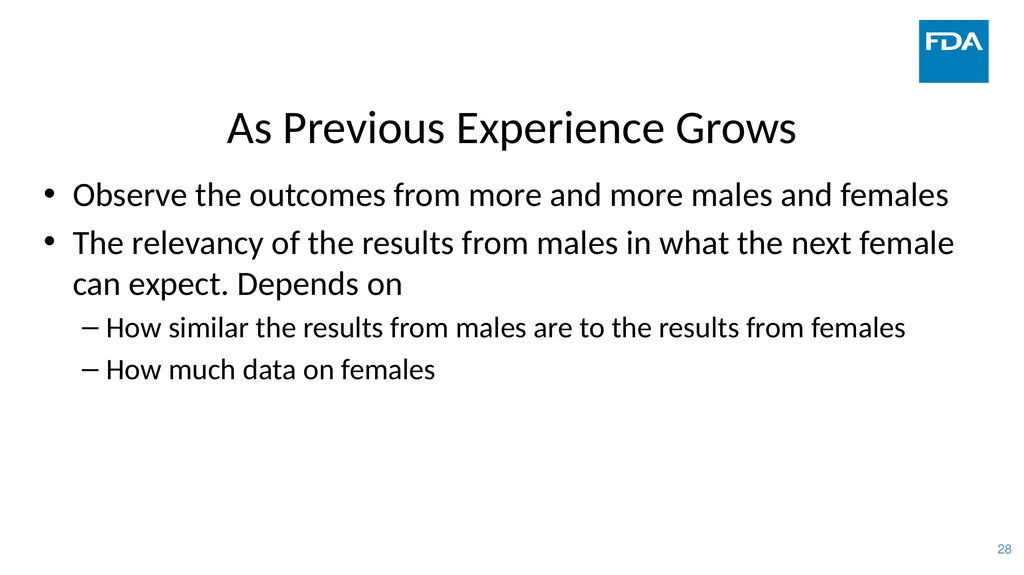
As Previous Experience Grows Observe the outcomes from more and more males and females
The relevancy of the results from males in what the next female can expect. Depends on
How similar the results from males are to the results from females
How much data on females<br>
The relevancy of the results from males in what the next female can expect. Depends on
How similar the results from males are to the results from females
How much data on females<br>
29
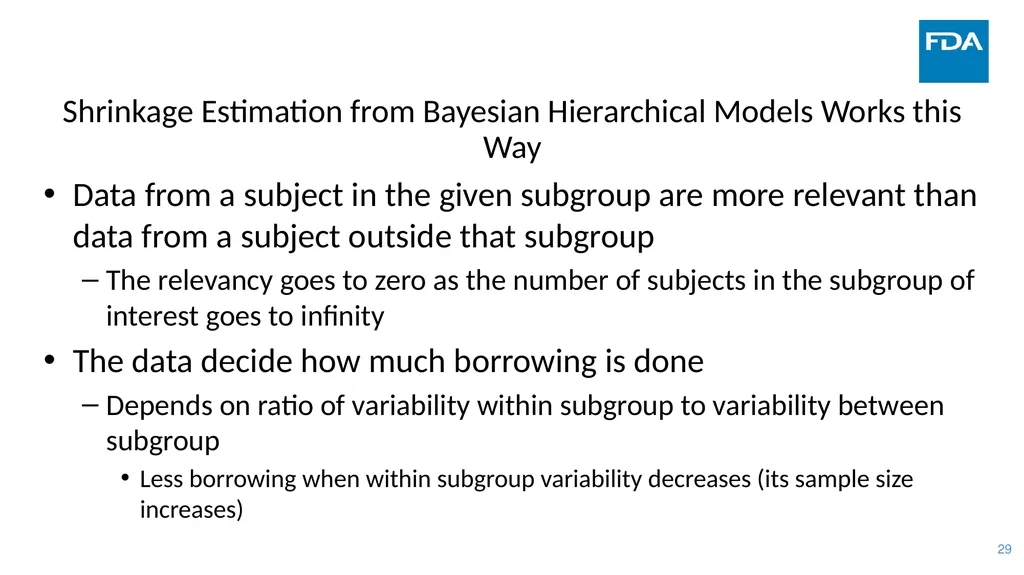
Shrinkage Estimation from Bayesian Hierarchical Models Works this Way Data from a subject in the given subgroup are more relevant than data from a subject outside that subgroup
The relevancy goes to zero as the number of subjects in the subgroup of interest goes to infinity
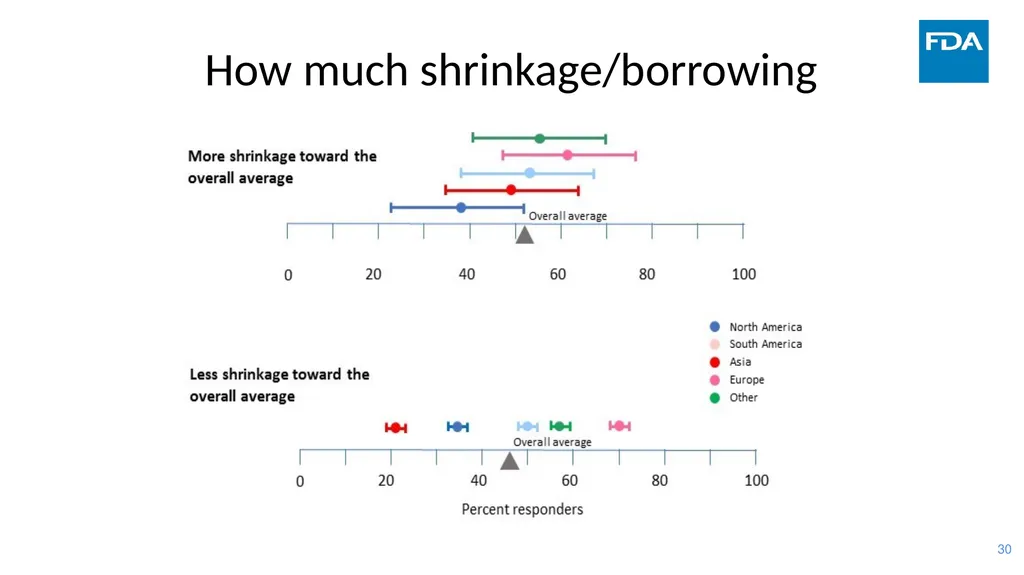
The data decide how much borrowing is done
Depends on ratio of variability within subgroup to variability between subgroup
Less borrowing when within subgroup variability decreases (its sample size increases)<br>
The relevancy goes to zero as the number of subjects in the subgroup of interest goes to infinity
The data decide how much borrowing is done
Depends on ratio of variability within subgroup to variability between subgroup
Less borrowing when within subgroup variability decreases (its sample size increases)<br>
30
How much shrinkage/borrowing<br>
31
Shrinkage Estimation www.fda.gov<br>
32
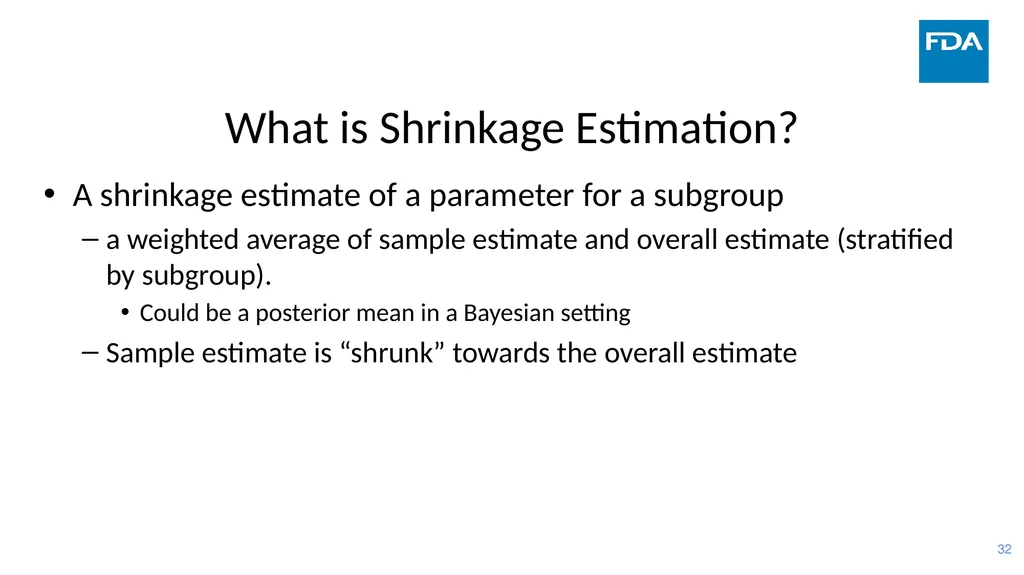
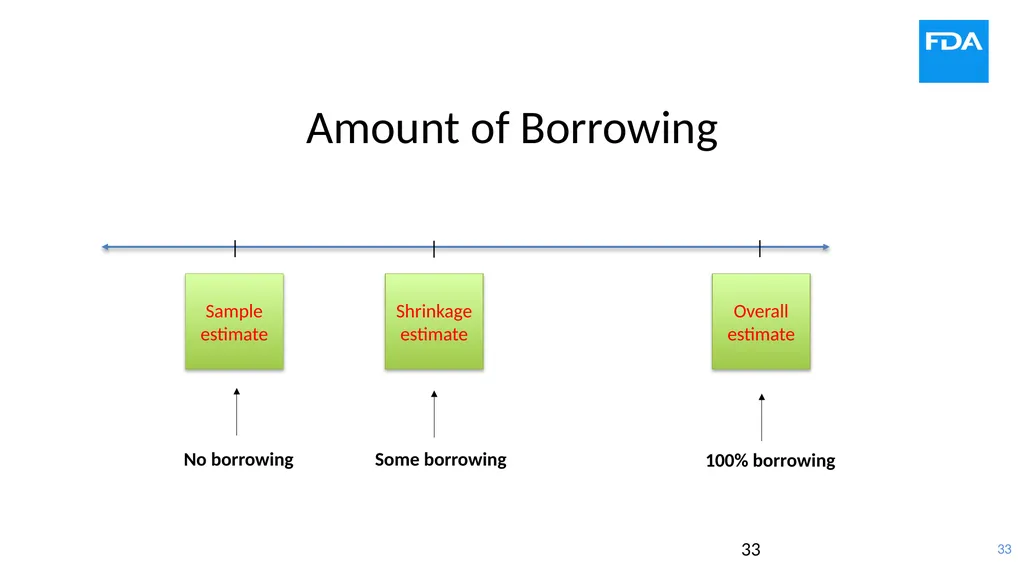
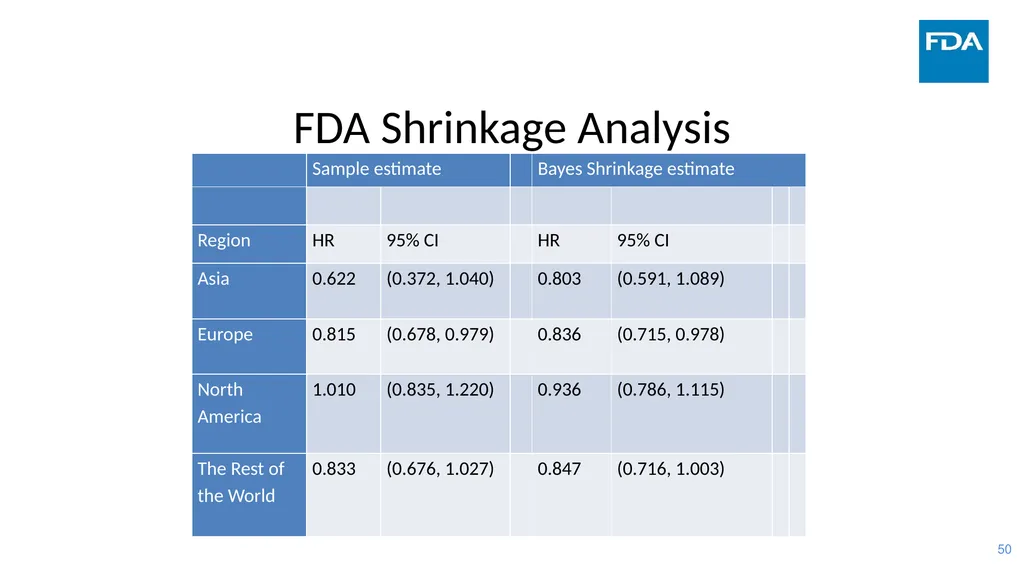
What is Shrinkage Estimation? A shrinkage estimate of a parameter for a subgroup
a weighted average of sample estimate and overall estimate (stratified by subgroup).
Could be a posterior mean in a Bayesian setting
Sample estimate is “shrunk” towards the overall estimate<br>
a weighted average of sample estimate and overall estimate (stratified by subgroup).
Could be a posterior mean in a Bayesian setting
Sample estimate is “shrunk” towards the overall estimate<br>
33
33 No borrowing Some borrowing 100% borrowing Sample estimate Shrinkage estimate Overall
estimate Amount of Borrowing | | |<br>
estimate Amount of Borrowing | | |<br>
34
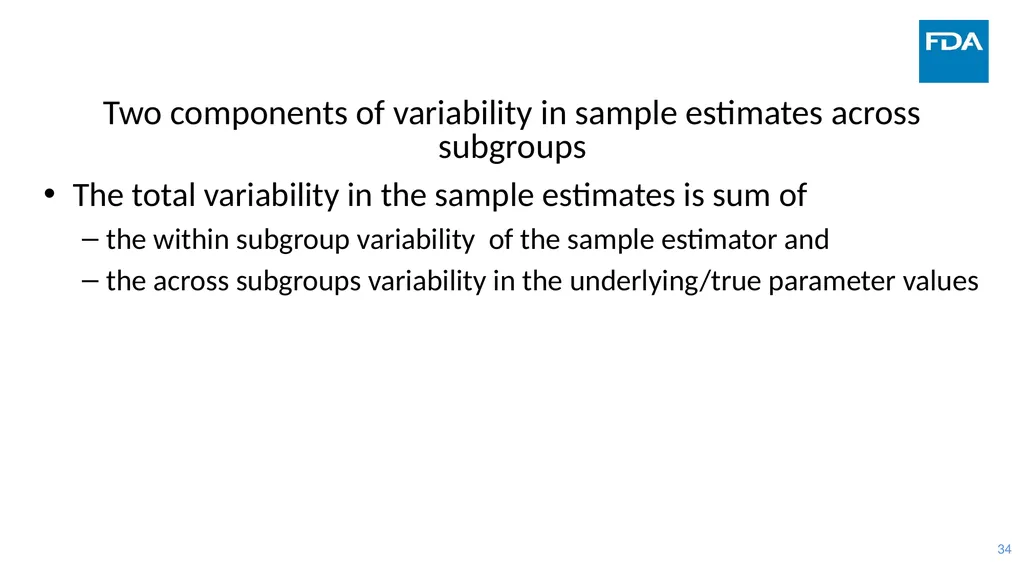
Two components of variability in sample estimates across subgroups The total variability in the sample estimates is sum of
the within subgroup variability of the sample estimator and
the across subgroups variability in the underlying/true parameter values<br>
the within subgroup variability of the sample estimator and
the across subgroups variability in the underlying/true parameter values<br>
35
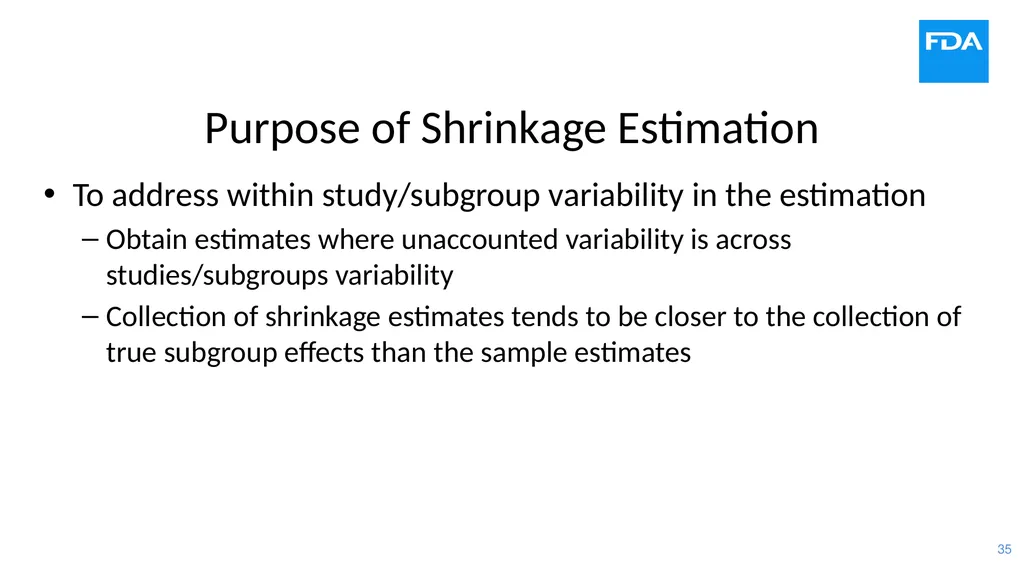
Purpose of Shrinkage Estimation To address within study/subgroup variability in the estimation
Obtain estimates where unaccounted variability is across studies/subgroups variability
Collection of shrinkage estimates tends to be closer to the collection of true subgroup effects than the sample estimates<br>
Obtain estimates where unaccounted variability is across studies/subgroups variability
Collection of shrinkage estimates tends to be closer to the collection of true subgroup effects than the sample estimates<br>
36
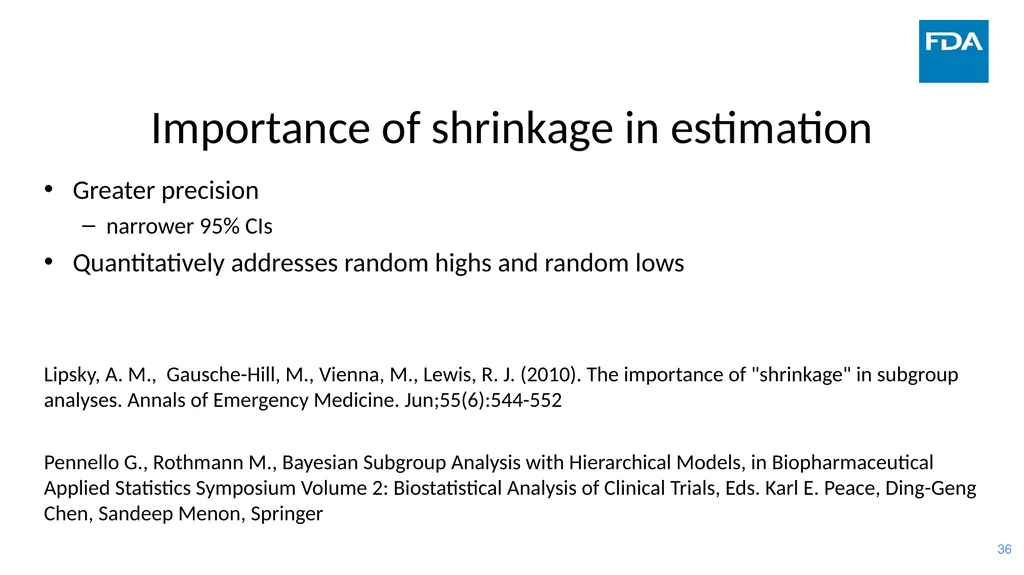
Importance of shrinkage in estimation Greater precision
narrower 95% CIs
Quantitatively addresses random highs and random lows
Lipsky, A. M., Gausche-Hill, M., Vienna, M., Lewis, R. J. (2010). The importance of "shrinkage" in subgroup analyses. Annals of Emergency Medicine. Jun;55(6):544-552
Pennello G., Rothmann M., Bayesian Subgroup Analysis with Hierarchical Models, in Biopharmaceutical Applied Statistics Symposium Volume 2: Biostatistical Analysis of Clinical Trials, Eds. Karl E. Peace, Ding-Geng Chen, Sandeep Menon, Springer<br>
narrower 95% CIs
Quantitatively addresses random highs and random lows
Lipsky, A. M., Gausche-Hill, M., Vienna, M., Lewis, R. J. (2010). The importance of "shrinkage" in subgroup analyses. Annals of Emergency Medicine. Jun;55(6):544-552
Pennello G., Rothmann M., Bayesian Subgroup Analysis with Hierarchical Models, in Biopharmaceutical Applied Statistics Symposium Volume 2: Biostatistical Analysis of Clinical Trials, Eds. Karl E. Peace, Ding-Geng Chen, Sandeep Menon, Springer<br>
37
Model for Shrinkage Estimation Do Shrinkage Estimation through Bayesian Hierarchical Models<br>
38
Bayesian Hierarchical Models www.fda.gov<br>
39
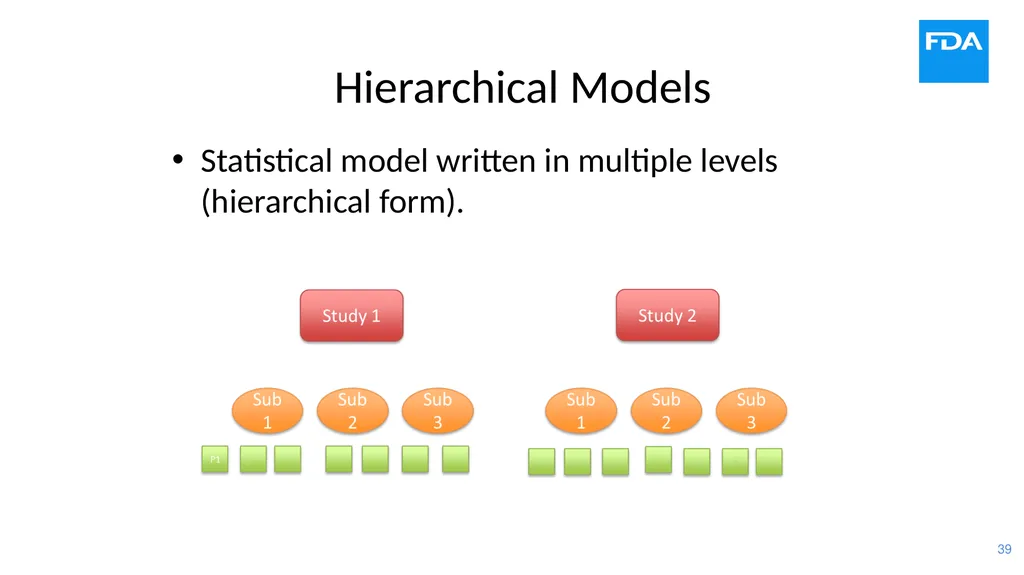
Hierarchical Models Statistical model written in multiple levels (hierarchical form).<br>
40
Linking Treatment effects (e.g., across studies, subgroups, products in the same class) are linked. This linking of the parameters makes their estimation linked.<br>
41
Exchangeability – a starting point Subgroups treatment effects are exchangeable if possible orderings of treatment effects are considered equally likely a priori (i.e., before seeing data)
This is fair, not favoring any subgroup treatment effects over any other
Joint prior distribution of subgroup treatment effects is exchangeable
Very unlikely that the joint posterior distribution will be exchangeable<br>
This is fair, not favoring any subgroup treatment effects over any other
Joint prior distribution of subgroup treatment effects is exchangeable
Very unlikely that the joint posterior distribution will be exchangeable<br>
42
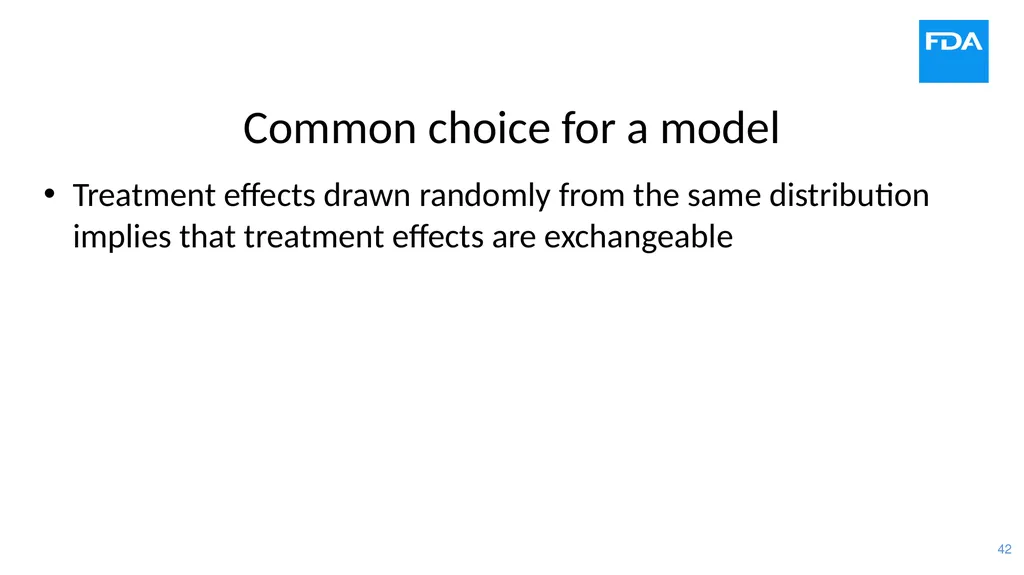
Common choice for a model Treatment effects drawn randomly from the same distribution implies that treatment effects are exchangeable<br>
43
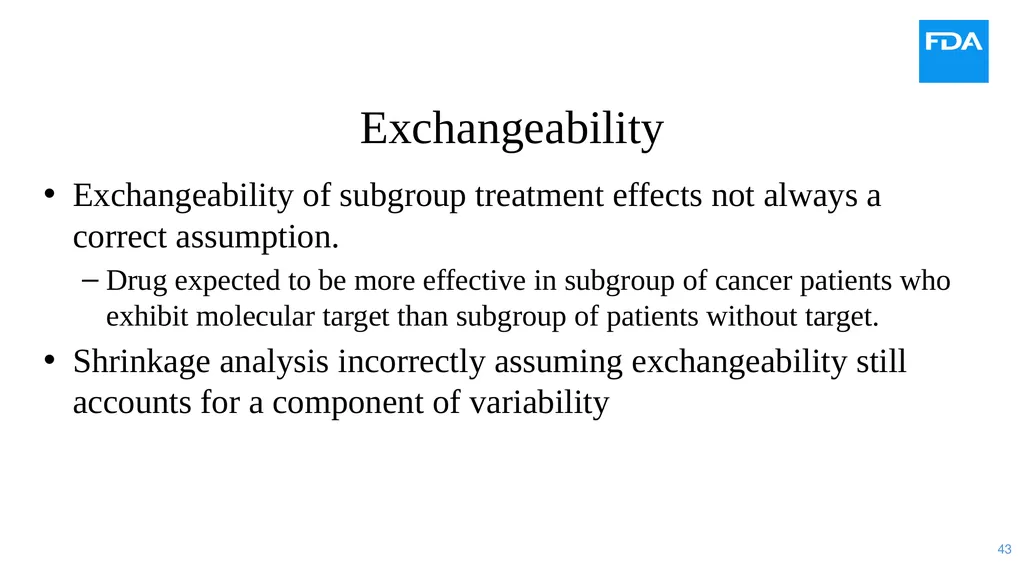
Exchangeability Exchangeability of subgroup treatment effects not always a correct assumption.
Drug expected to be more effective in subgroup of cancer patients who exhibit molecular target than subgroup of patients without target.
Shrinkage analysis incorrectly assuming exchangeability still accounts for a component of variability<br>
Drug expected to be more effective in subgroup of cancer patients who exhibit molecular target than subgroup of patients without target.
Shrinkage analysis incorrectly assuming exchangeability still accounts for a component of variability<br>
44
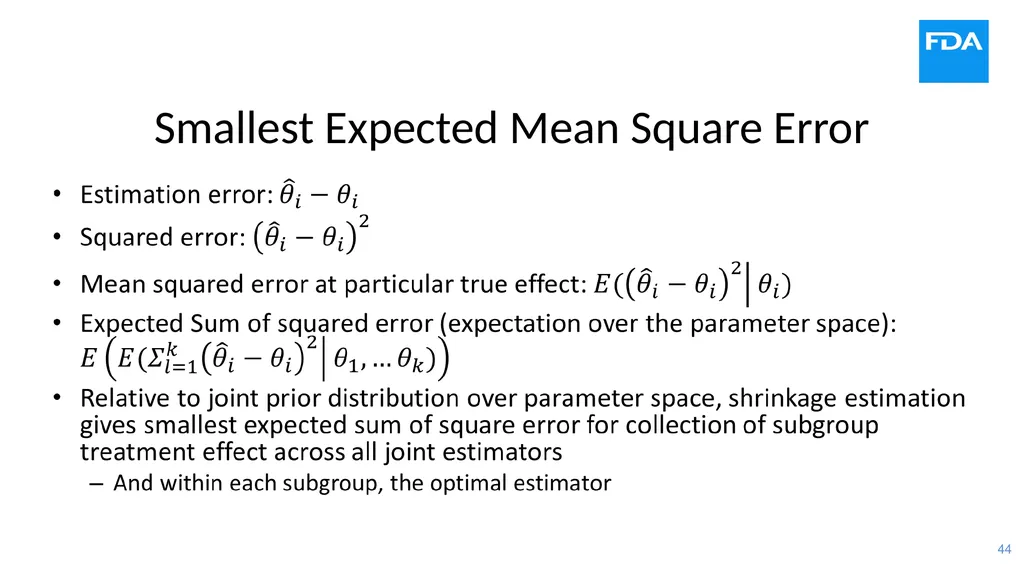
Smallest Expected Mean Square Error<br>
45
Example www.fda.gov<br>
46
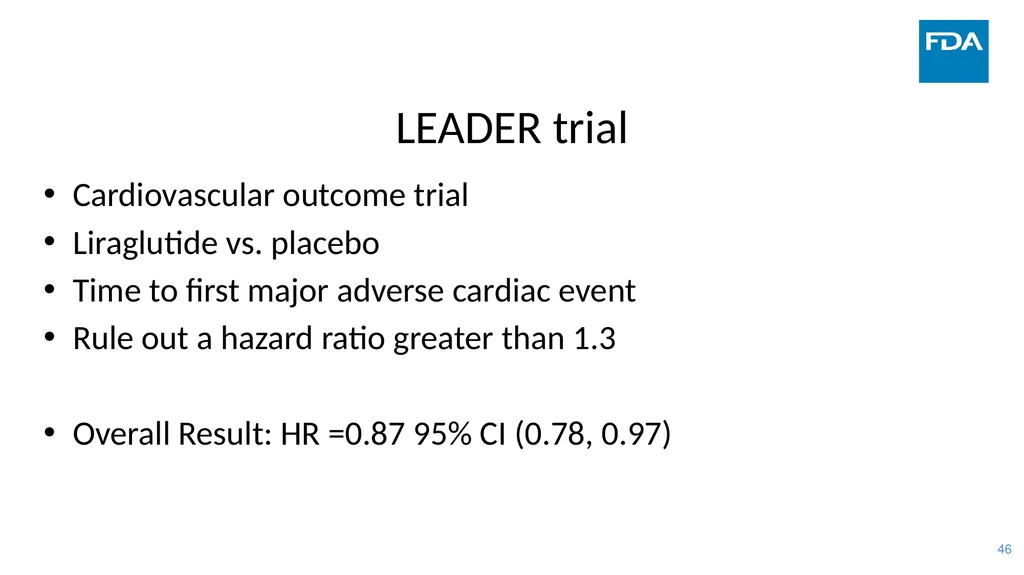
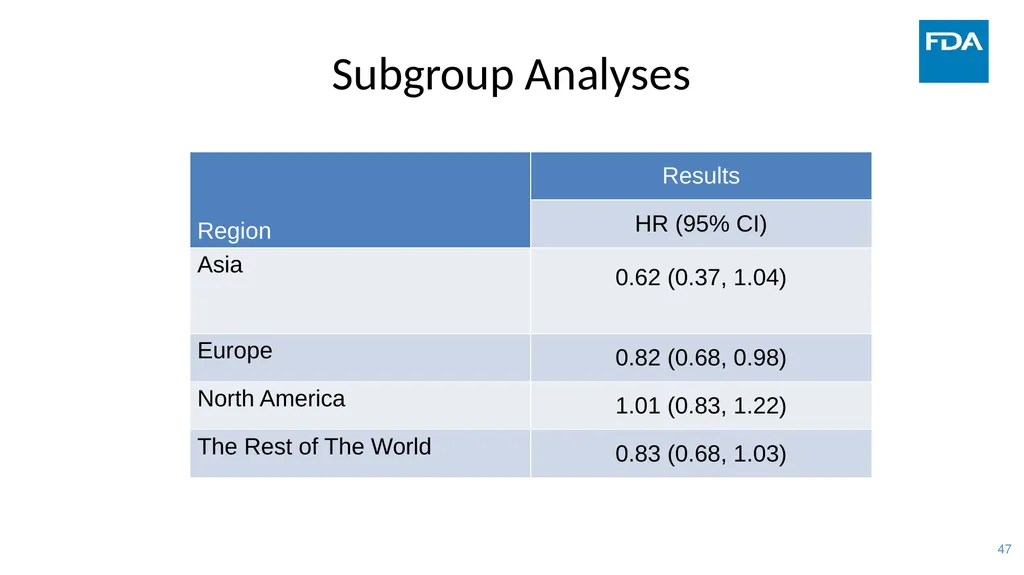
LEADER trial Cardiovascular outcome trial
Liraglutide vs. placebo
Time to first major adverse cardiac event
Rule out a hazard ratio greater than 1.3
Overall Result: HR =0.87 95% CI (0.78, 0.97)<br>
Liraglutide vs. placebo
Time to first major adverse cardiac event
Rule out a hazard ratio greater than 1.3
Overall Result: HR =0.87 95% CI (0.78, 0.97)<br>
47
Subgroup Analyses<br>
48
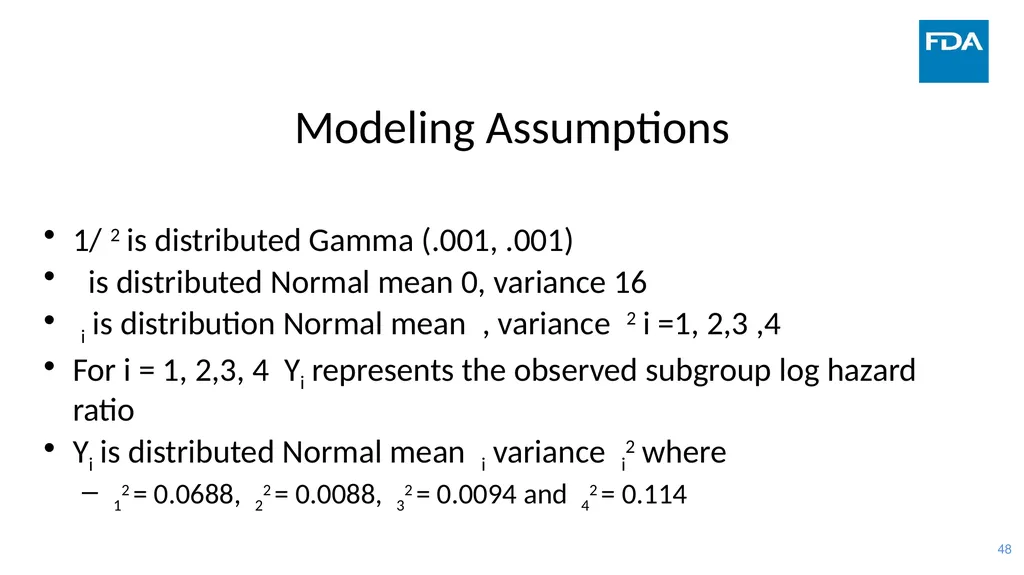
Modeling Assumptions 1/2 is distributed Gamma (.001, .001)
is distributed Normal mean 0, variance 16
i is distribution Normal mean , variance 2 i =1, 2,3 ,4
For i = 1, 2,3, 4 Yi represents the observed subgroup log hazard ratio
Yi is distributed Normal mean i variance i2 where
12 = 0.0688, 22 = 0.0088, 32 = 0.0094 and 42 = 0.114<br>
is distributed Normal mean 0, variance 16
i is distribution Normal mean , variance 2 i =1, 2,3 ,4
For i = 1, 2,3, 4 Yi represents the observed subgroup log hazard ratio
Yi is distributed Normal mean i variance i2 where
12 = 0.0688, 22 = 0.0088, 32 = 0.0094 and 42 = 0.114<br>
49
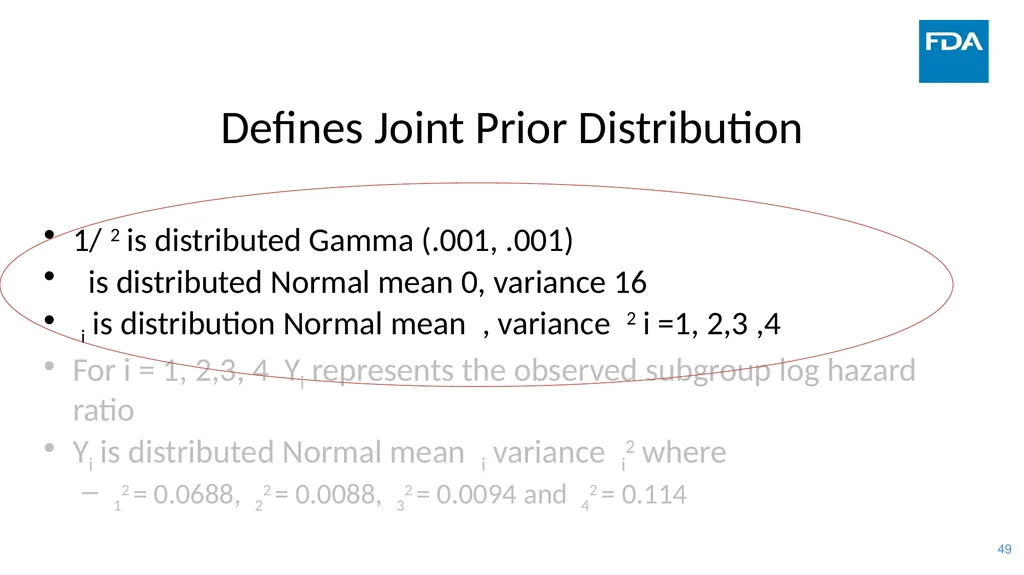
Defines Joint Prior Distribution 1/2 is distributed Gamma (.001, .001)
is distributed Normal mean 0, variance 16
i is distribution Normal mean , variance 2 i =1, 2,3 ,4
For i = 1, 2,3, 4 Yi represents the observed subgroup log hazard ratio
Yi is distributed Normal mean i variance i2 where
12 = 0.0688, 22 = 0.0088, 32 = 0.0094 and 42 = 0.114<br>
is distributed Normal mean 0, variance 16
i is distribution Normal mean , variance 2 i =1, 2,3 ,4
For i = 1, 2,3, 4 Yi represents the observed subgroup log hazard ratio
Yi is distributed Normal mean i variance i2 where
12 = 0.0688, 22 = 0.0088, 32 = 0.0094 and 42 = 0.114<br>
50
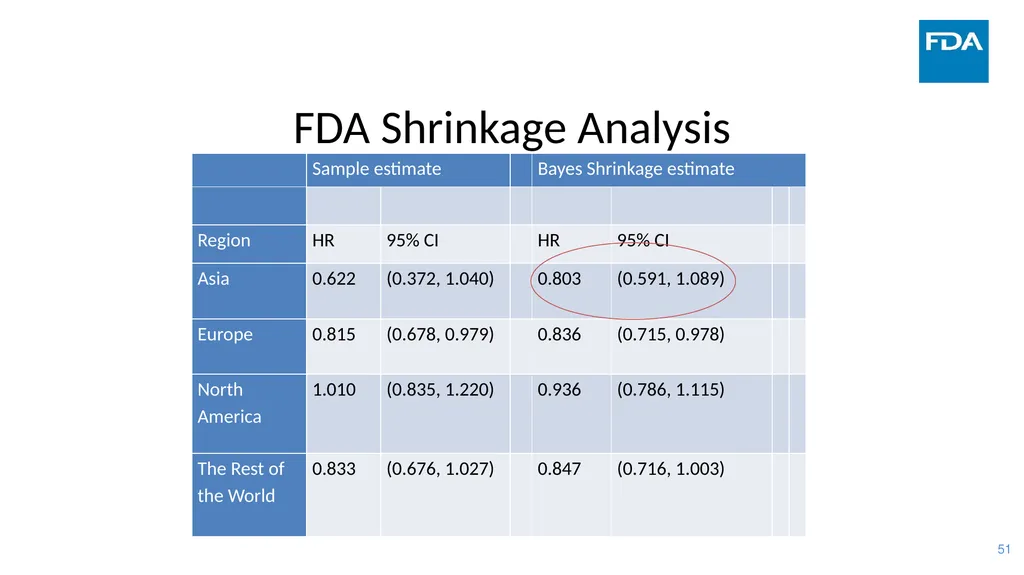
FDA Shrinkage Analysis<br>
51
FDA Shrinkage Analysis<br>
52
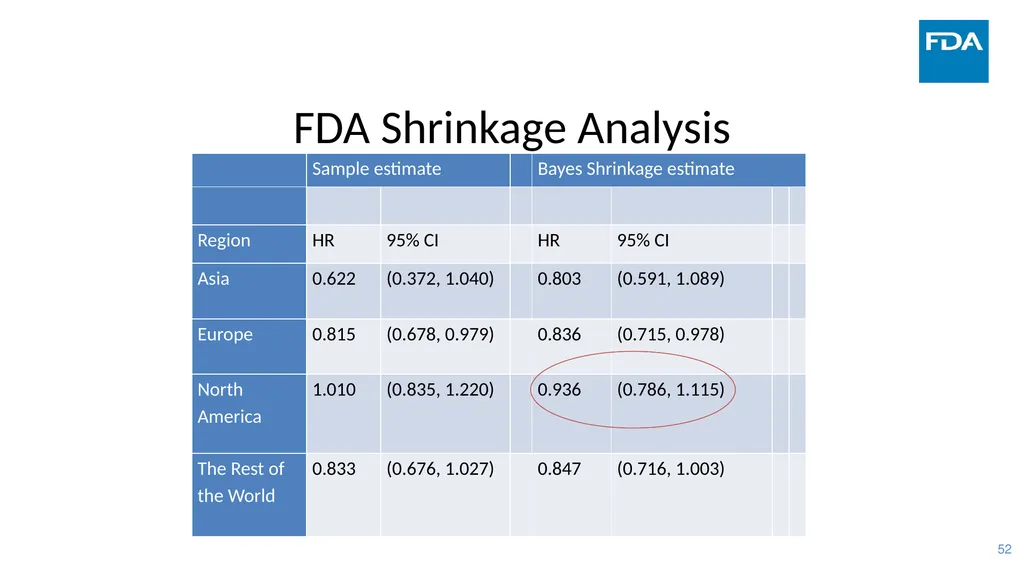
FDA Shrinkage Analysis<br>
53
Example - ACR20 response www.fda.gov<br>
54
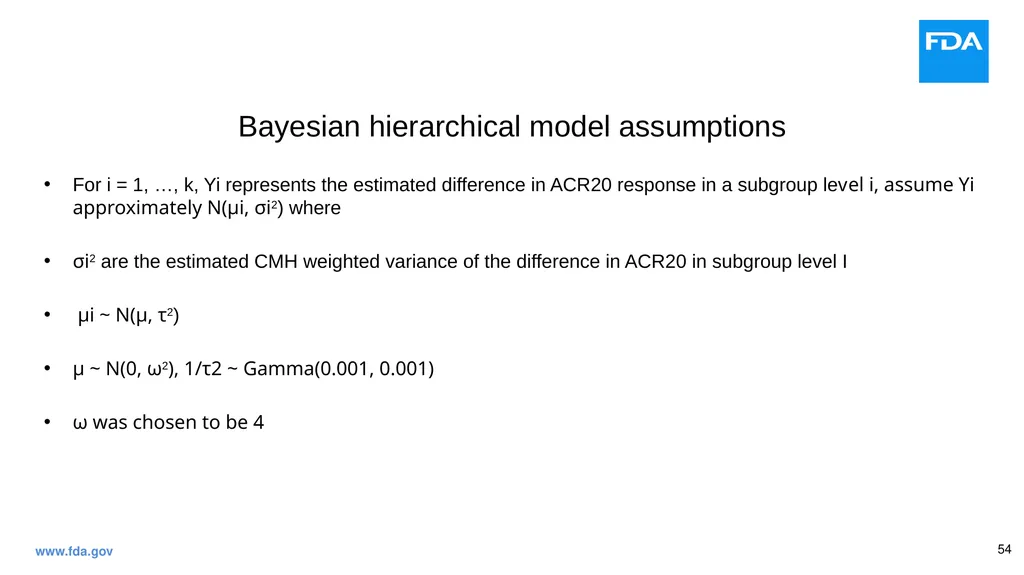
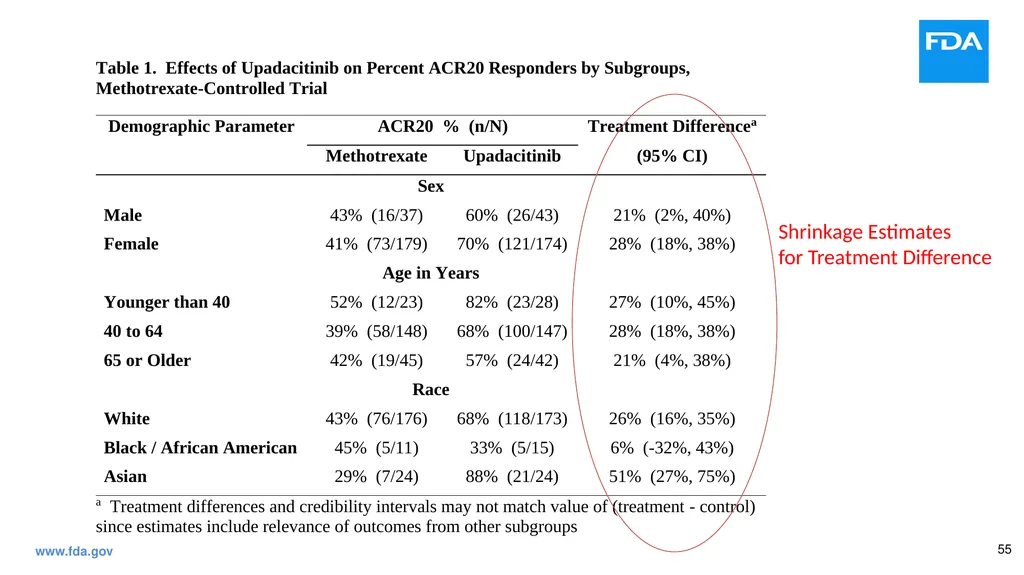
Bayesian hierarchical model assumptions For i = 1, …, k, Yi represents the estimated difference in ACR20 response in a subgroup level i, assume Yi approximately N(μi, σi2) where
σi2 are the estimated CMH weighted variance of the difference in ACR20 in subgroup level I
μi ~ N(μ, τ2)
μ ~ N(0, ω2), 1/τ2 ~ Gamma(0.001, 0.001)
ω was chosen to be 4 www.fda.gov<br>
σi2 are the estimated CMH weighted variance of the difference in ACR20 in subgroup level I
μi ~ N(μ, τ2)
μ ~ N(0, ω2), 1/τ2 ~ Gamma(0.001, 0.001)
ω was chosen to be 4 www.fda.gov<br>
55
www.fda.gov Shrinkage Estimates
for Treatment Difference<br>
for Treatment Difference<br>
56
Concluding Remarks www.fda.gov<br>
57
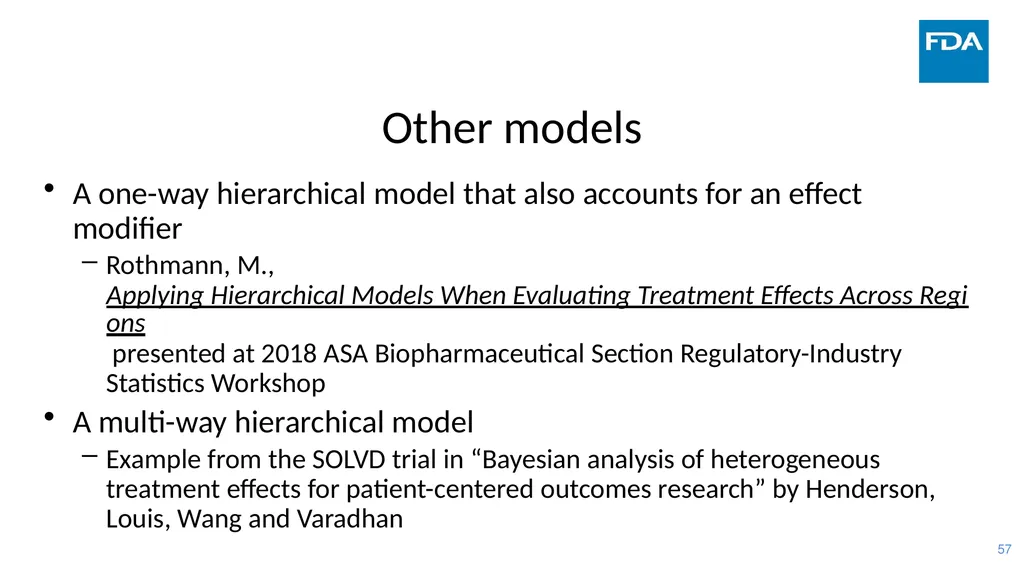
Other models A one-way hierarchical model that also accounts for an effect modifier
Rothmann, M., Applying Hierarchical Models When Evaluating Treatment Effects Across Regions presented at 2018 ASA Biopharmaceutical Section Regulatory-Industry Statistics Workshop
A multi-way hierarchical model
Example from the SOLVD trial in “Bayesian analysis of heterogeneous treatment effects for patient-centered outcomes research” by Henderson, Louis, Wang and Varadhan<br>
Rothmann, M., Applying Hierarchical Models When Evaluating Treatment Effects Across Regions presented at 2018 ASA Biopharmaceutical Section Regulatory-Industry Statistics Workshop
A multi-way hierarchical model
Example from the SOLVD trial in “Bayesian analysis of heterogeneous treatment effects for patient-centered outcomes research” by Henderson, Louis, Wang and Varadhan<br>
58
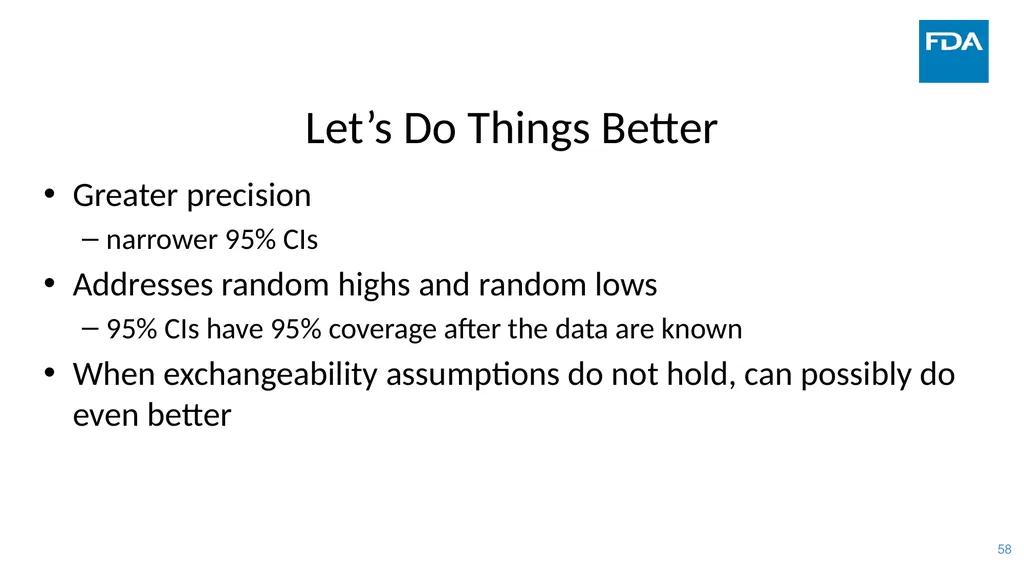
Let’s Do Things Better Greater precision
narrower 95% CIs
Addresses random highs and random lows
95% CIs have 95% coverage after the data are known
When exchangeability assumptions do not hold, can possibly do even better<br>
narrower 95% CIs
Addresses random highs and random lows
95% CIs have 95% coverage after the data are known
When exchangeability assumptions do not hold, can possibly do even better<br>
59
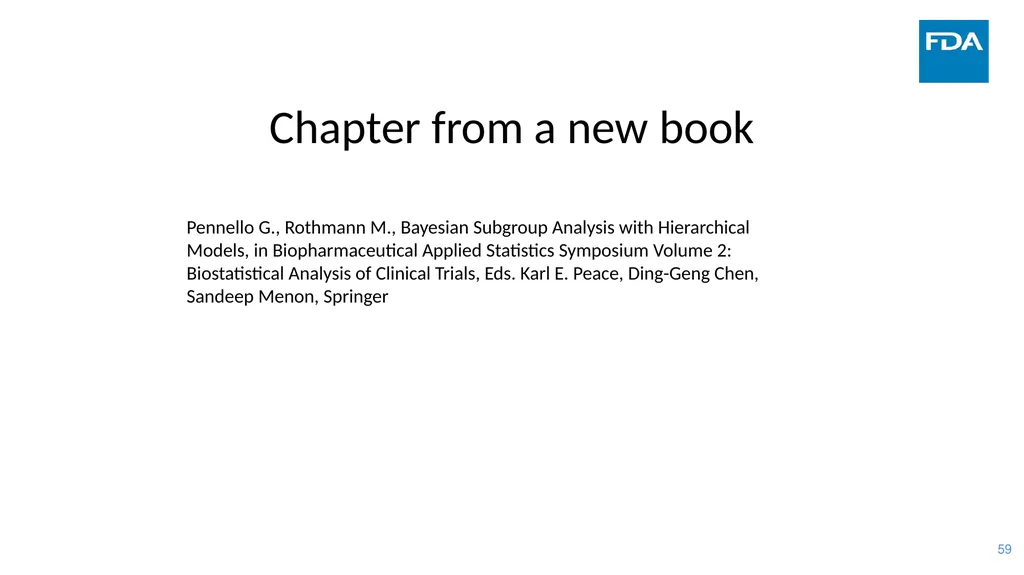
Chapter from a new book Pennello G., Rothmann M., Bayesian Subgroup Analysis with Hierarchical Models, in Biopharmaceutical Applied Statistics Symposium Volume 2: Biostatistical Analysis of Clinical Trials, Eds. Karl E. Peace, Ding-Geng Chen, Sandeep Menon, Springer<br>
60
Thank You!
Questions!<br>
Questions!<br>