Vietnamese agriculture and global integration David Vanzetti and Pham Lan Huong Australian National University and independent consultant National CGE Workshop Melbourne, 7th October 2013 Integration and structural adjustment Vietnam is
Related Topics
Share
Embed code
Download this presentation From Below
"Vietnamese agriculture and global integration" is the property of its rightful owner. Permission is granted to
download and print the materials on this website for personal, non-commercial use only, and to display it
on your personal computer provided you do not modify the materials and that you retain all copyright
notices contained in the materials. By downloading content from our website, you accept the terms of this
agreement.
Presentation Transcript
01
Vietnamese agriculture and global integration David Vanzetti and Pham Lan Huong
Australian National University and independent consultant National CGE Workshop
Melbourne, 7th October 2013<br>
02
Integration and structural adjustment Vietnam is signing up to bilateral, regional and multilateral trade agreements
Structural adjustment
the movement of factors of production (capital, labour and land) between sectors.
Declining sectors?
Unemployment of factors, particularly labour? 2<br>
03
Objectives Economic integration (four FTAs)
Assess macro and sectoral impacts
Identify need for structural adjustment 3<br>
04
Global general equilibrium model GTAP
Version 8, base 2007
Bilateral trade and tariffs (2010)
Includes preferential tariffs (needed for FTAs)
Whole economy
Includes resource (land, labour, capital, natural resources) constraints
Limitation - each country: one region, one household 4<br>
05
Scenarios Four FTAs
AFTA
China
Korea
Japan
All simultaneously
Each FTA without exemptions 5<br>
06
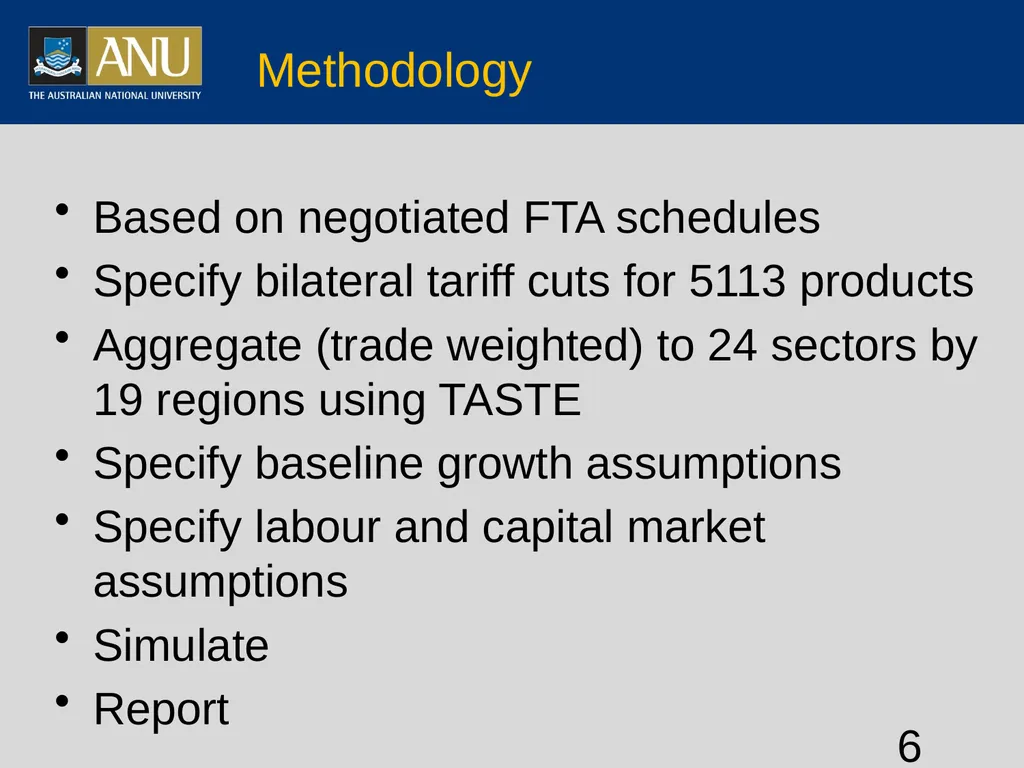
Methodology Based on negotiated FTA schedules
Specify bilateral tariff cuts for 5113 products
Aggregate (trade weighted) to 24 sectors by 19 regions using TASTE
Specify baseline growth assumptions
Specify labour and capital market assumptions
Simulate
Report 6<br>
07
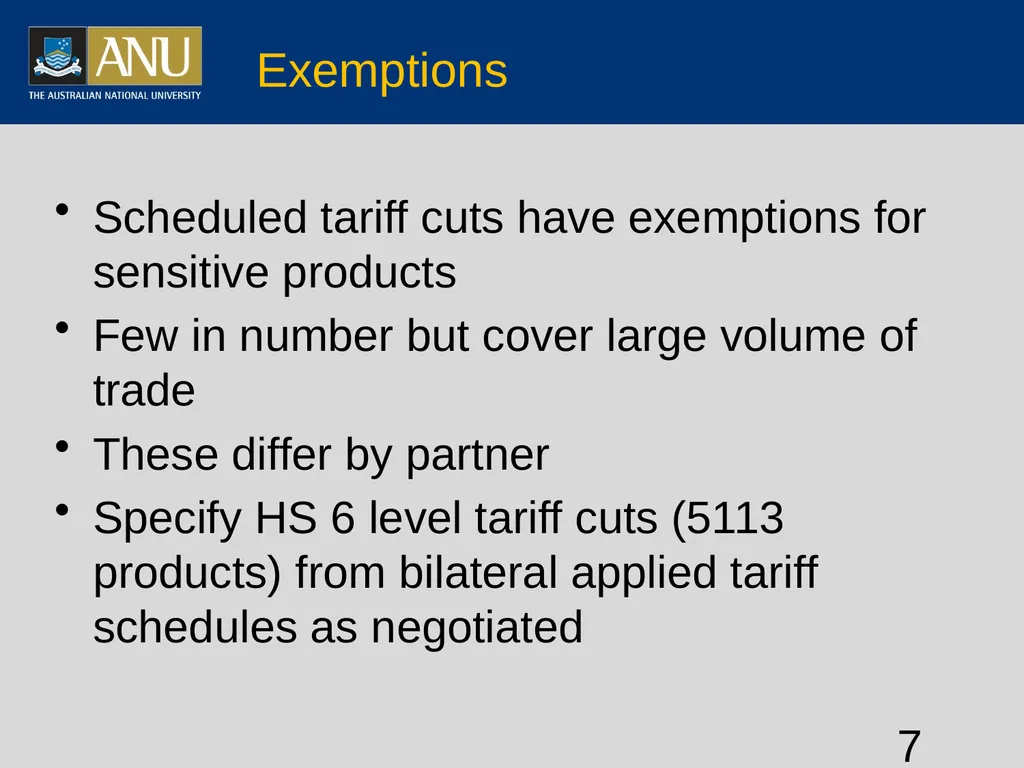
Exemptions Scheduled tariff cuts have exemptions for sensitive products
Few in number but cover large volume of trade
These differ by partner
Specify HS 6 level tariff cuts (5113 products) from bilateral applied tariff schedules as negotiated 7<br>
08
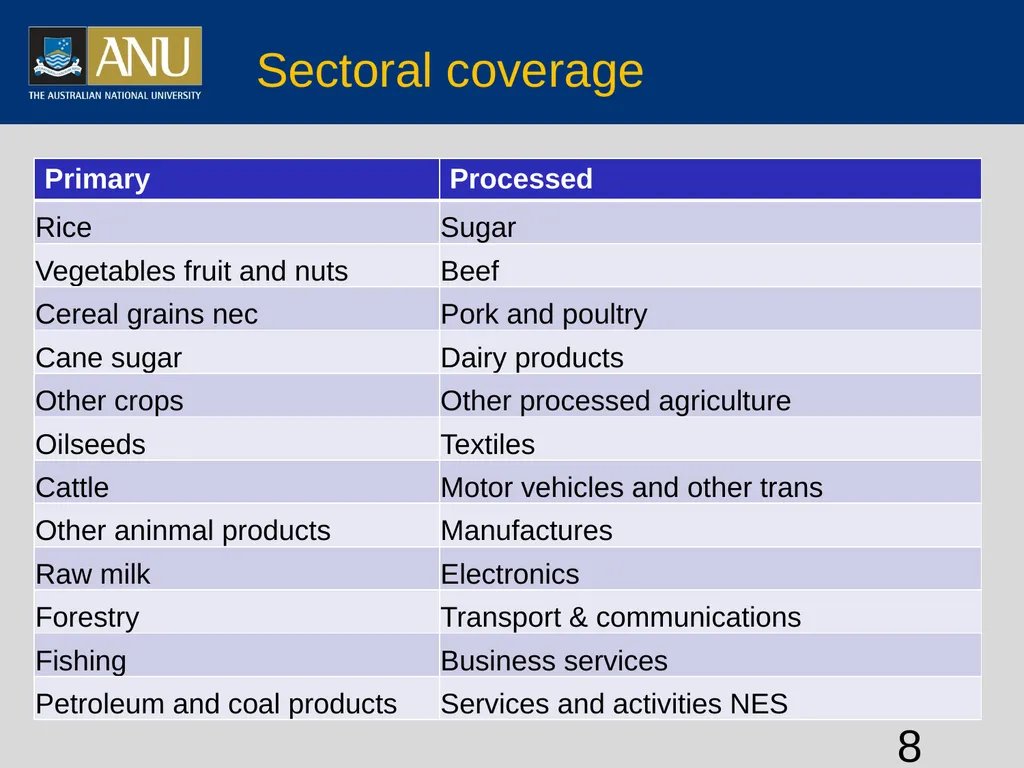
Sectoral coverage 8<br>
09
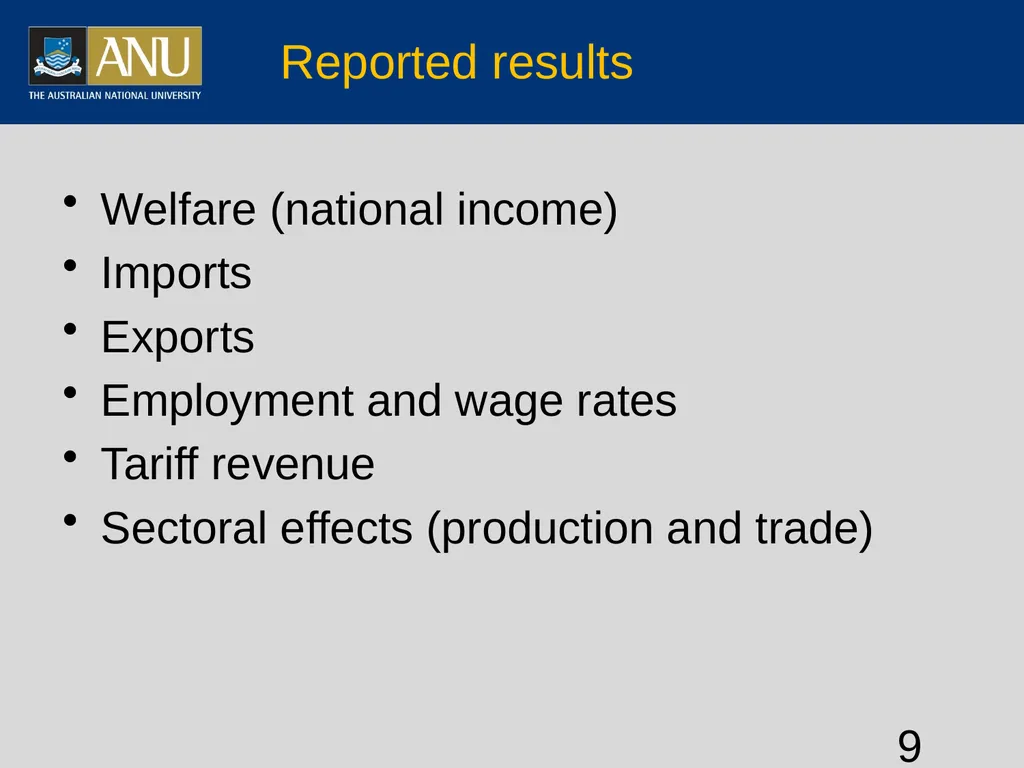
Reported results Welfare (national income)
Imports
Exports
Employment and wage rates
Tariff revenue
Sectoral effects (production and trade) 9<br>
10
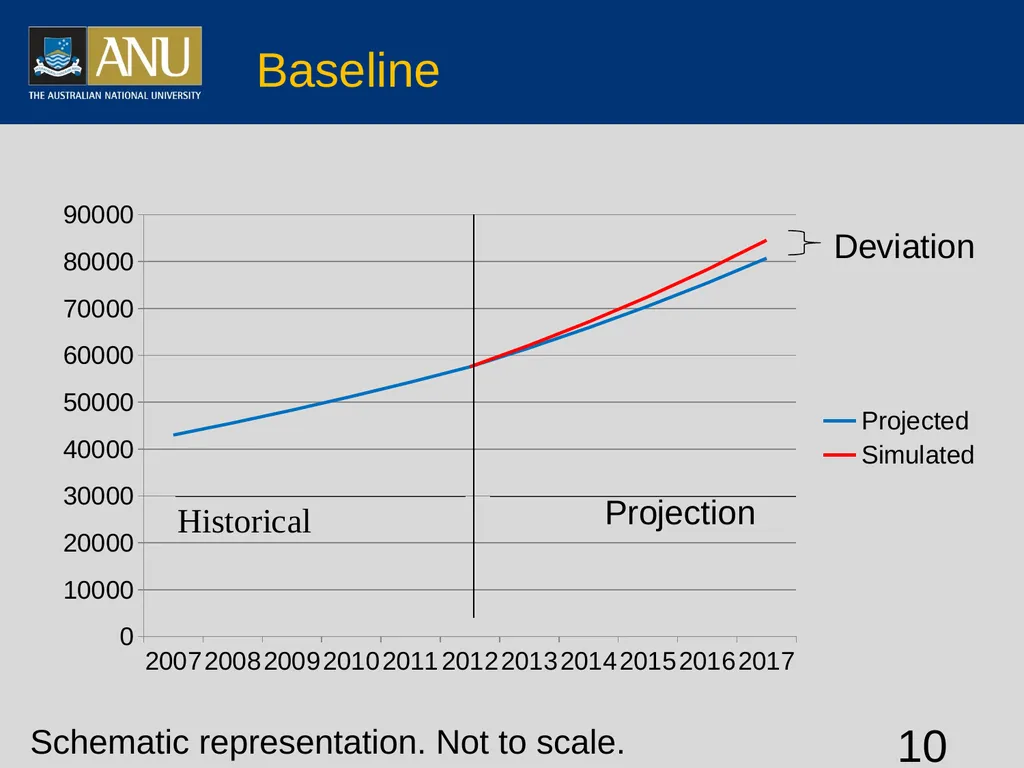
Baseline 10 Schematic representation. Not to scale.<br>
11
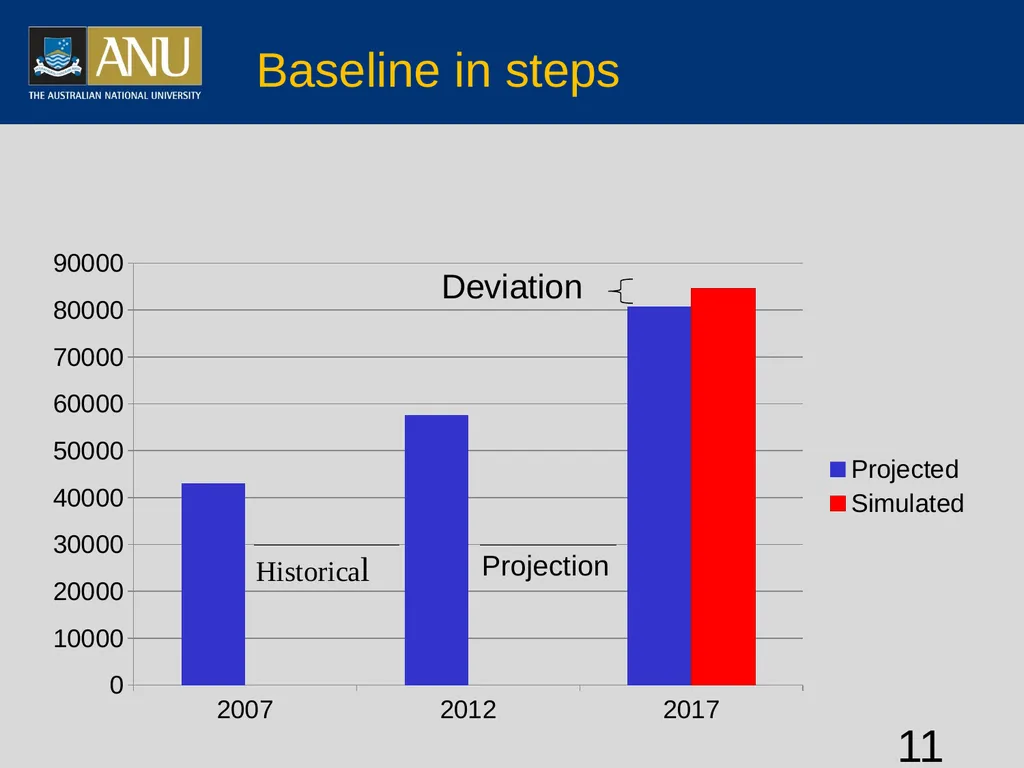
Baseline in steps 11<br>
12
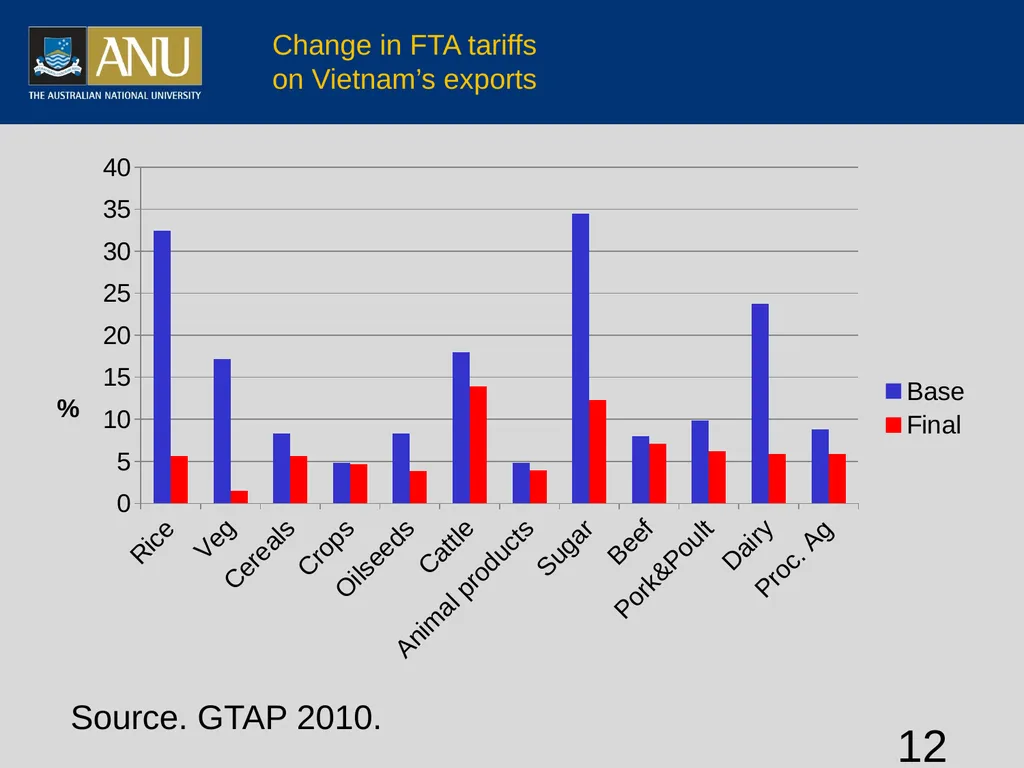
Change in FTA tariffs on Vietnam’s exports 12 Source. GTAP 2010.<br>
Vietnam welfare gains in 2017 relative to 2012 15 Income growth important<br>
16
Vietnam trade impacts in 2017 relative to base 16 Growth in imports exceed imports<br>
17
Vietnam trade balance in 2017 relative to base 17<br>
18
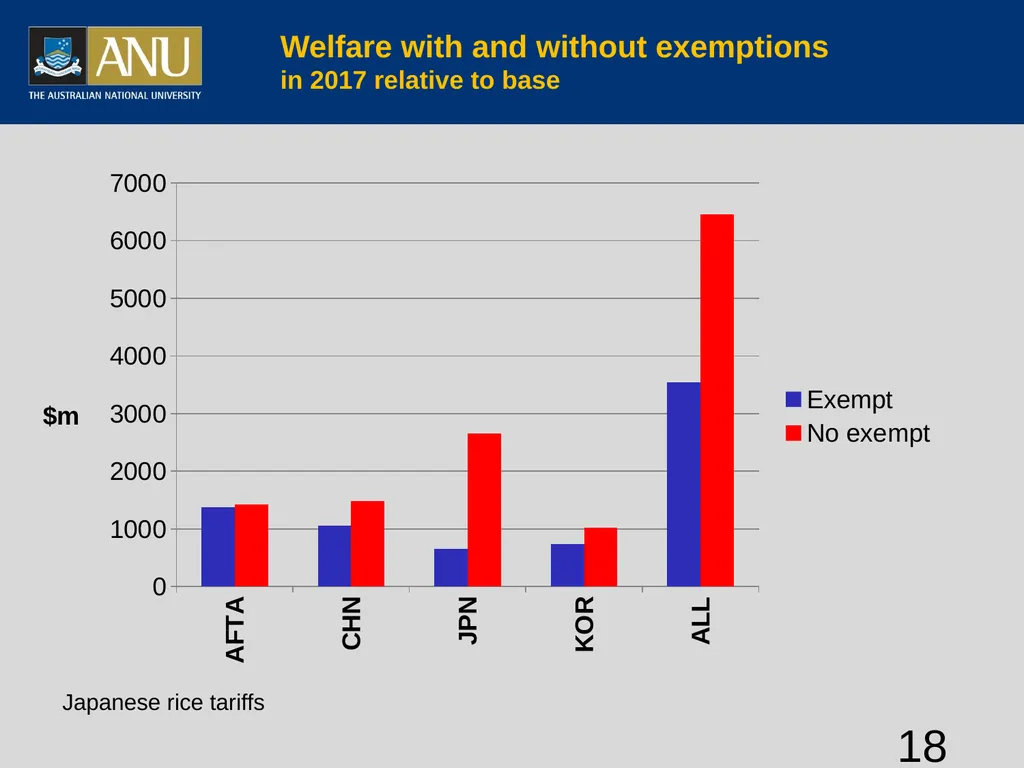
Welfare with and without exemptions in 2017 relative to base 18 Japanese rice tariffs<br>
19
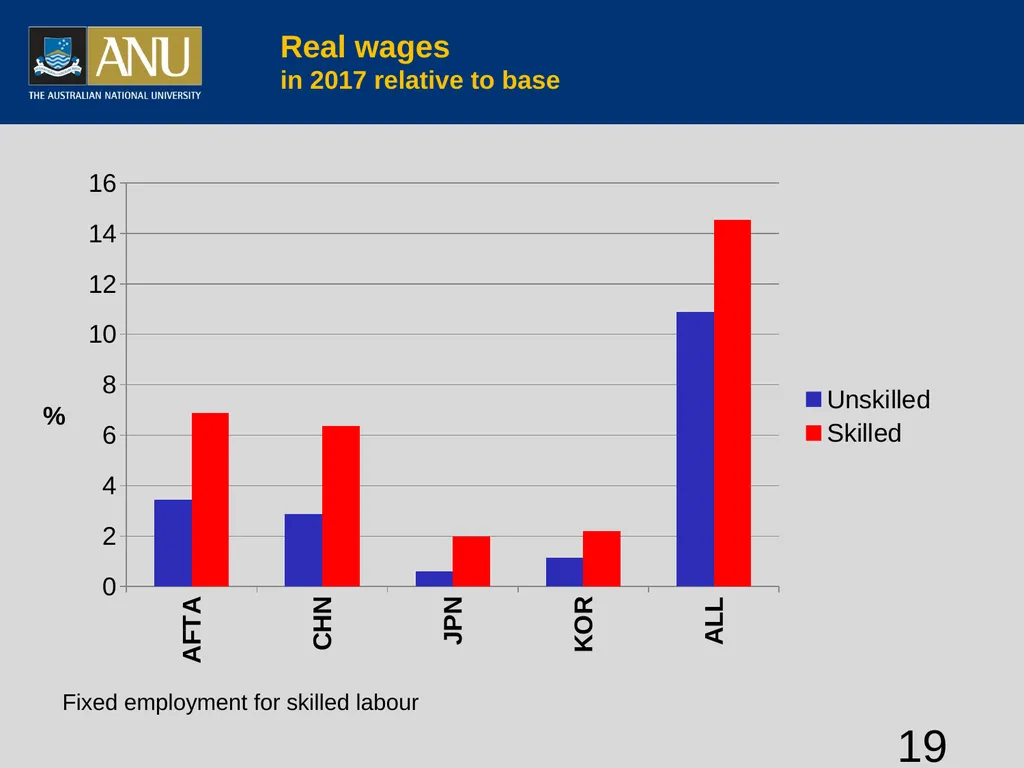
Real wages in 2017 relative to base 19 Fixed employment for skilled labour<br>
20
Vietnam tariff revenue in 2017 relative to base 20<br>
21
Agricultural sector impacts Output
Exports
Imports
Use of land, labour and capital
Factor prices 21<br>
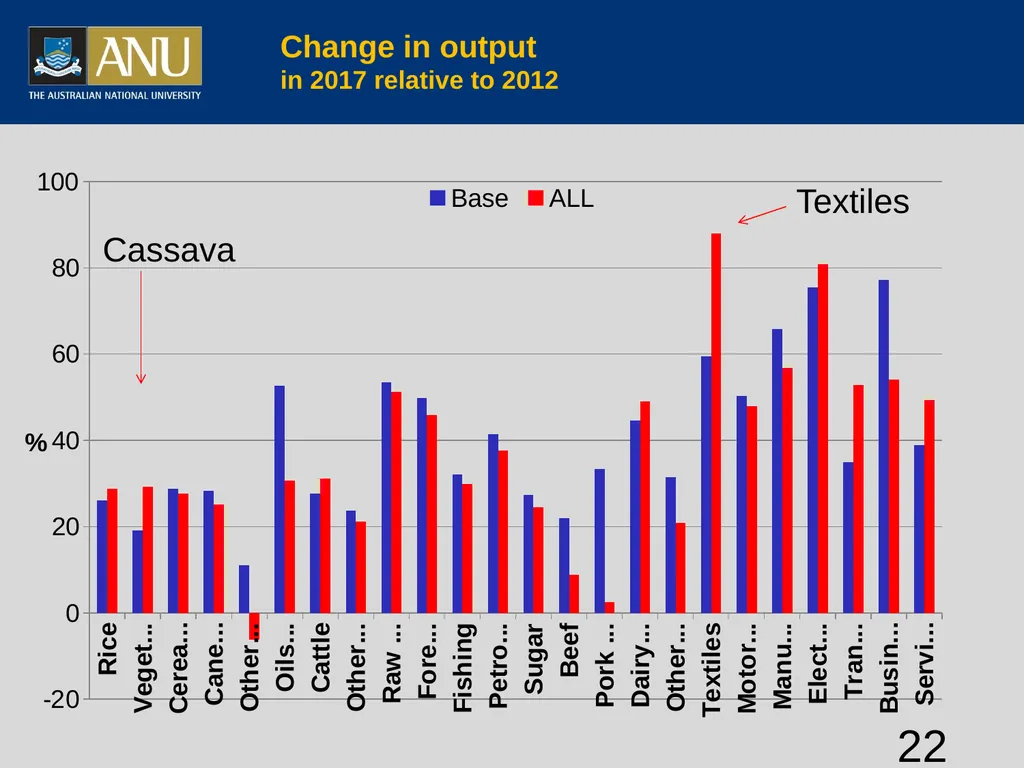
22
Change in output in 2017 relative to 2012 22 Textiles Cassava<br>
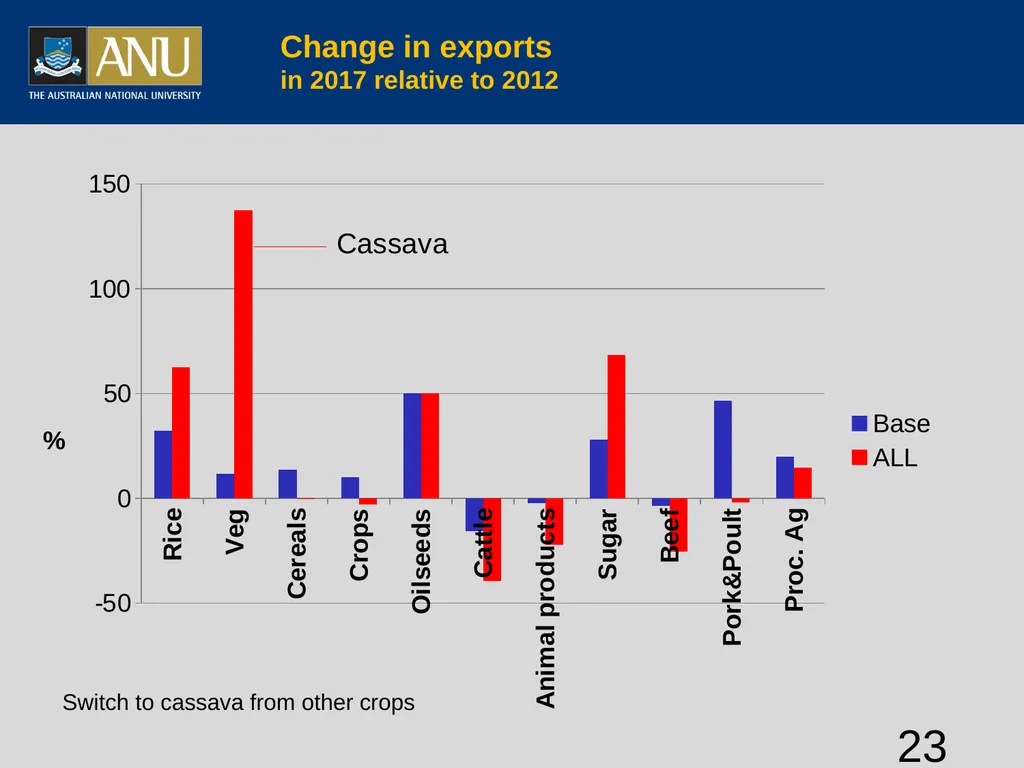
23
Change in exports in 2017 relative to 2012 23 Switch to cassava from other crops<br>
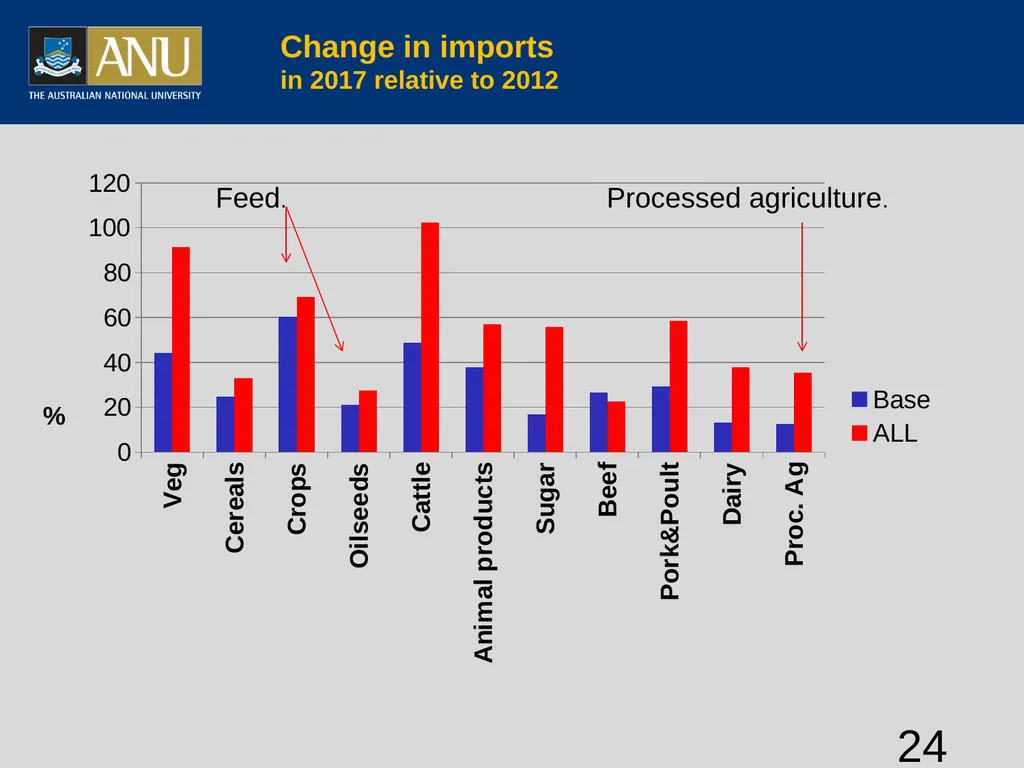
24
Change in imports in 2017 relative to 2012 24 Processed agriculture. Feed.<br>
25
Use of factors in agriculture Change in 2017 relative to 2012 25<br>
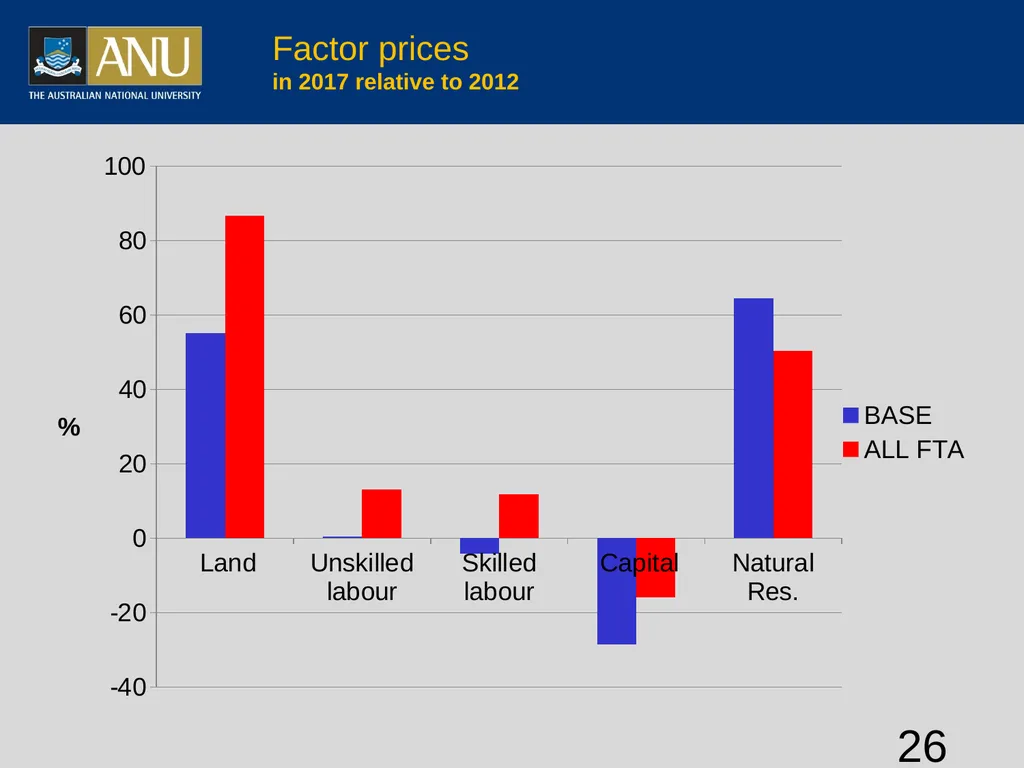
26
Factor prices in 2017 relative to 2012 26<br>
27
Summary of macro results Income growth important. Changes implemented against background of expanding economy
Positive welfare effects (national income) from FTAs
Real wage increases
Tariff revenue reduced somewhat
Trade balance negative 27<br>
28
Policy implications Income growth depends on capital (macro policy)
Non-tariff barriers still exist, and may increase
Structural adjustment manageable
Need flexible land, labour and capital markets
WTO virtually completed. No further tariff cuts
Ignored here other FTAs, such as EU, Trans Pacific Partnership, Regional Comprehensive Economic Partnership 28<br>