
Vp Risk Assessment and Calculator Development John
Description: Vp Risk Assessment and Calculator Development John Bowers, FDACFSAN ISSC Vp Workshop, Baltimore MD September 6-7, 2017 Overview Risk Assessment and Risk Calculator Development Key Assumptions and limitations Validation Skill Assessment
Related Topics
Download Presentation
"Vp Risk Assessment and Calculator Development John" is the property of its rightful owner. Permission is granted to download and print the materials on this website for personal, non-commercial use only, and to display it on your personal computer provided you do not modify the materials and that you retain all copyright notices contained in the materials. By downloading content from our website, you accept the terms of this agreement.
Presentation Transcript
slide1. Vp Risk Assessment and Calculator Development John Bowers, FDA/CFSAN
ISSC Vp Workshop, Baltimore MD
September 6-7, 2017<br>
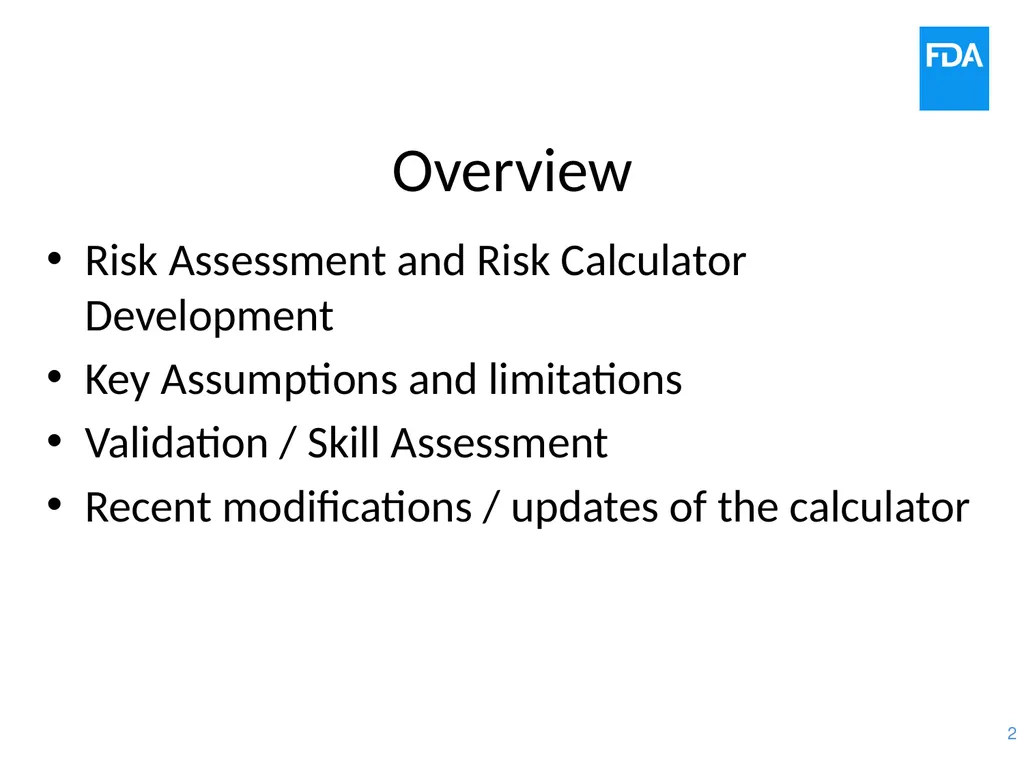
slide2. Overview Risk Assessment and Risk Calculator Development
Key Assumptions and limitations
Validation / Skill Assessment
Recent modifications / updates of the calculator<br>
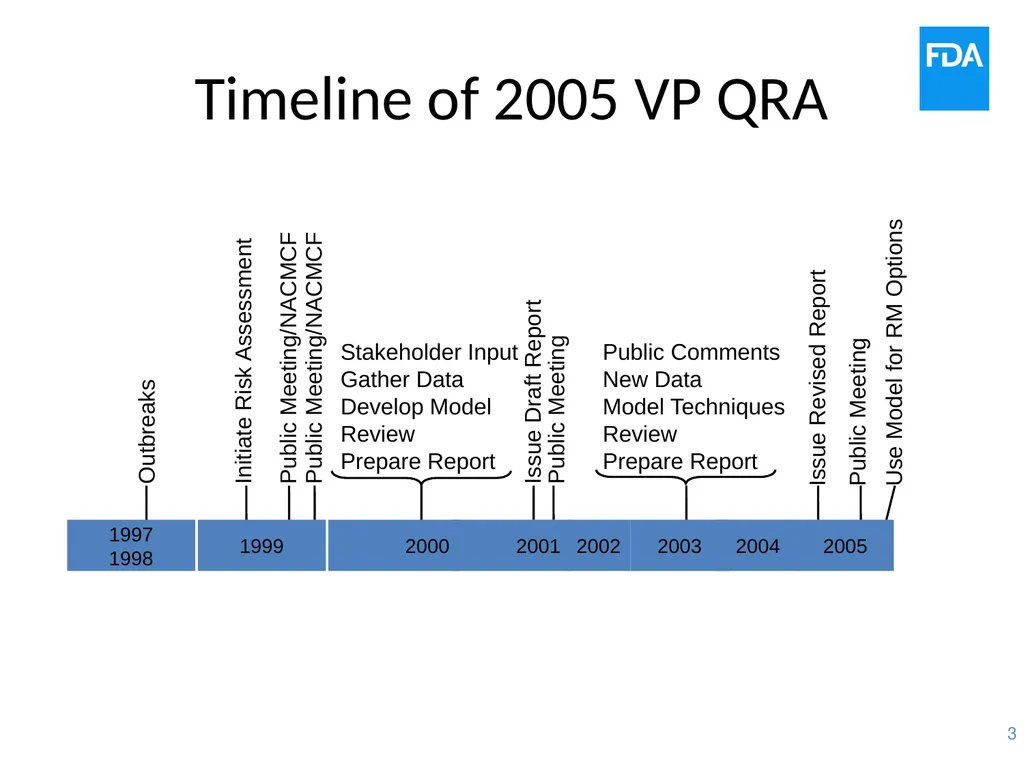
slide3. 1997
1998 1999 2000 Outbreaks Initiate Risk Assessment Public Meeting/NACMCF Public Meeting/NACMCF 2001 2003 2004 2005 Stakeholder Input
Gather Data
Develop Model
Review
Prepare Report Issue Draft Report Public Meeting Public Comments
New Data
Model Techniques
Review
Prepare Report Public Meeting Use Model for RM Options Issue Revised Report 2002 Timeline of 2005 VP QRA<br>
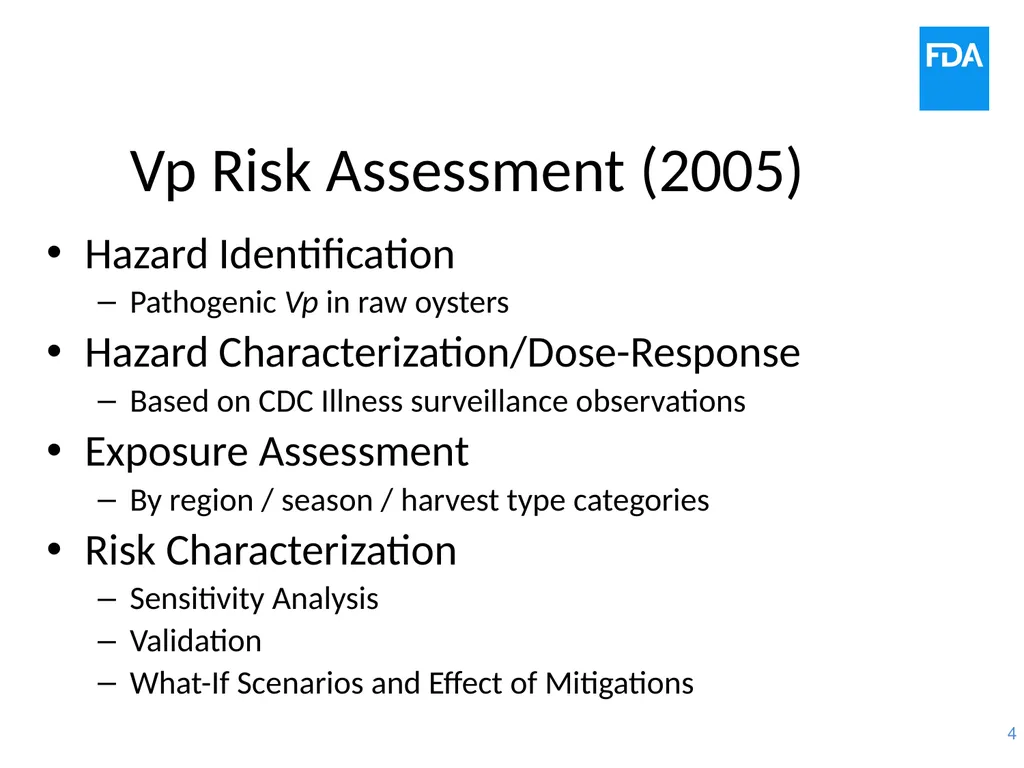
slide4. Vp Risk Assessment (2005) Hazard Identification
Pathogenic Vp in raw oysters
Hazard Characterization/Dose-Response
Based on CDC Illness surveillance observations
Exposure Assessment
By region / season / harvest type categories
Risk Characterization
Sensitivity Analysis
Validation
What-If Scenarios and Effect of Mitigations<br>
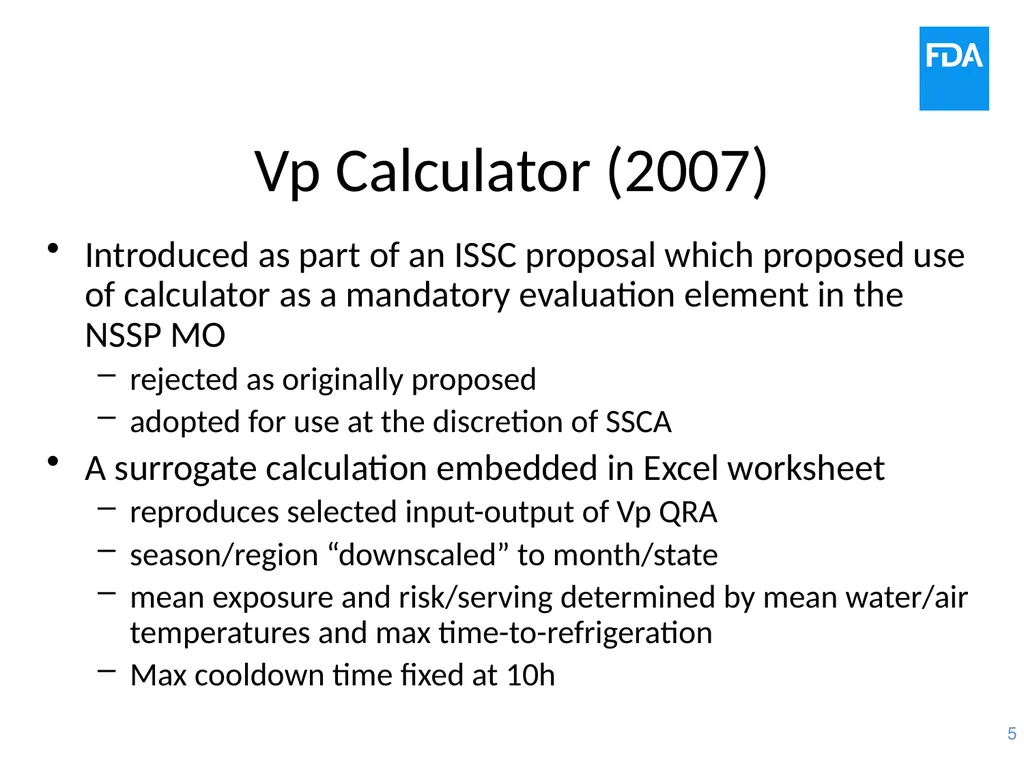
slide5. Vp Calculator (2007) Introduced as part of an ISSC proposal which proposed use of calculator as a mandatory evaluation element in the NSSP MO
rejected as originally proposed
adopted for use at the discretion of SSCA
A surrogate calculation embedded in Excel worksheet
reproduces selected input-output of Vp QRA
season/region “downscaled” to month/state
mean exposure and risk/serving determined by mean water/air temperatures and max time-to-refrigeration
Max cooldown time fixed at 10h<br>
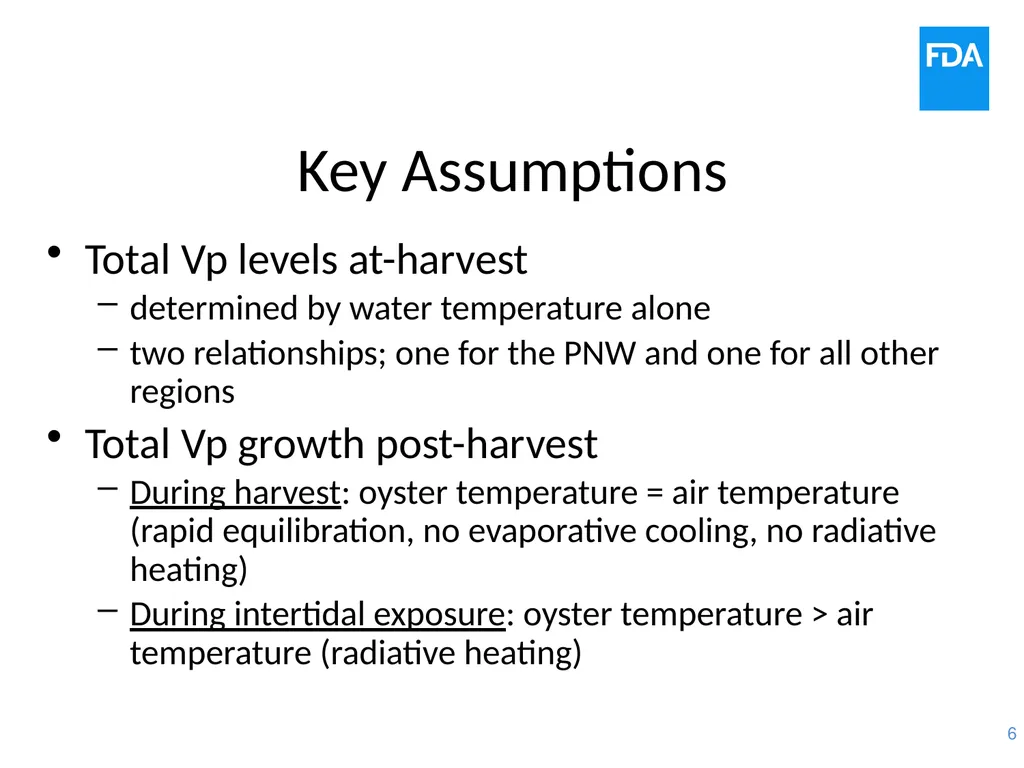
slide6. Key Assumptions Total Vp levels at-harvest
determined by water temperature alone
two relationships; one for the PNW and one for all other regions
Total Vp growth post-harvest
During harvest: oyster temperature = air temperature (rapid equilibration, no evaporative cooling, no radiative heating)
During intertidal exposure: oyster temperature > air temperature (radiative heating)<br>
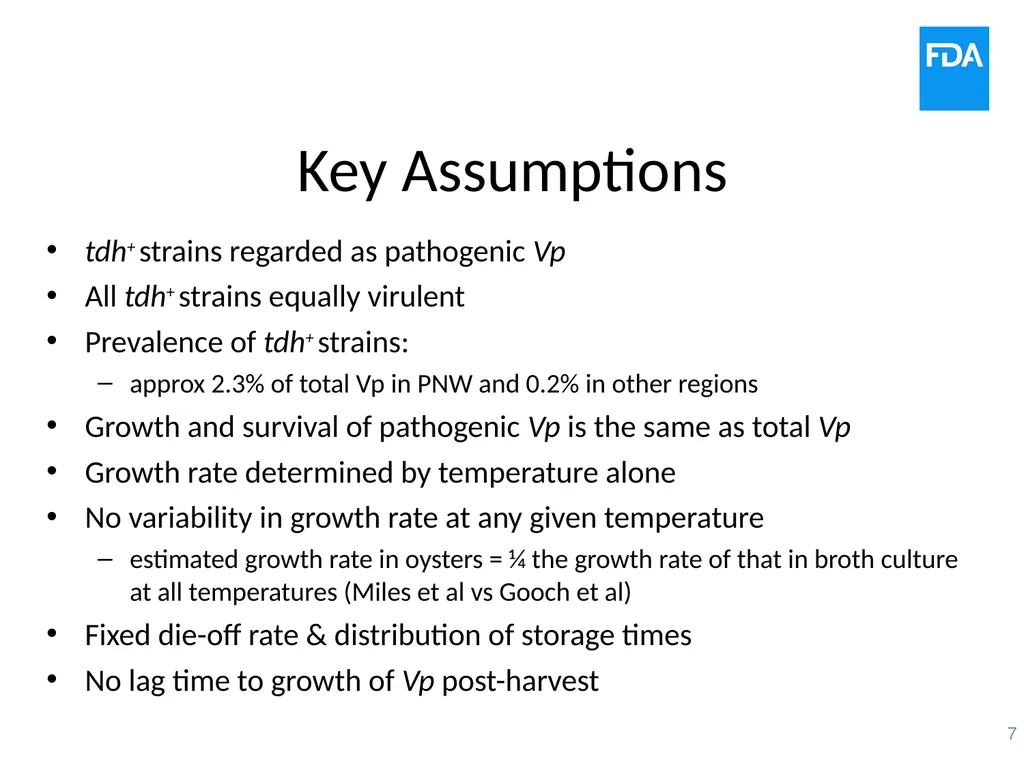
slide7. Key Assumptions tdh+ strains regarded as pathogenic Vp
All tdh+ strains equally virulent
Prevalence of tdh+ strains:
approx 2.3% of total Vp in PNW and 0.2% in other regions
Growth and survival of pathogenic Vp is the same as total Vp
Growth rate determined by temperature alone
No variability in growth rate at any given temperature
estimated growth rate in oysters = ¼ the growth rate of that in broth culture at all temperatures (Miles et al vs Gooch et al)
Fixed die-off rate & distribution of storage times
No lag time to growth of Vp post-harvest<br>
slide8. Key Assumptions Illness underreporting multiplier
20:1 estimate (Mead et al 1999)
now estimated at > 150:1 (Scallan et al 2011)
Servings determined by NMFS landings
Average serving size of 12 oysters (approx 200g)
Raw consumption = 50% of landings
no seasonal or regional variation in raw consumption percentage<br>
slide9. Validation / Skill Assessment Vp Risk Assessment (2005)
predictions of region/season exposures (Vp/g at retail) - good
predicted total # of illnesses - can’t be validated
prediction of seasonal distribution of illness - good/fair
predictions of regional distribution of illness - poor
Vp calculator (2007)
no validation was conducted
Individual components of QRA
Growth rate model
Total Vp at-harvest versus water temperature
Predicted Effect of time-temperature controls<br>
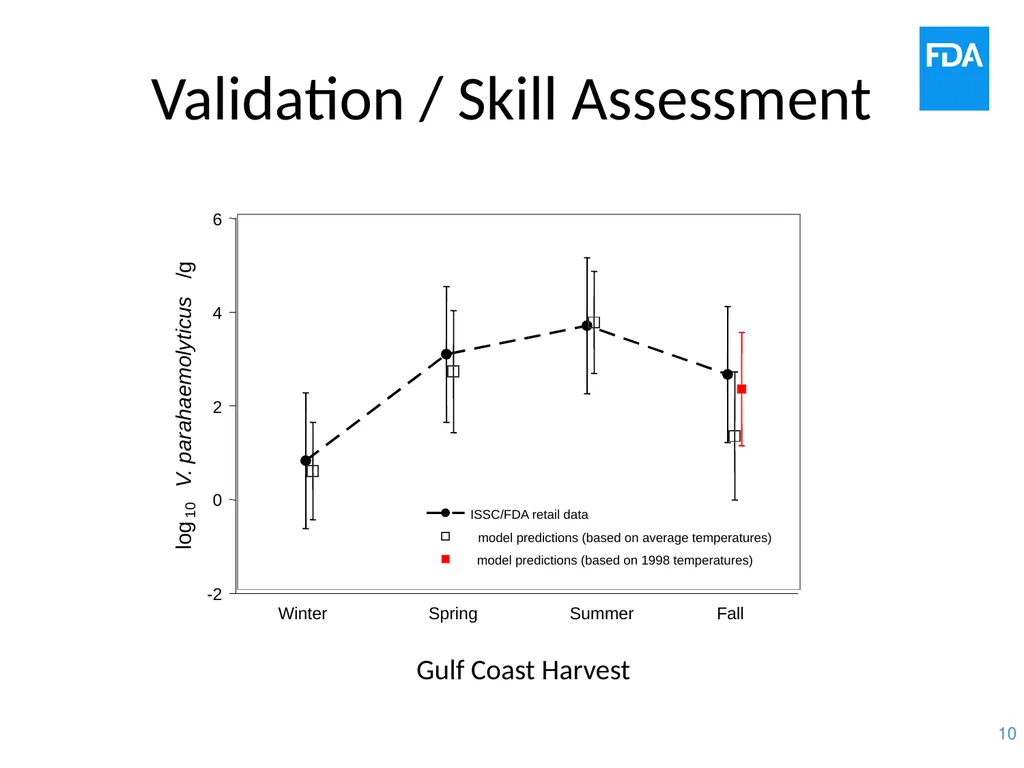
slide10. Validation / Skill Assessment<br>
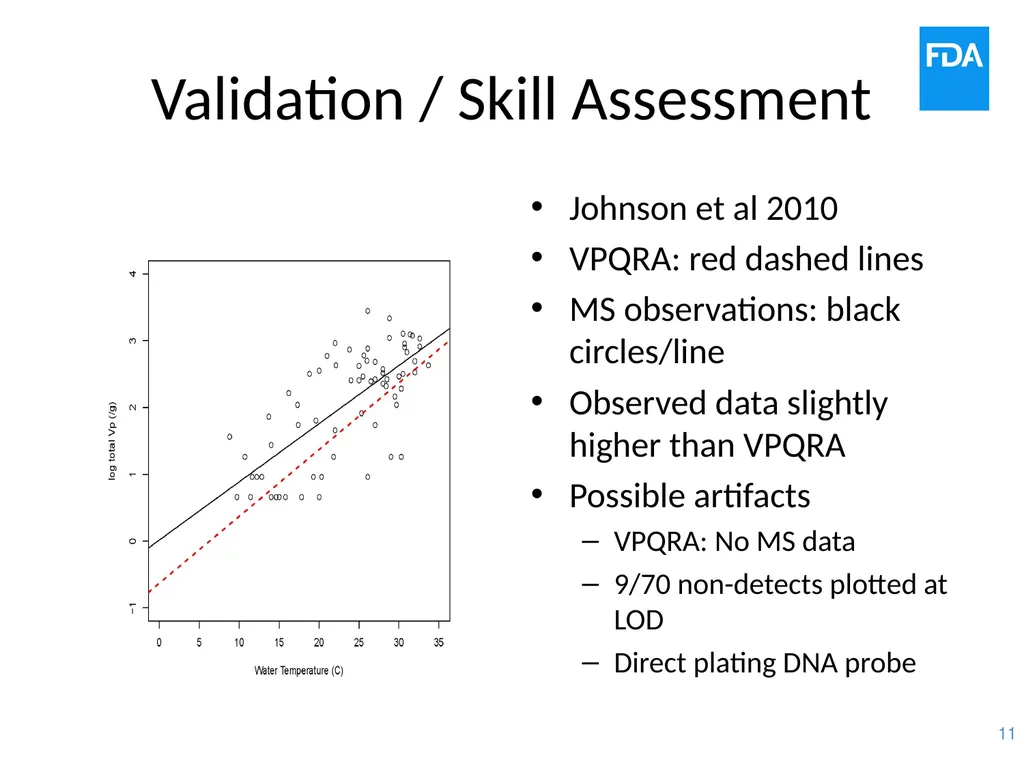
slide11. Validation / Skill Assessment Johnson et al 2010
VPQRA: red dashed lines
MS observations: black circles/line
Observed data slightly higher than VPQRA
Possible artifacts
VPQRA: No MS data
9/70 non-detects plotted at LOD
Direct plating DNA probe<br>
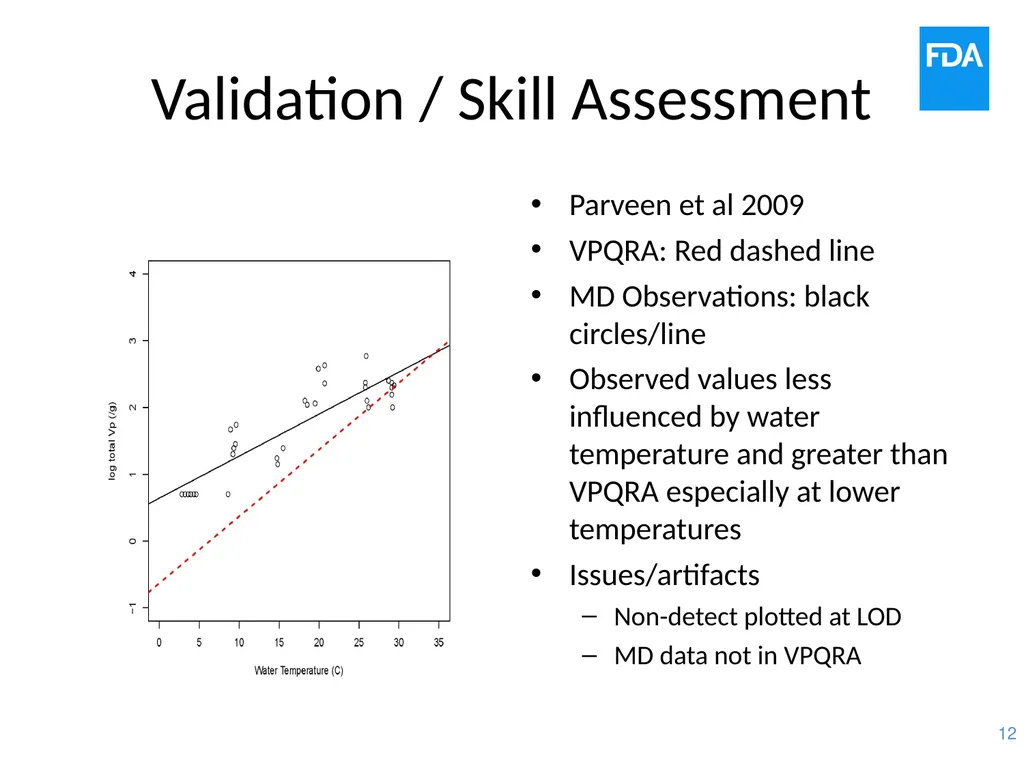
slide12. Validation / Skill Assessment Parveen et al 2009
VPQRA: Red dashed line
MD Observations: black circles/line
Observed values less influenced by water temperature and greater than VPQRA especially at lower temperatures
Issues/artifacts
Non-detect plotted at LOD
MD data not in VPQRA<br>
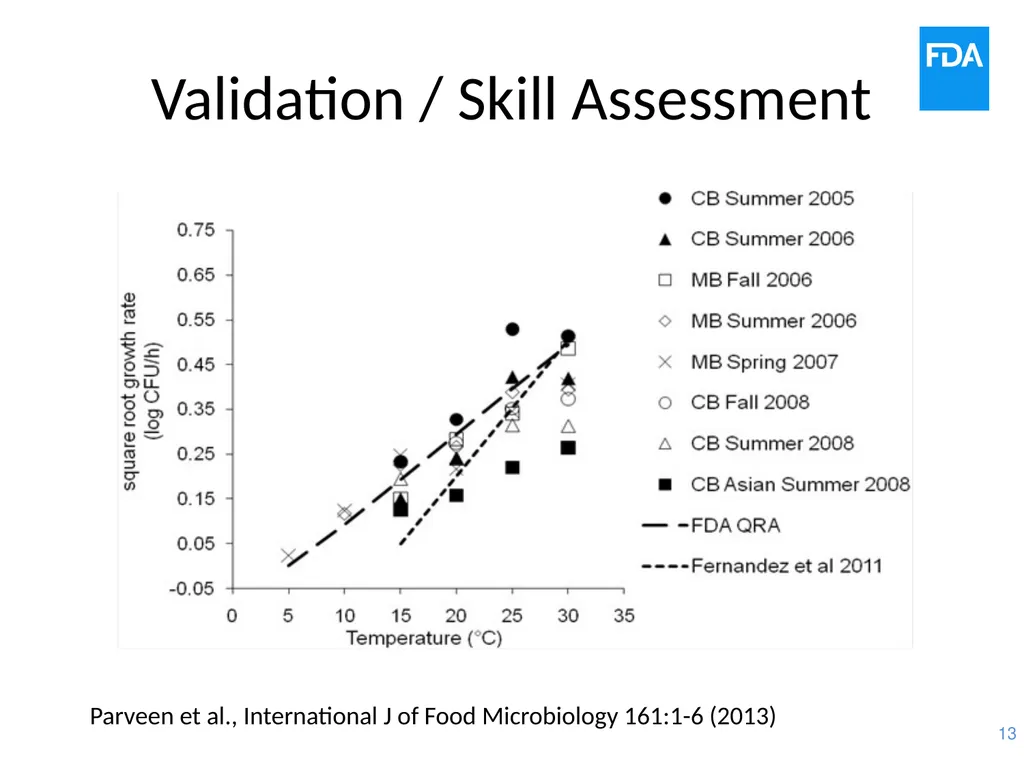
slide13. Validation / Skill Assessment Parveen et al., International J of Food Microbiology 161:1-6 (2013)<br>
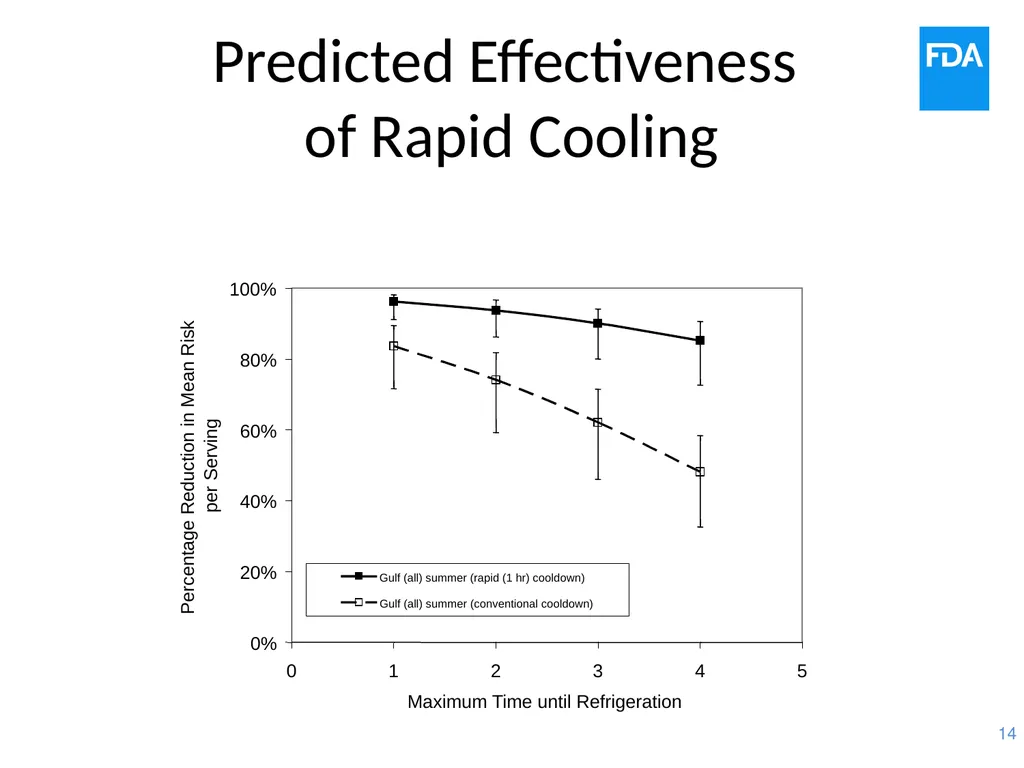
slide14. Predicted Effectiveness of Rapid Cooling<br>
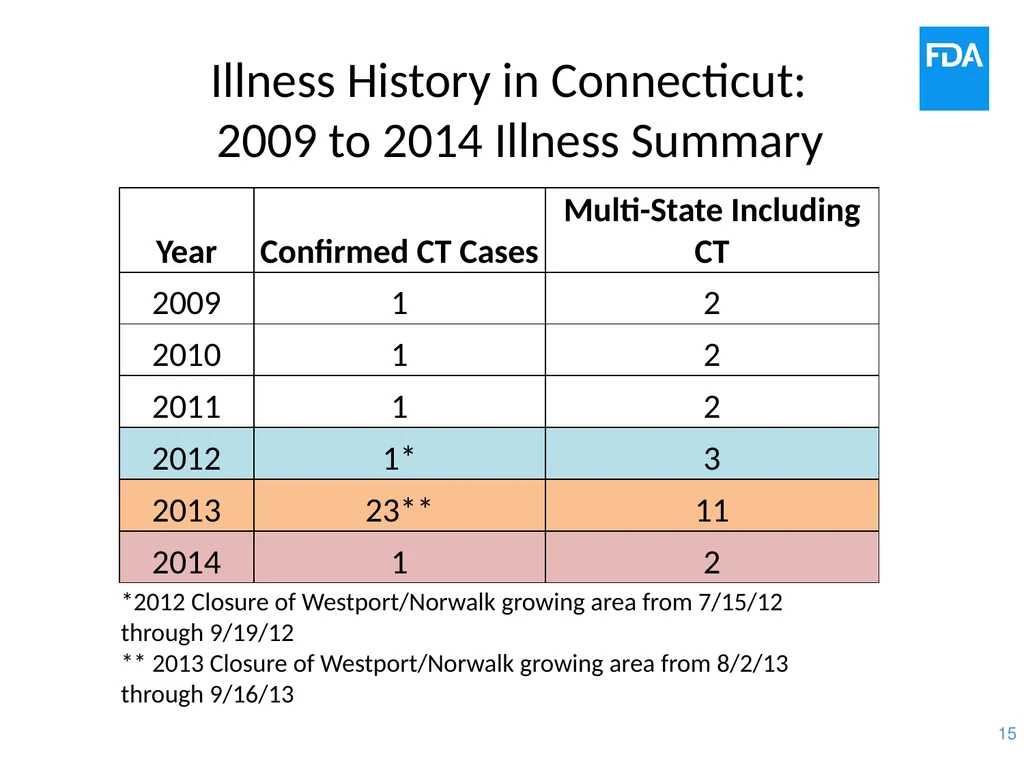
slide15. Illness History in Connecticut: 2009 to 2014 Illness Summary *2012 Closure of Westport/Norwalk growing area from 7/15/12 through 9/19/12
** 2013 Closure of Westport/Norwalk growing area from 8/2/13 through 9/16/13<br>
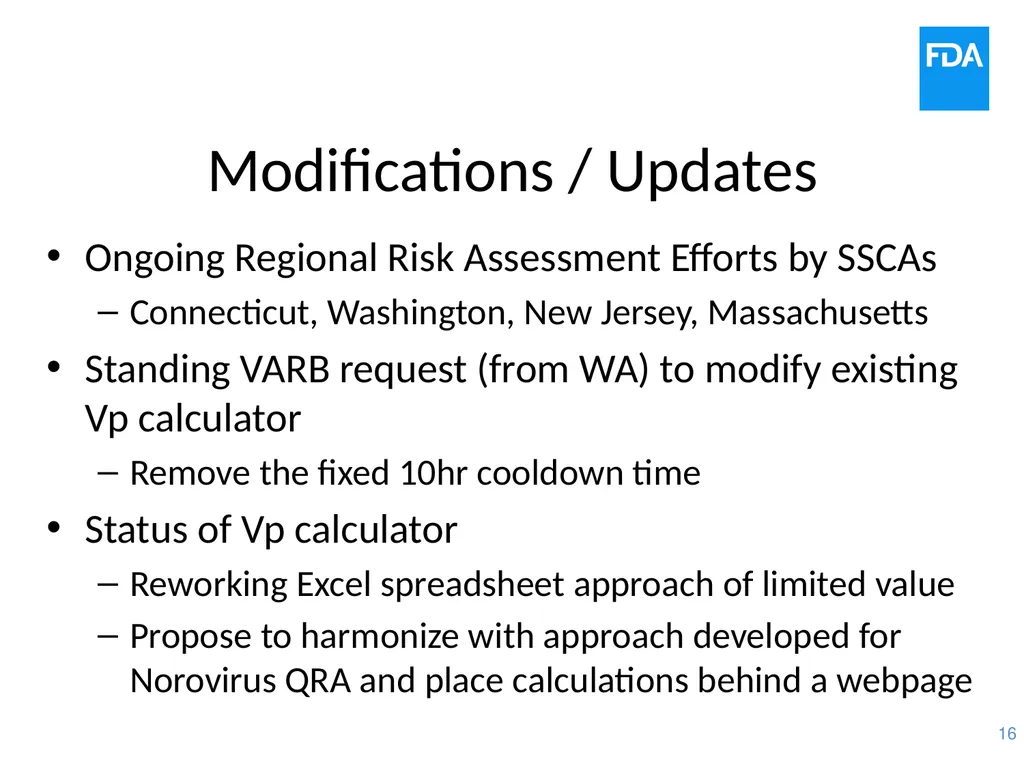
slide16. Modifications / Updates Ongoing Regional Risk Assessment Efforts by SSCAs
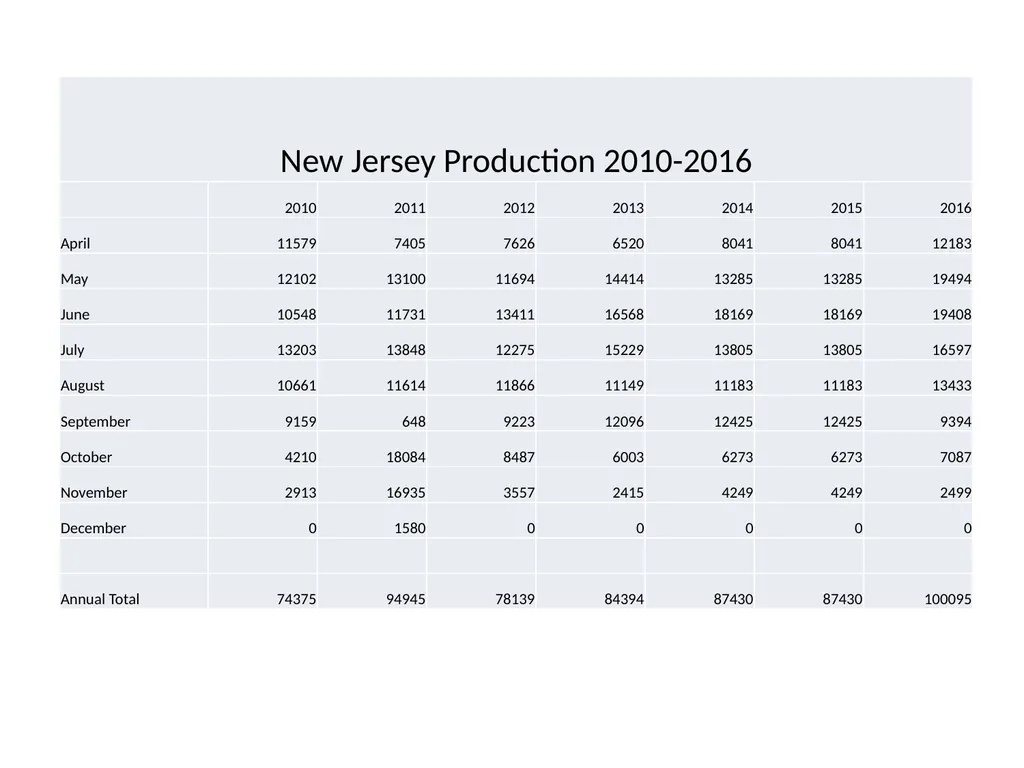
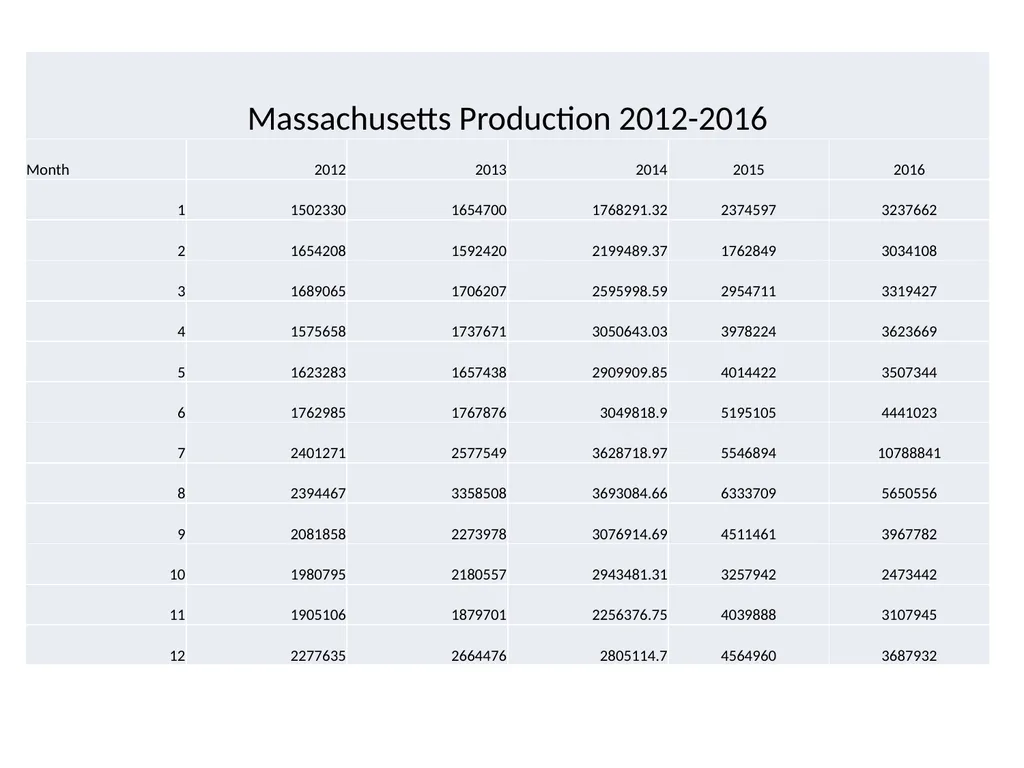
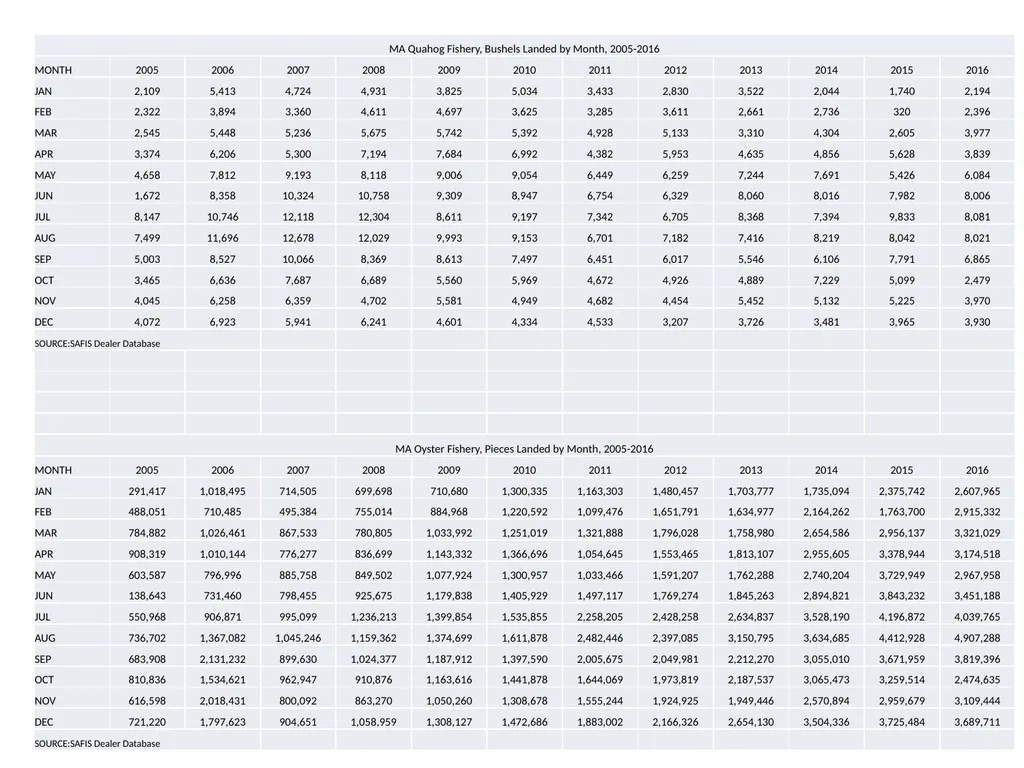
Connecticut, Washington, New Jersey, Massachusetts
Standing VARB request (from WA) to modify existing Vp calculator
Remove the fixed 10hr cooldown time
Status of Vp calculator
Reworking Excel spreadsheet approach of limited value
Propose to harmonize with approach developed for Norovirus QRA and place calculations behind a webpage<br>
ISSC Vp Workshop, Baltimore MD
September 6-7, 2017<br>
slide2. Overview Risk Assessment and Risk Calculator Development
Key Assumptions and limitations
Validation / Skill Assessment
Recent modifications / updates of the calculator<br>
slide3. 1997
1998 1999 2000 Outbreaks Initiate Risk Assessment Public Meeting/NACMCF Public Meeting/NACMCF 2001 2003 2004 2005 Stakeholder Input
Gather Data
Develop Model
Review
Prepare Report Issue Draft Report Public Meeting Public Comments
New Data
Model Techniques
Review
Prepare Report Public Meeting Use Model for RM Options Issue Revised Report 2002 Timeline of 2005 VP QRA<br>
slide4. Vp Risk Assessment (2005) Hazard Identification
Pathogenic Vp in raw oysters
Hazard Characterization/Dose-Response
Based on CDC Illness surveillance observations
Exposure Assessment
By region / season / harvest type categories
Risk Characterization
Sensitivity Analysis
Validation
What-If Scenarios and Effect of Mitigations<br>
slide5. Vp Calculator (2007) Introduced as part of an ISSC proposal which proposed use of calculator as a mandatory evaluation element in the NSSP MO
rejected as originally proposed
adopted for use at the discretion of SSCA
A surrogate calculation embedded in Excel worksheet
reproduces selected input-output of Vp QRA
season/region “downscaled” to month/state
mean exposure and risk/serving determined by mean water/air temperatures and max time-to-refrigeration
Max cooldown time fixed at 10h<br>
slide6. Key Assumptions Total Vp levels at-harvest
determined by water temperature alone
two relationships; one for the PNW and one for all other regions
Total Vp growth post-harvest
During harvest: oyster temperature = air temperature (rapid equilibration, no evaporative cooling, no radiative heating)
During intertidal exposure: oyster temperature > air temperature (radiative heating)<br>
slide7. Key Assumptions tdh+ strains regarded as pathogenic Vp
All tdh+ strains equally virulent
Prevalence of tdh+ strains:
approx 2.3% of total Vp in PNW and 0.2% in other regions
Growth and survival of pathogenic Vp is the same as total Vp
Growth rate determined by temperature alone
No variability in growth rate at any given temperature
estimated growth rate in oysters = ¼ the growth rate of that in broth culture at all temperatures (Miles et al vs Gooch et al)
Fixed die-off rate & distribution of storage times
No lag time to growth of Vp post-harvest<br>
slide8. Key Assumptions Illness underreporting multiplier
20:1 estimate (Mead et al 1999)
now estimated at > 150:1 (Scallan et al 2011)
Servings determined by NMFS landings
Average serving size of 12 oysters (approx 200g)
Raw consumption = 50% of landings
no seasonal or regional variation in raw consumption percentage<br>
slide9. Validation / Skill Assessment Vp Risk Assessment (2005)
predictions of region/season exposures (Vp/g at retail) - good
predicted total # of illnesses - can’t be validated
prediction of seasonal distribution of illness - good/fair
predictions of regional distribution of illness - poor
Vp calculator (2007)
no validation was conducted
Individual components of QRA
Growth rate model
Total Vp at-harvest versus water temperature
Predicted Effect of time-temperature controls<br>
slide10. Validation / Skill Assessment<br>
slide11. Validation / Skill Assessment Johnson et al 2010
VPQRA: red dashed lines
MS observations: black circles/line
Observed data slightly higher than VPQRA
Possible artifacts
VPQRA: No MS data
9/70 non-detects plotted at LOD
Direct plating DNA probe<br>
slide12. Validation / Skill Assessment Parveen et al 2009
VPQRA: Red dashed line
MD Observations: black circles/line
Observed values less influenced by water temperature and greater than VPQRA especially at lower temperatures
Issues/artifacts
Non-detect plotted at LOD
MD data not in VPQRA<br>
slide13. Validation / Skill Assessment Parveen et al., International J of Food Microbiology 161:1-6 (2013)<br>
slide14. Predicted Effectiveness of Rapid Cooling<br>
slide15. Illness History in Connecticut: 2009 to 2014 Illness Summary *2012 Closure of Westport/Norwalk growing area from 7/15/12 through 9/19/12
** 2013 Closure of Westport/Norwalk growing area from 8/2/13 through 9/16/13<br>
slide16. Modifications / Updates Ongoing Regional Risk Assessment Efforts by SSCAs
Connecticut, Washington, New Jersey, Massachusetts
Standing VARB request (from WA) to modify existing Vp calculator
Remove the fixed 10hr cooldown time
Status of Vp calculator
Reworking Excel spreadsheet approach of limited value
Propose to harmonize with approach developed for Norovirus QRA and place calculations behind a webpage<br>