Weather Map Interpretation Weather Map Weather map
Description: Weather Map Interpretation Weather Map Weather map is a tool for geographers to study meteorological phenomena. It contains the state of condition of various weather elements at a particular hour of a day. The hour of the day at which the
Related Topics
Download Presentation
"Weather Map Interpretation Weather Map Weather map" is the property of its rightful owner. Permission is granted to download and print the materials on this website for personal, non-commercial use only, and to display it on your personal computer provided you do not modify the materials and that you retain all copyright notices contained in the materials. By downloading content from our website, you accept the terms of this agreement.
Presentation Transcript
slide1. Weather Map Interpretation<br>
slide2. Weather Map Weather map is a tool for geographers to study meteorological phenomena.
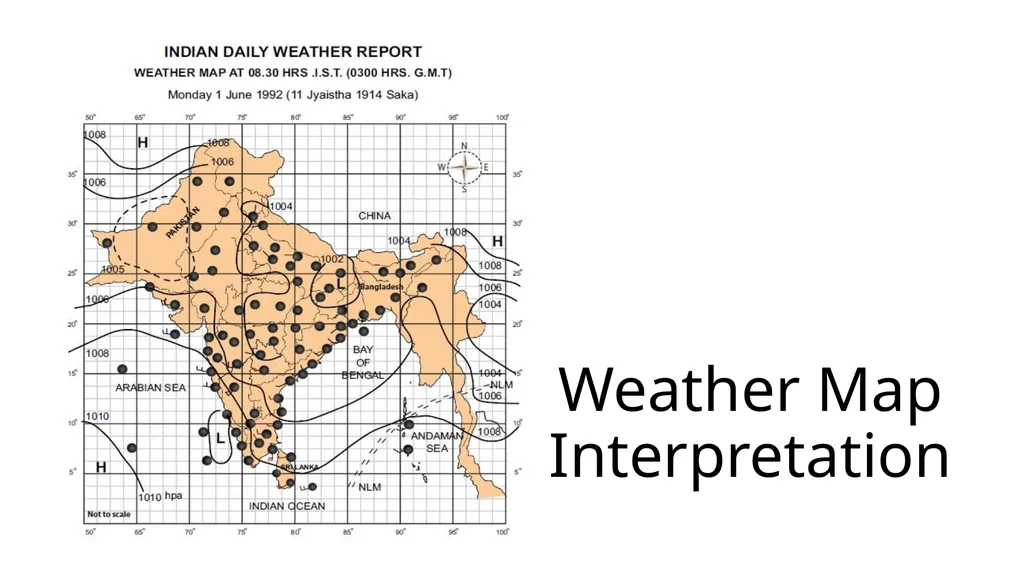
It contains the state of condition of various weather elements at a particular hour of a day. The hour of the day at which the observations are made is given at the top of the map. The date is also mentioned along with it.
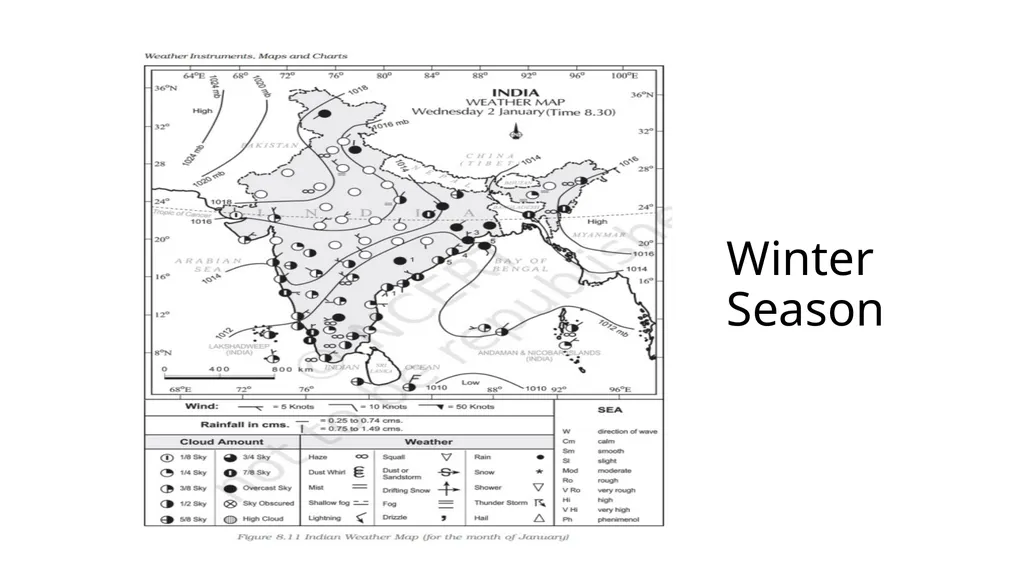
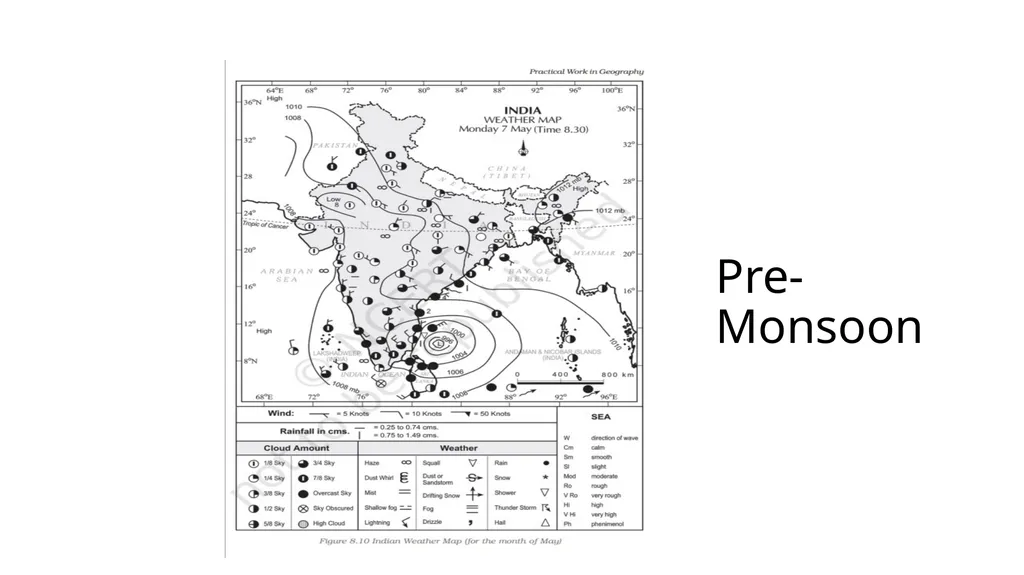
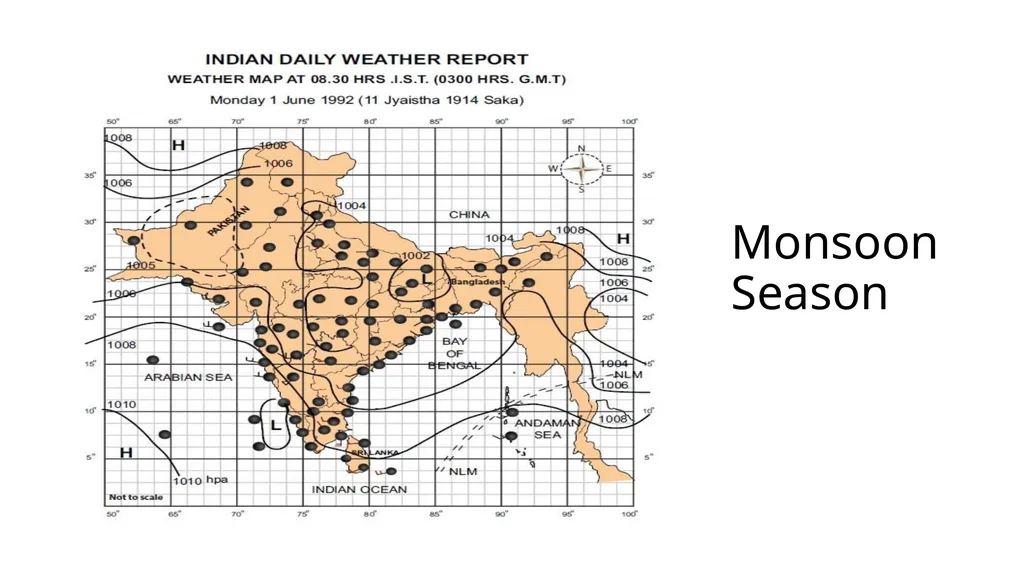
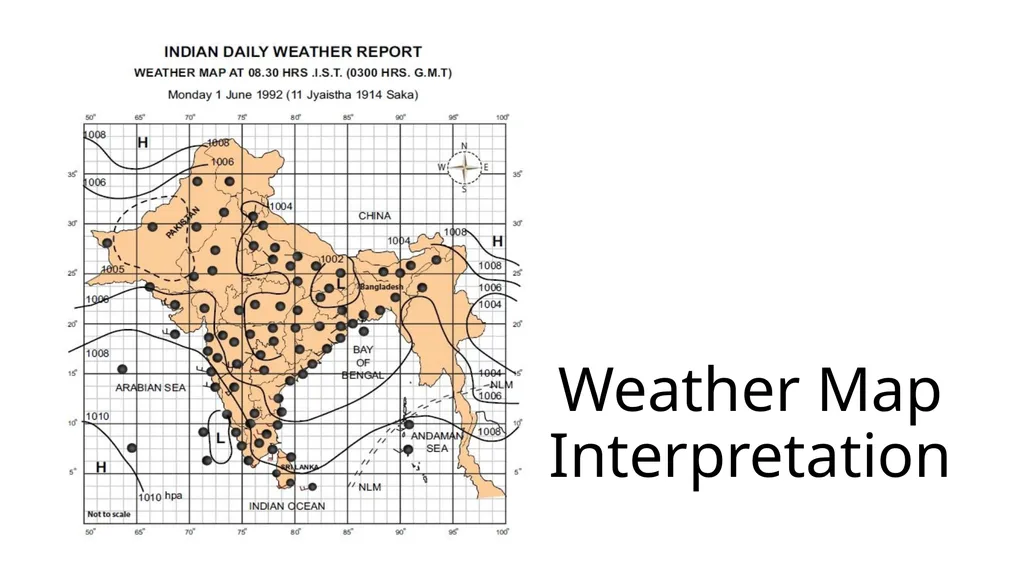
However, the map, as such does not include information about all the elements of daily weather. It incorporates the isobars drawn at 2 millibar interval and related location of high and low, the amount of cloud cover present in the sky, the direction and velocity of wind, the amount of rainfall, and some other weather phenomena, such as haze, fog, mist, squall, depression, limit of south-westerly monsoon wind, sandstorm, thunderstorm, dust devil, etc. Over the oceanic and sea-areas the condition of the sea is also marked.<br>
slide3. How is a weather map different from a synoptic chart? Although the information in a weather map about various weather elements seem to be comprehensive, they do not include anything about the present or past temperature conditions, about the types of clouds covering the sky at various levels, about the humidity and about many other pertinent information.
To obtain a more elaborate data about the conditions of all other weather elements usually a synoptic chart is used with station models prepared for different IMD stations.<br>
slide4. Interpretation of weather Map The interpretation of a weather map is a sequential way of determining the general condition of weather of the day and the preconditions for the next few hours.
If the study is made for a few consecutive days, the regional trend of changes of various weather phenomena can be understood.<br>
slide5. WinterSeason<br>
slide6. Pre- Monsoon<br>
slide7. Monsoon Season<br>
slide2. Weather Map Weather map is a tool for geographers to study meteorological phenomena.
It contains the state of condition of various weather elements at a particular hour of a day. The hour of the day at which the observations are made is given at the top of the map. The date is also mentioned along with it.
However, the map, as such does not include information about all the elements of daily weather. It incorporates the isobars drawn at 2 millibar interval and related location of high and low, the amount of cloud cover present in the sky, the direction and velocity of wind, the amount of rainfall, and some other weather phenomena, such as haze, fog, mist, squall, depression, limit of south-westerly monsoon wind, sandstorm, thunderstorm, dust devil, etc. Over the oceanic and sea-areas the condition of the sea is also marked.<br>
slide3. How is a weather map different from a synoptic chart? Although the information in a weather map about various weather elements seem to be comprehensive, they do not include anything about the present or past temperature conditions, about the types of clouds covering the sky at various levels, about the humidity and about many other pertinent information.
To obtain a more elaborate data about the conditions of all other weather elements usually a synoptic chart is used with station models prepared for different IMD stations.<br>
slide4. Interpretation of weather Map The interpretation of a weather map is a sequential way of determining the general condition of weather of the day and the preconditions for the next few hours.
If the study is made for a few consecutive days, the regional trend of changes of various weather phenomena can be understood.<br>
slide5. WinterSeason<br>
slide6. Pre- Monsoon<br>
slide7. Monsoon Season<br>