
World Inequality Report 2026 Executive Summary
Description: World Inequality Report 2026 Executive Summary Lucas Chancel, Ricardo Gómez-Carrera, Rowaida Moshrif, Thomas Piketty 10 Dec, 2025 Figure 1. The world is extremely unequal Figure 2. Extreme wealth inequality is persistent and increasing
Related Topics
Download Presentation
"World Inequality Report 2026 Executive Summary" is the property of its rightful owner. Permission is granted to download and print the materials on this website for personal, non-commercial use only, and to display it on your personal computer provided you do not modify the materials and that you retain all copyright notices contained in the materials. By downloading content from our website, you accept the terms of this agreement.
Presentation Transcript
slide1. World Inequality Report 2026 Executive Summary Lucas Chancel, Ricardo Gómez-Carrera,
Rowaida Moshrif, Thomas Piketty
10 Dec, 2025<br>
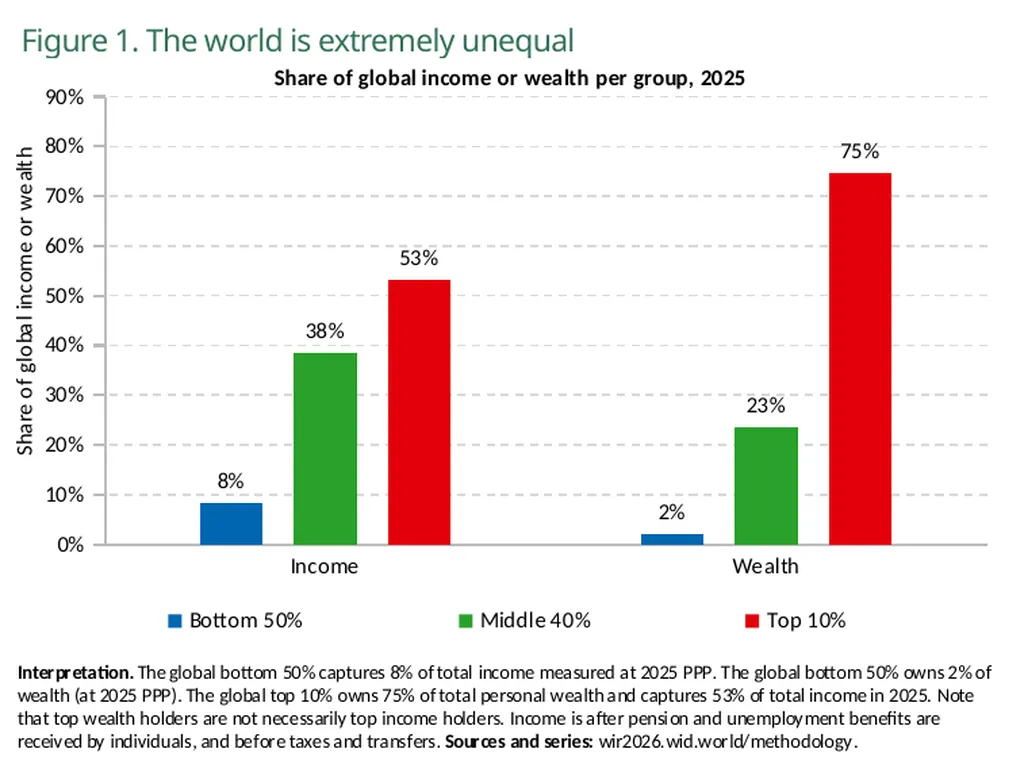
slide2. Figure 1. The world is extremely unequal<br>
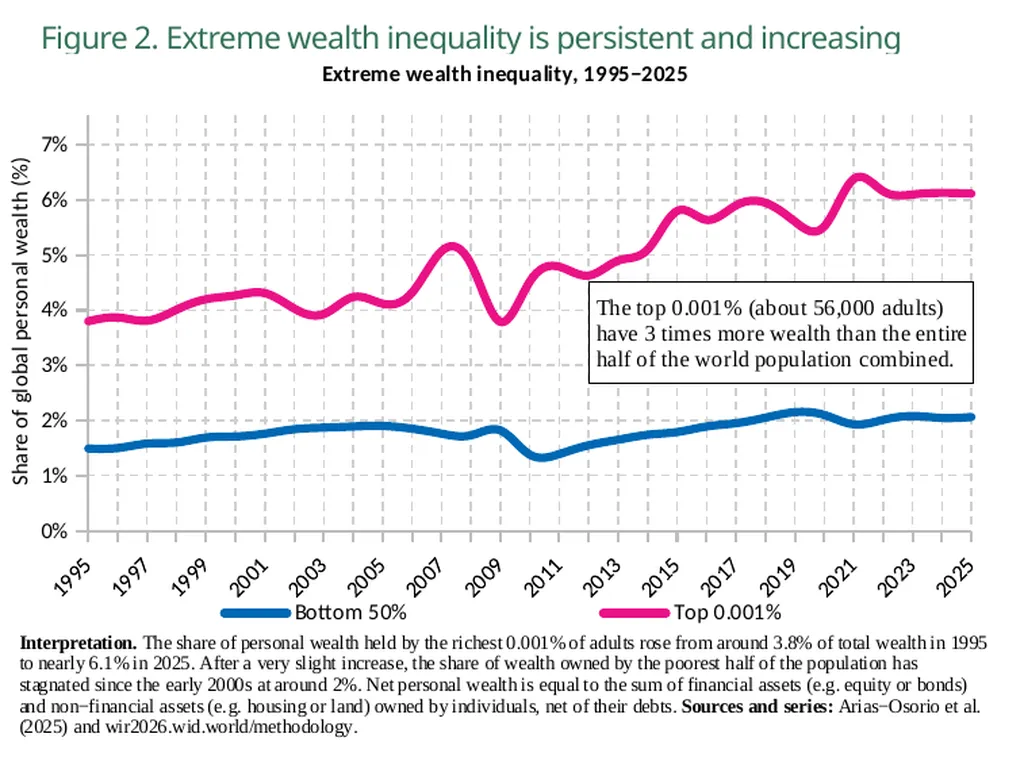
slide3. Figure 2. Extreme wealth inequality is persistent and increasing<br>
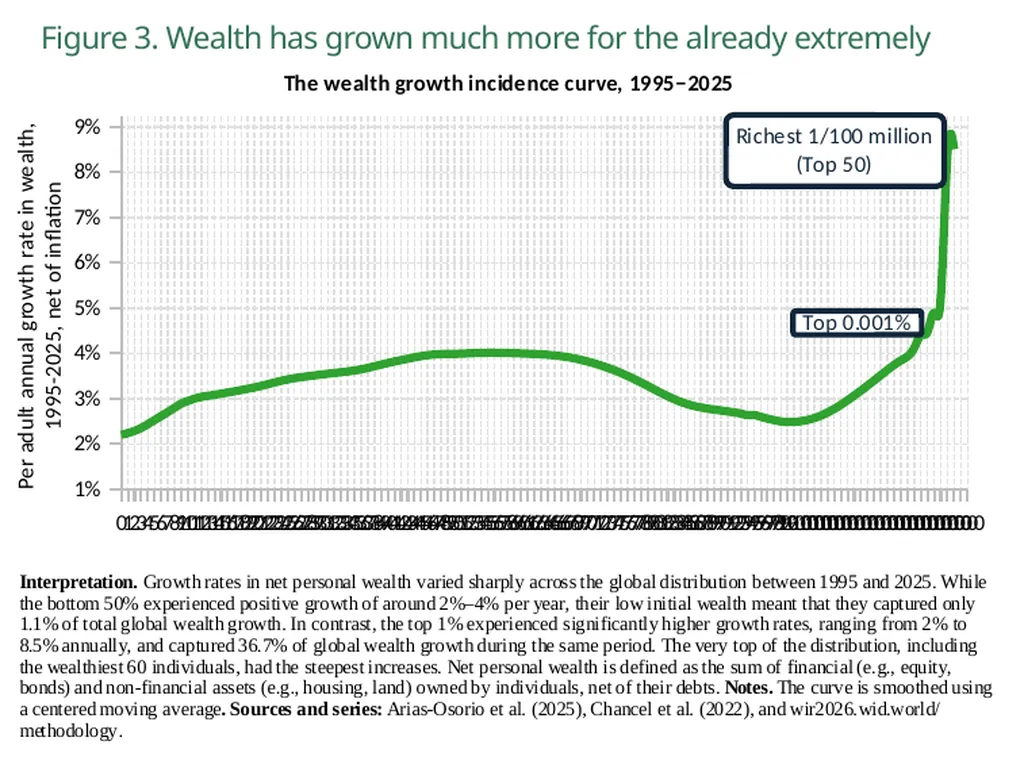
slide4. Figure 3. Wealth has grown much more for the already extremely wealthy<br>
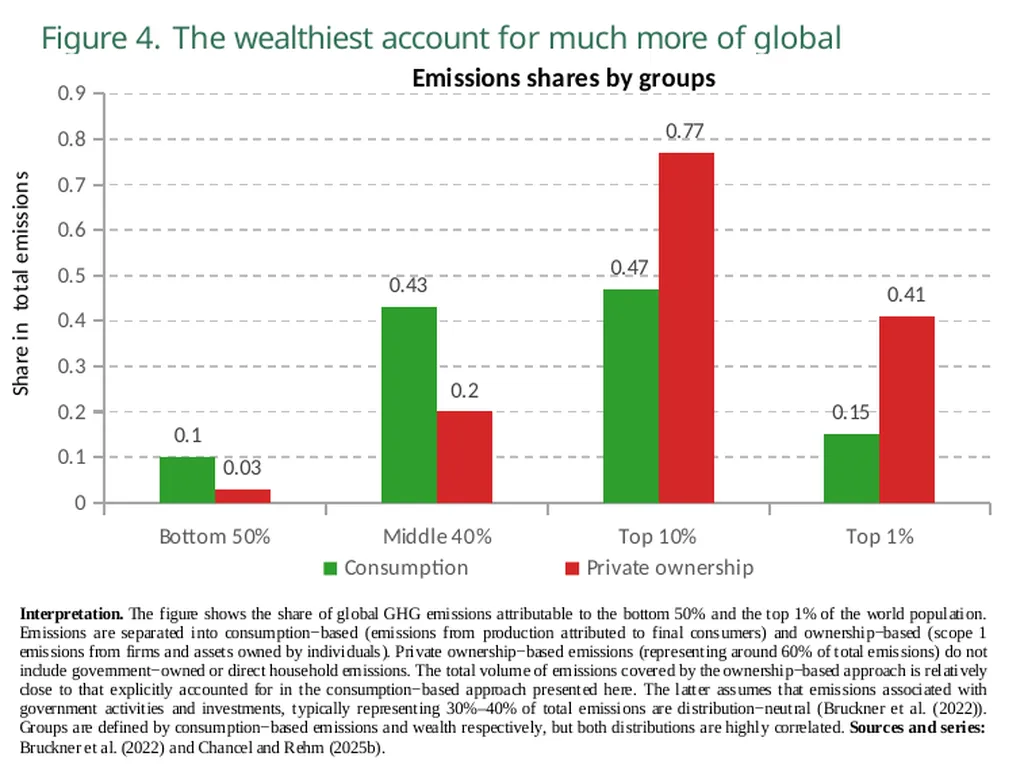
slide5. Figure 4. The wealthiest account for much more of global emissions<br>
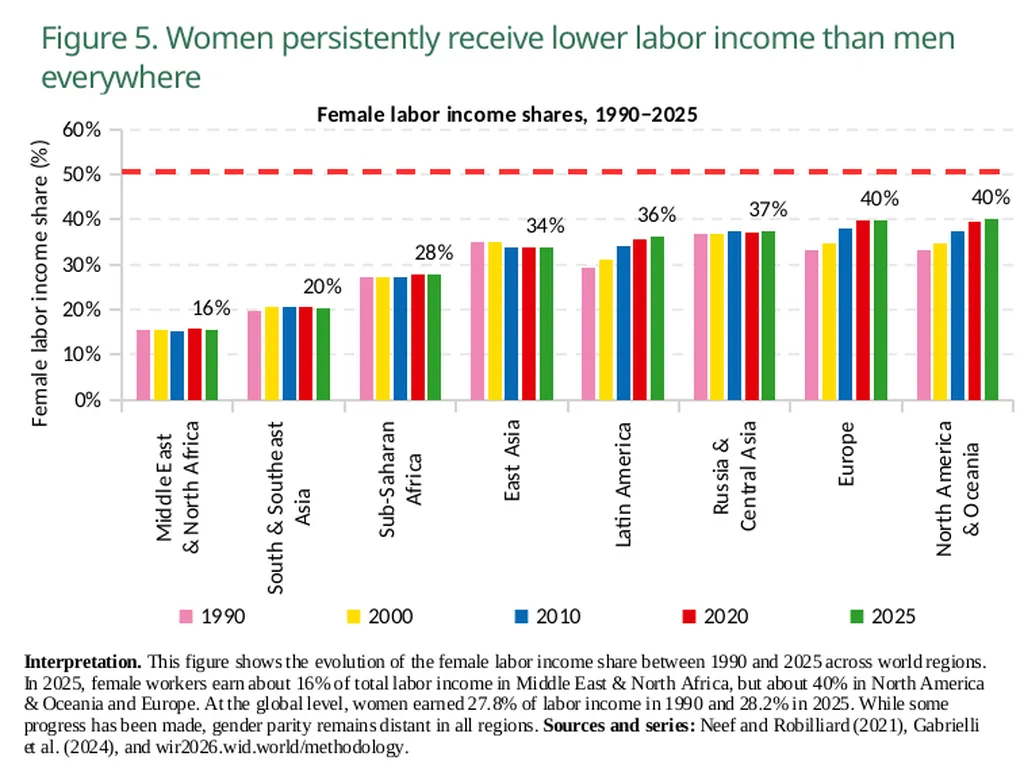
slide6. Figure 5. Women persistently receive lower labor income than men everywhere<br>
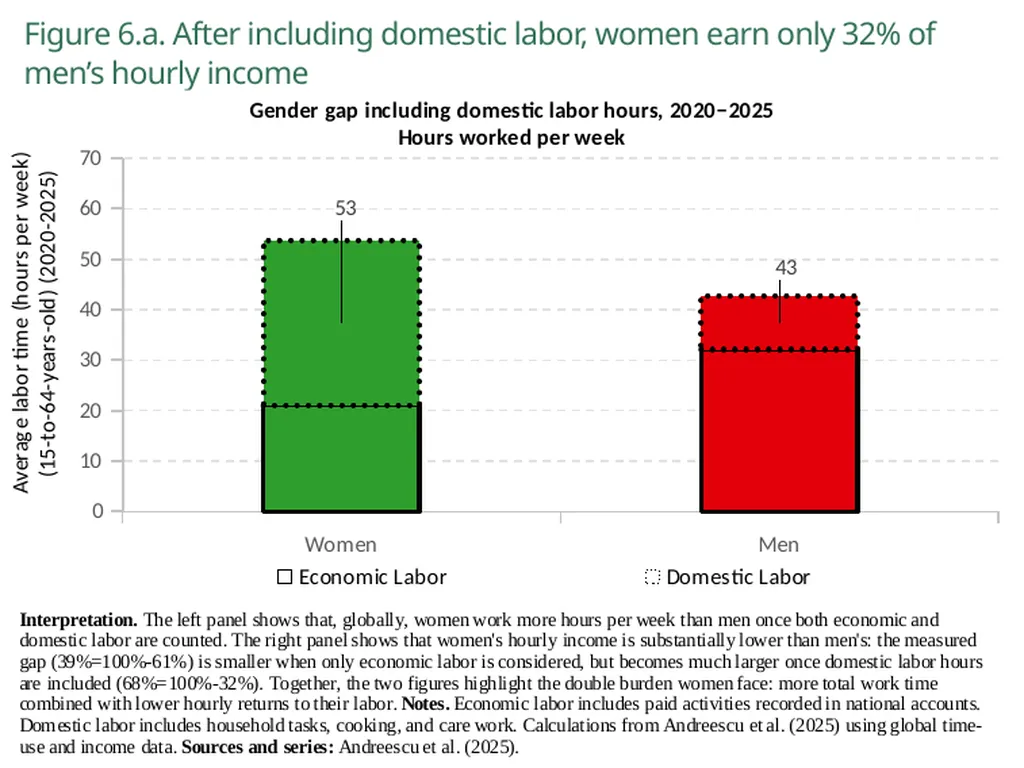
slide7. Figure 6.a. After including domestic labor, women earn only 32% of men’s hourly income<br>
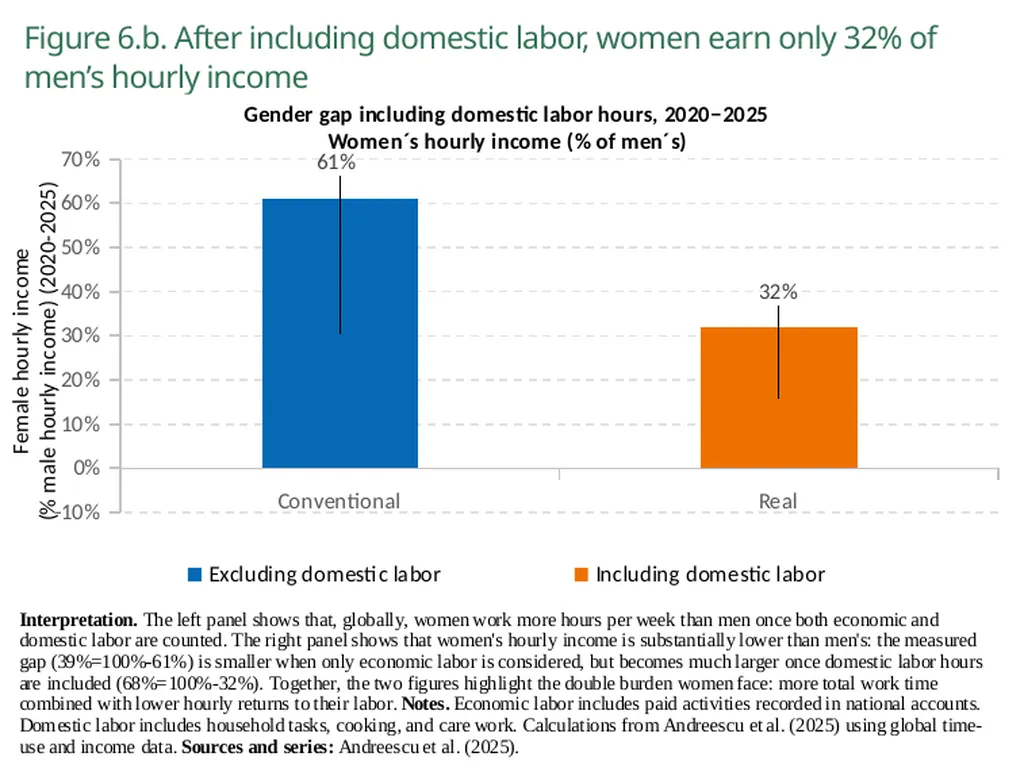
slide8. Figure 6.b. After including domestic labor, women earn only 32% of men’s hourly income<br>
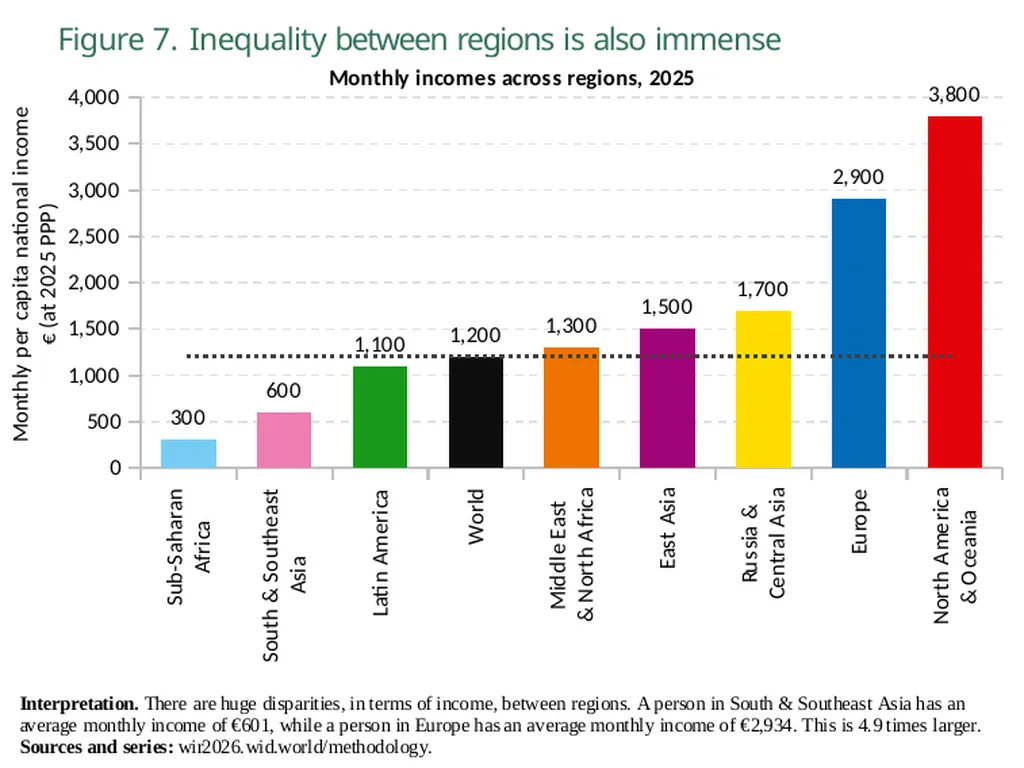
slide9. Figure 7. Inequality between regions is also immense<br>
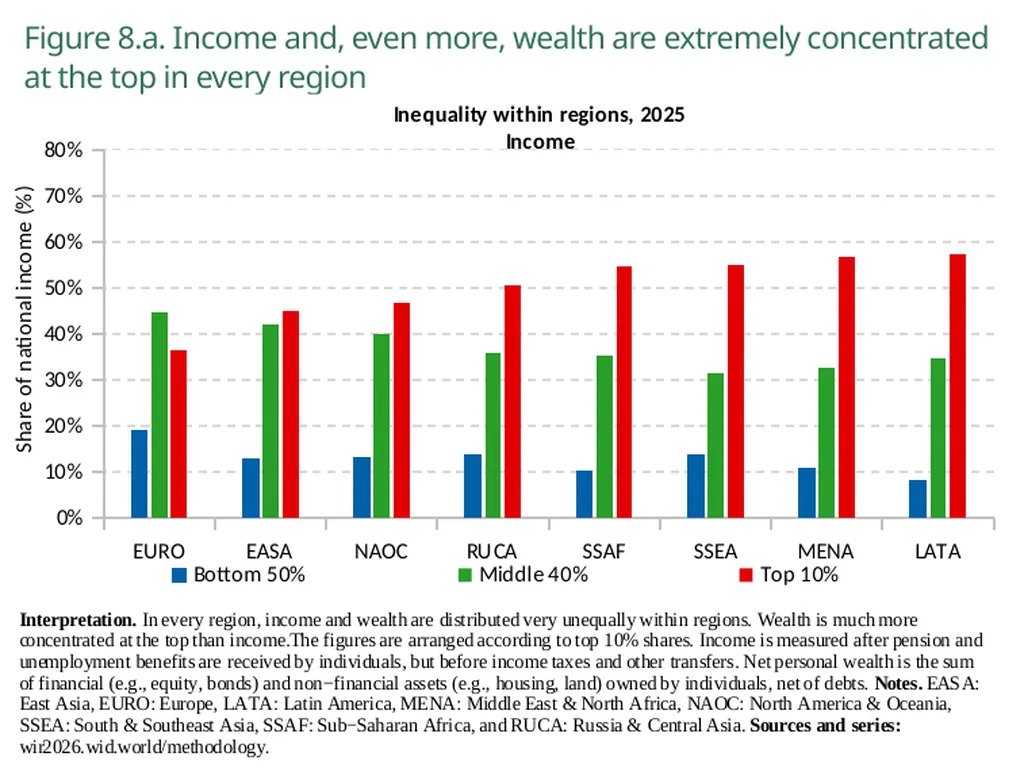
slide10. Figure 8.a. Income and, even more, wealth are extremely concentrated at the top in every region<br>
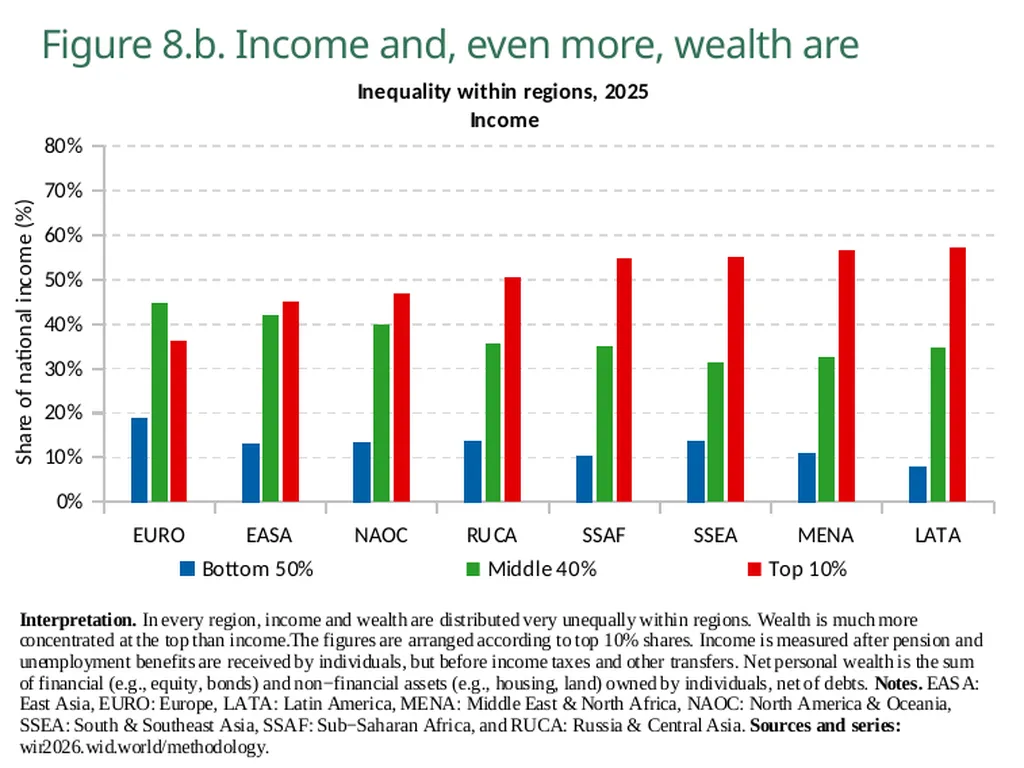
slide11. Figure 8.b. Income and, even more, wealth are extremely concentrated at the top in every region<br>
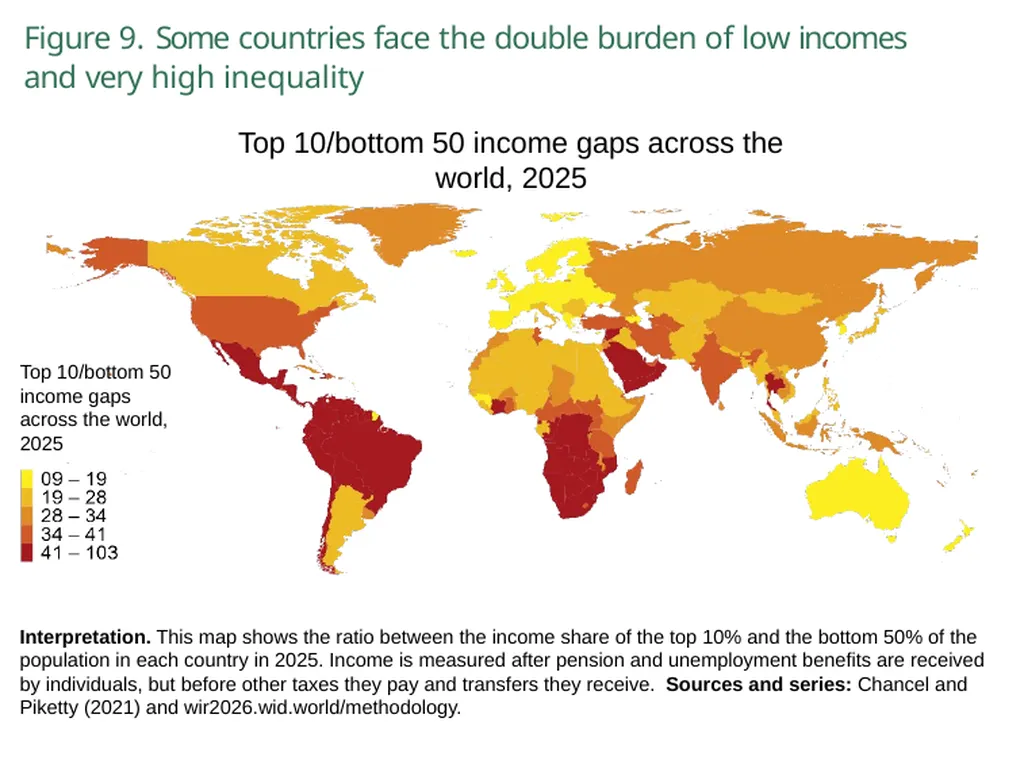
slide12. Figure 9. Some countries face the double burden of low incomes and very high inequality Top 10/bottom 50 income gaps across the world, 2025 Top 10/bottom 50 income gaps across the world, 2025 Interpretation. This map shows the ratio between the income share of the top 10% and the bottom 50% of the population in each country in 2025. Income is measured after pension and unemployment benefits are received by individuals, but before other taxes they pay and transfers they receive. Sources and series: Chancel and Piketty (2021) and wir2026.wid.world/methodology.<br>
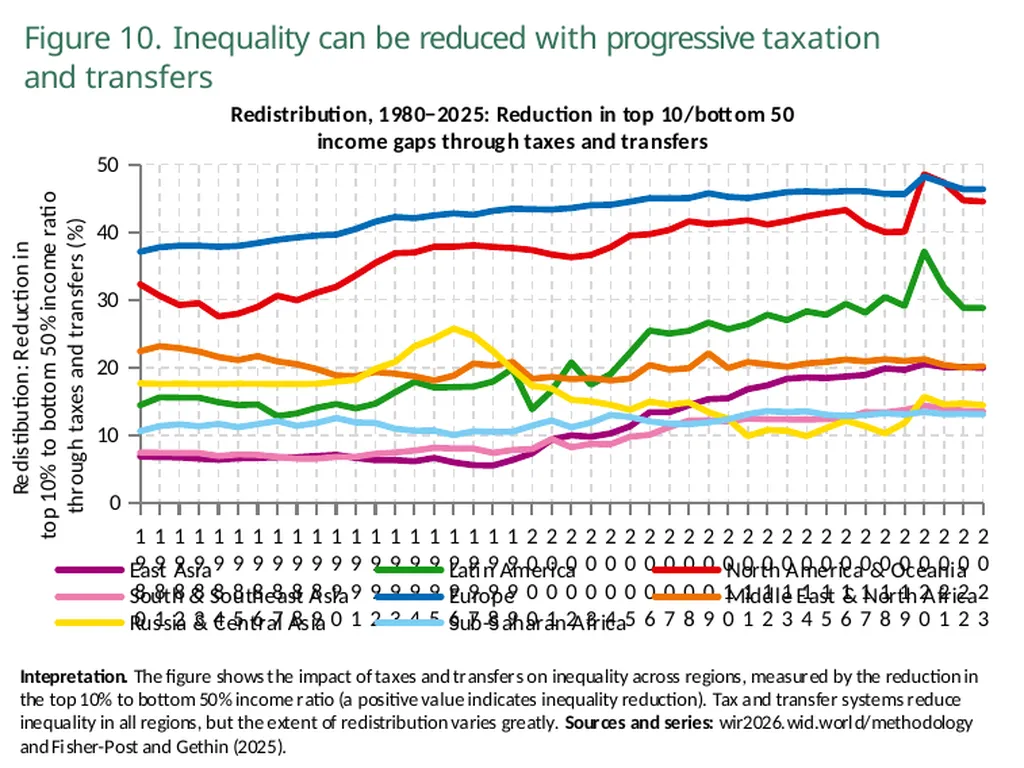
slide13. Figure 10. Inequality can be reduced with progressive taxation and transfers<br>
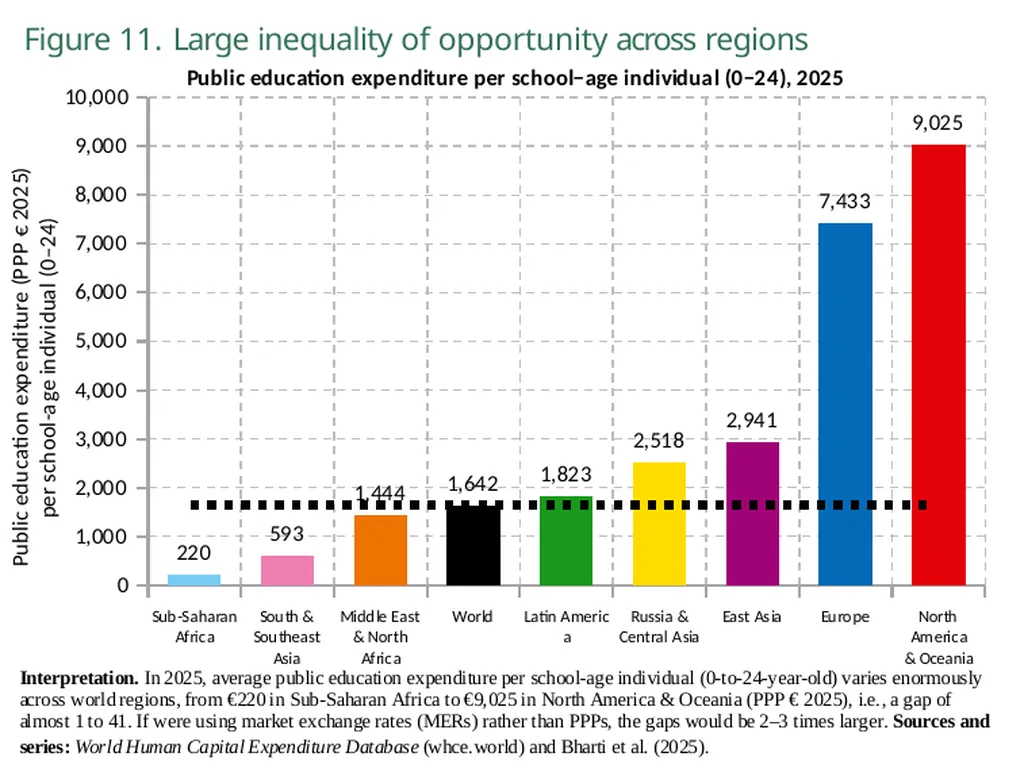
slide14. Figure 11. Large inequality of opportunity across regions<br>
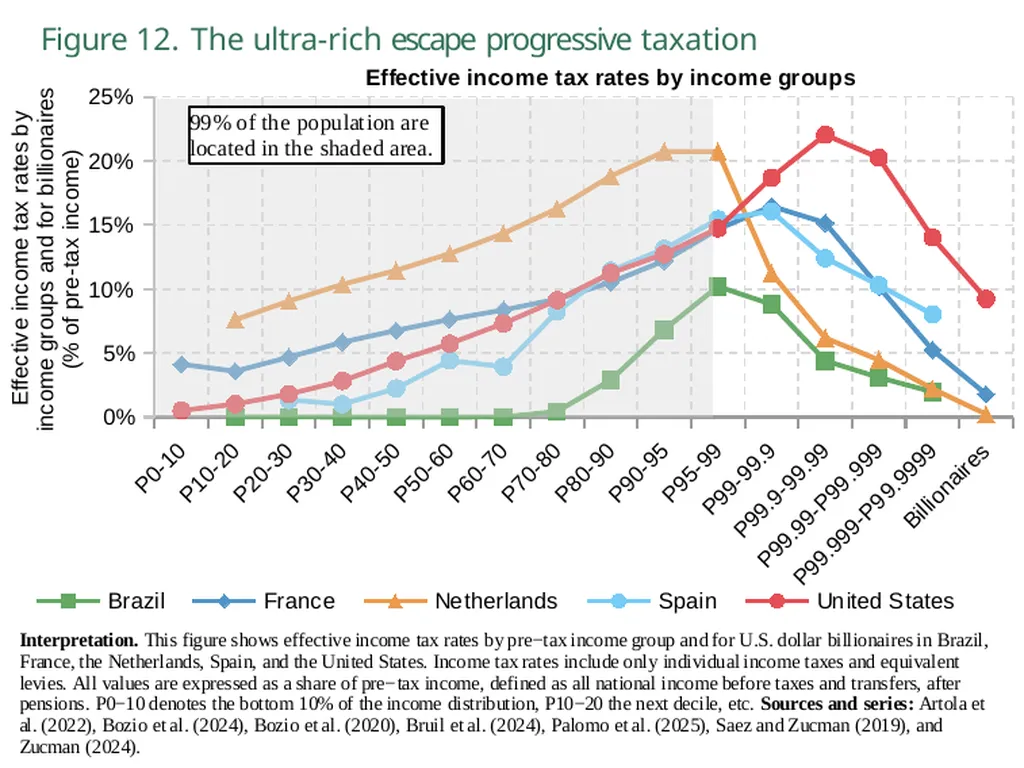
slide15. Figure 12. The ultra-rich escape progressive taxation<br>
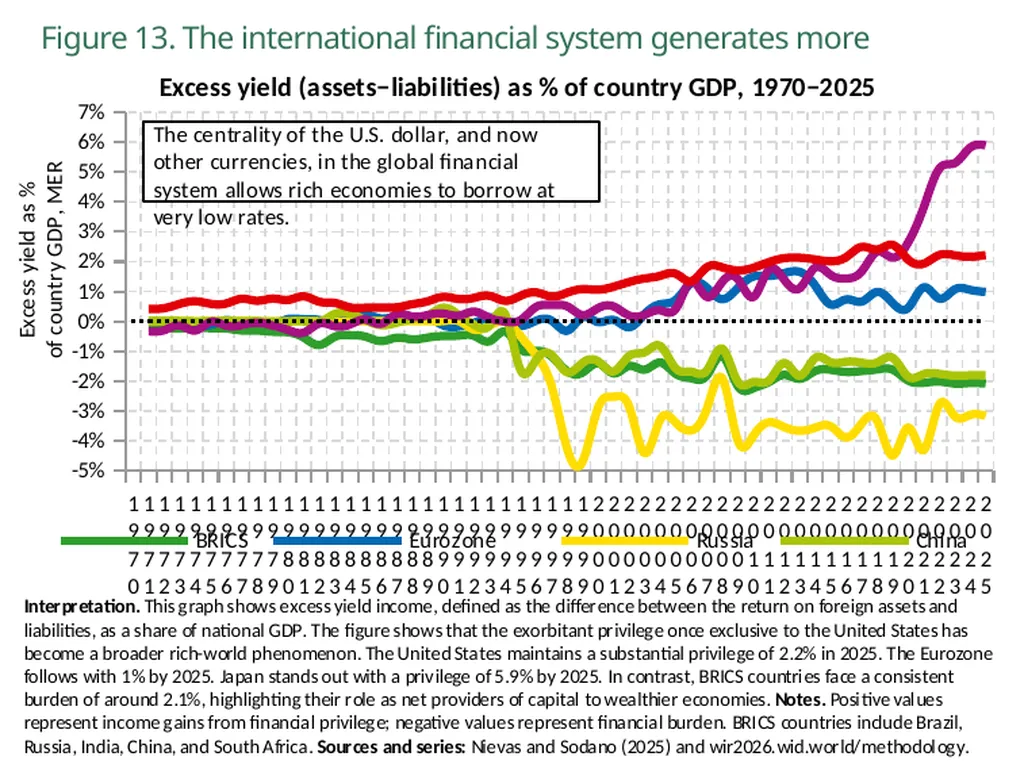
slide16. Figure 13. The international financial system generates more inequality<br>
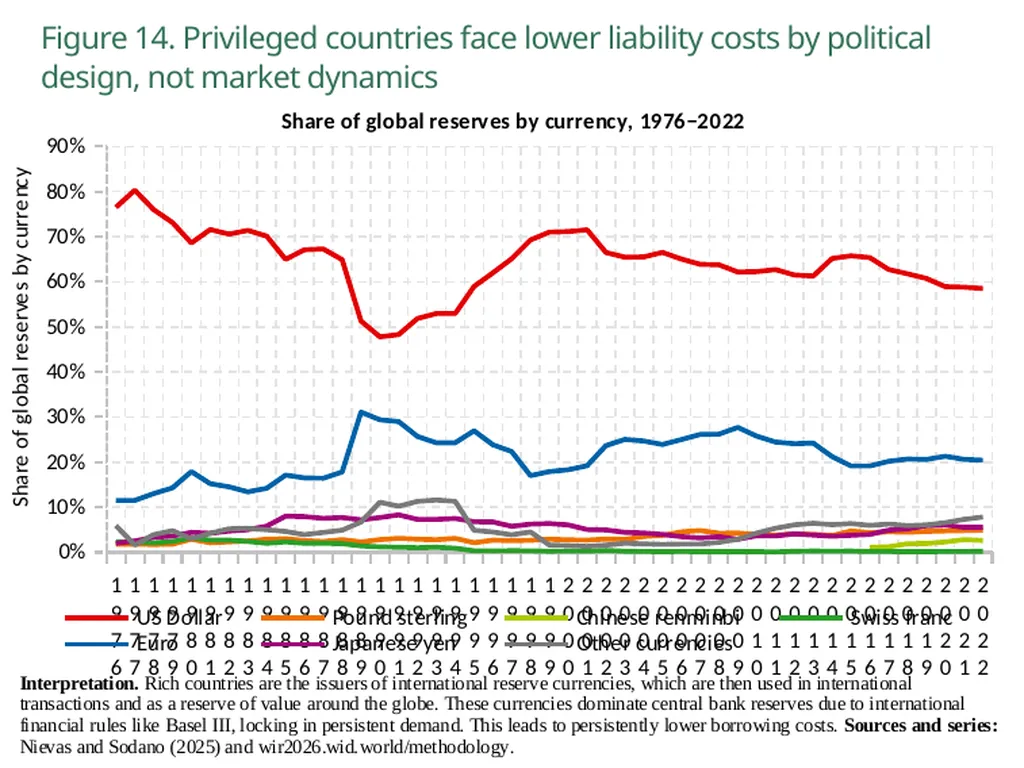
slide17. Figure 14. Privileged countries face lower liability costs by political design, not market dynamics<br>
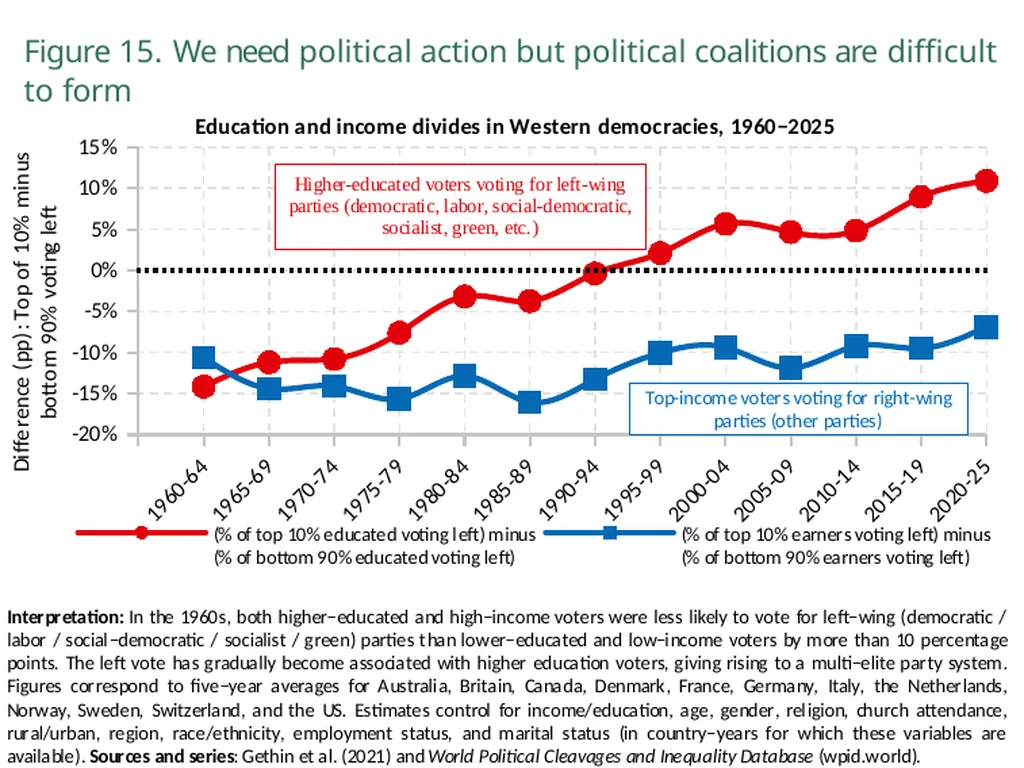
slide18. Figure 15. We need political action but political coalitions are difficult to form<br>
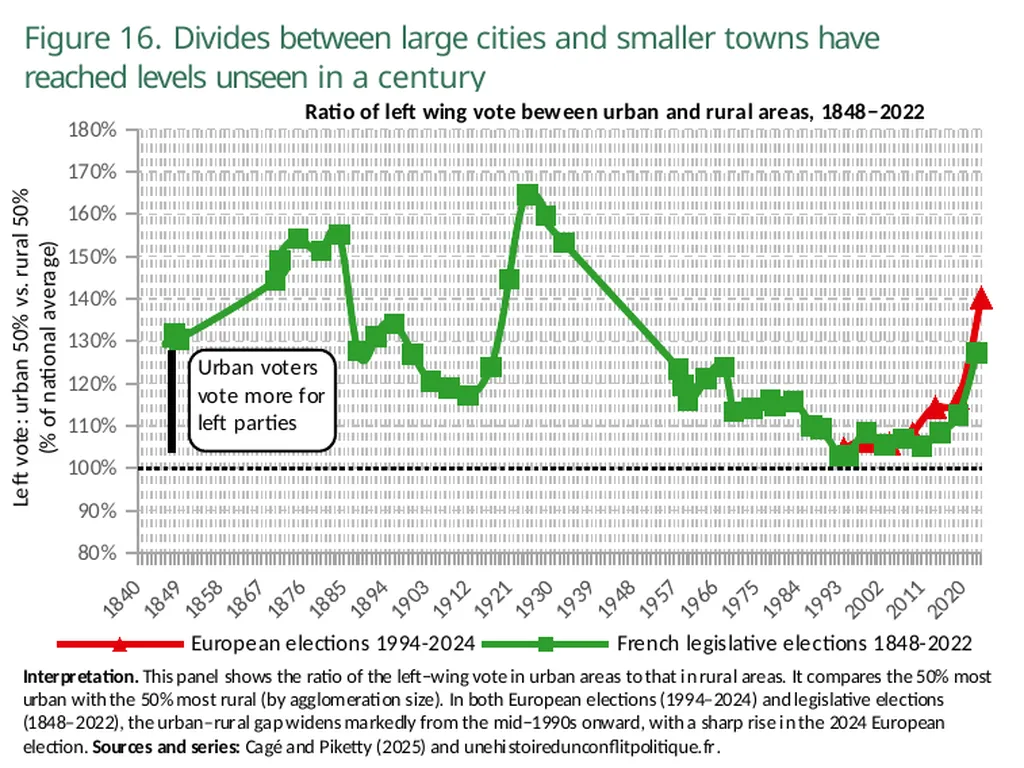
slide19. Figure 16. Divides between large cities and smaller towns have reached levels unseen in a century<br>
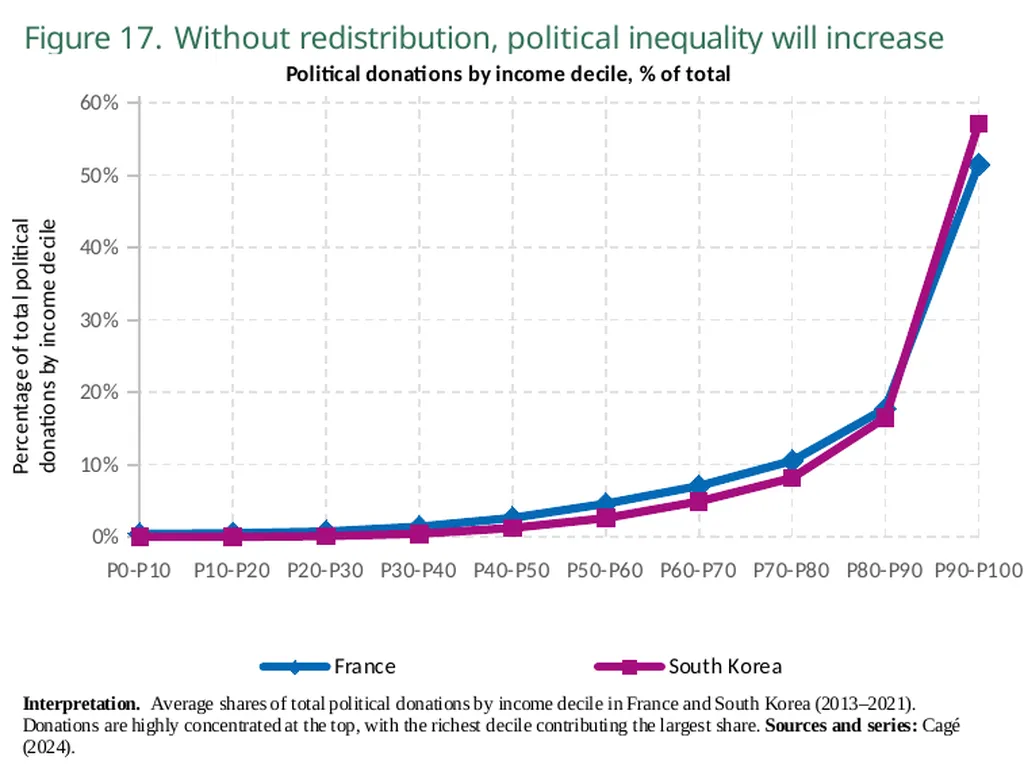
slide20. Figure 17. Without redistribution, political inequality will increase<br>
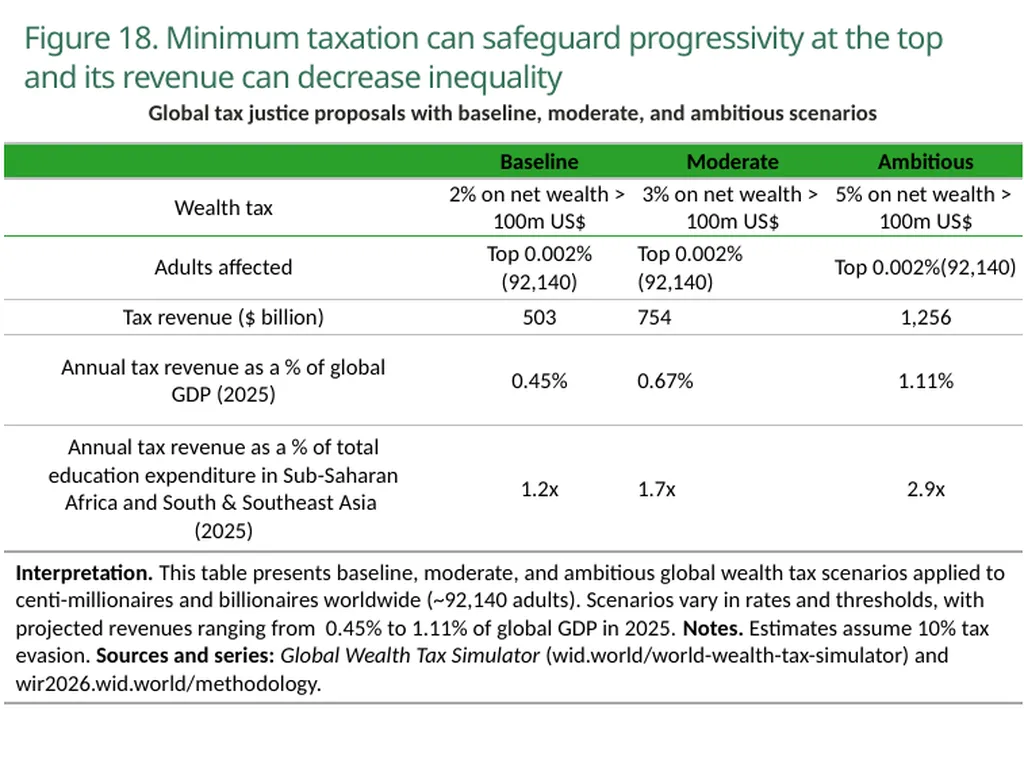
slide21. Figure 18. Minimum taxation can safeguard progressivity at the top and its revenue can decrease inequality<br>
Rowaida Moshrif, Thomas Piketty
10 Dec, 2025<br>
slide2. Figure 1. The world is extremely unequal<br>
slide3. Figure 2. Extreme wealth inequality is persistent and increasing<br>
slide4. Figure 3. Wealth has grown much more for the already extremely wealthy<br>
slide5. Figure 4. The wealthiest account for much more of global emissions<br>
slide6. Figure 5. Women persistently receive lower labor income than men everywhere<br>
slide7. Figure 6.a. After including domestic labor, women earn only 32% of men’s hourly income<br>
slide8. Figure 6.b. After including domestic labor, women earn only 32% of men’s hourly income<br>
slide9. Figure 7. Inequality between regions is also immense<br>
slide10. Figure 8.a. Income and, even more, wealth are extremely concentrated at the top in every region<br>
slide11. Figure 8.b. Income and, even more, wealth are extremely concentrated at the top in every region<br>
slide12. Figure 9. Some countries face the double burden of low incomes and very high inequality Top 10/bottom 50 income gaps across the world, 2025 Top 10/bottom 50 income gaps across the world, 2025 Interpretation. This map shows the ratio between the income share of the top 10% and the bottom 50% of the population in each country in 2025. Income is measured after pension and unemployment benefits are received by individuals, but before other taxes they pay and transfers they receive. Sources and series: Chancel and Piketty (2021) and wir2026.wid.world/methodology.<br>
slide13. Figure 10. Inequality can be reduced with progressive taxation and transfers<br>
slide14. Figure 11. Large inequality of opportunity across regions<br>
slide15. Figure 12. The ultra-rich escape progressive taxation<br>
slide16. Figure 13. The international financial system generates more inequality<br>
slide17. Figure 14. Privileged countries face lower liability costs by political design, not market dynamics<br>
slide18. Figure 15. We need political action but political coalitions are difficult to form<br>
slide19. Figure 16. Divides between large cities and smaller towns have reached levels unseen in a century<br>
slide20. Figure 17. Without redistribution, political inequality will increase<br>
slide21. Figure 18. Minimum taxation can safeguard progressivity at the top and its revenue can decrease inequality<br>