www. pas.gov.uk The Direct Financial Implications
Description: www. pas.gov.uk The Direct Financial Implications of Planning CIL Knowledge Introduction Long term Strategic Planning Carefully calculated needs assessments Business Cases Options appraisal Building political consensus Delivery routes
Related Topics
Download Presentation
"www. pas.gov.uk The Direct Financial Implications" is the property of its rightful owner. Permission is granted to download and print the materials on this website for personal, non-commercial use only, and to display it on your personal computer provided you do not modify the materials and that you retain all copyright notices contained in the materials. By downloading content from our website, you accept the terms of this agreement.
Presentation Transcript
slide1. www. pas.gov.uk The Direct Financial Implications of Planning
CIL Knowledge<br>
slide2. Introduction<br>
slide3. Long term Strategic Planning
Carefully calculated needs assessments
Business Cases
Options appraisal
Building political consensus
Delivery routes
Working with private providers 2. Opportunism &<br>
slide6. THE COMMUNITY INFRASTRUCTURE LEVY<br>
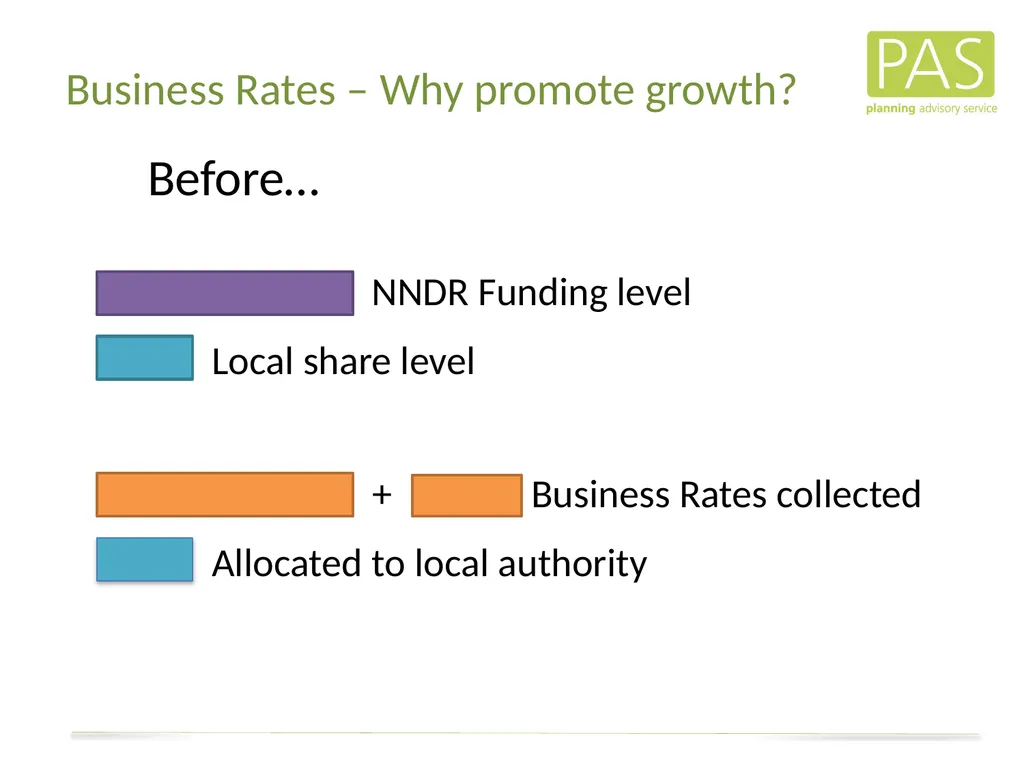
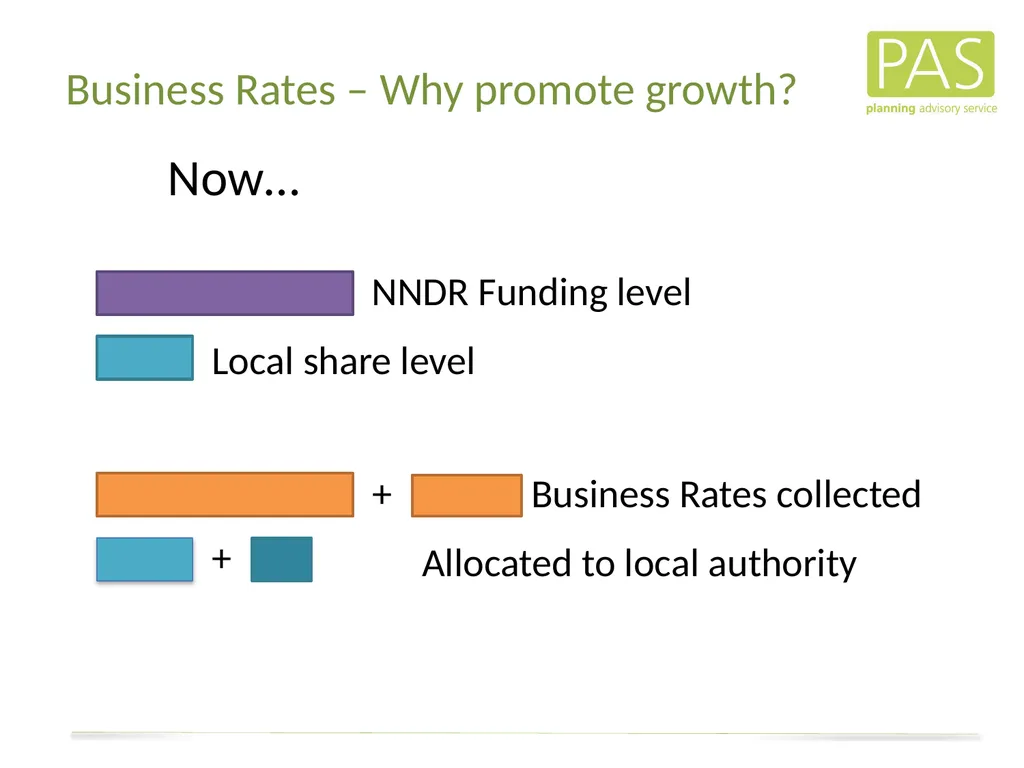
slide8. Business Rates collected + Business Rates – Why promote growth? Before… NNDR Funding level Local share level Allocated to local authority<br>
slide9. Business Rates collected + Business Rates – Why promote growth? Now… NNDR Funding level Local share level Allocated to local authority +<br>
slide11. How to Model the Financial Benefits of Planning & Growth<br>
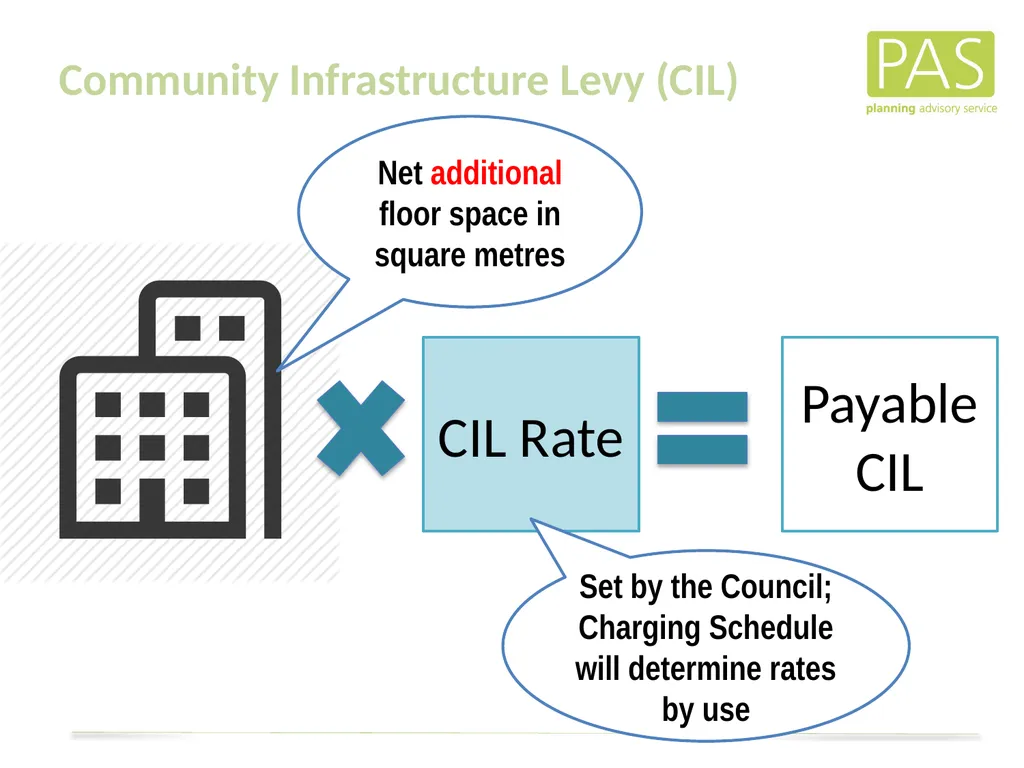
slide12. Community Infrastructure Levy (CIL) Net additional floor space in square metres CIL Rate Set by the Council; Charging Schedule will determine rates by use Payable CIL<br>
slide13. 3 key points to remember:
CIL is a one-off payment, payable by the developer at the beginning of a development (following planning permission).
Replacement floor space & affordable housing do not pay CIL.
Planning obligations cannot be collected to pay for items in the Reg 123 list Community Infrastructure Levy<br>
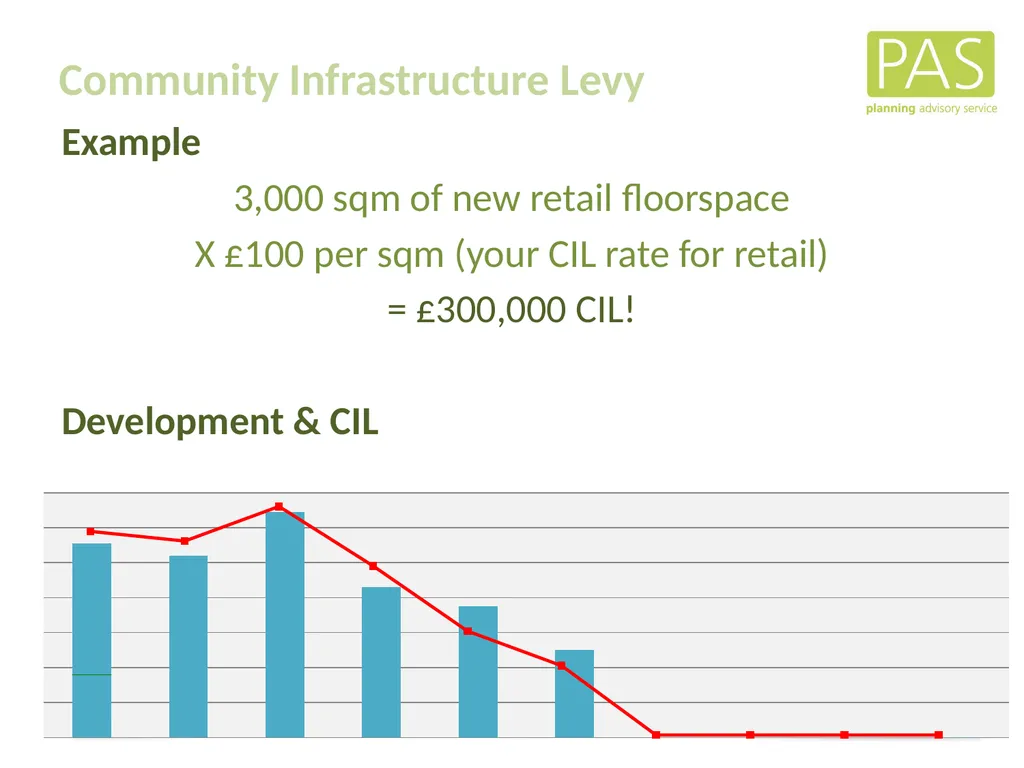
slide14. Example
3,000 sqm of new retail floorspace
X £100 per sqm (your CIL rate for retail)
= £300,000 CIL!
Development & CIL Community Infrastructure Levy<br>
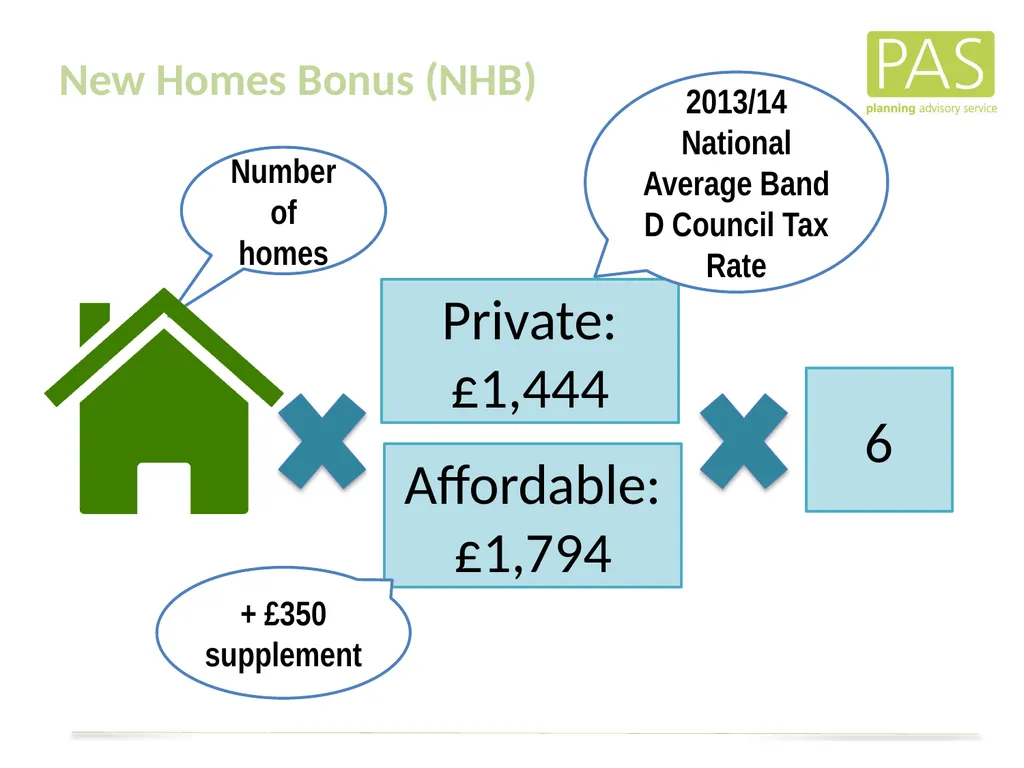
slide15. New Homes Bonus (NHB) Number of homes Private:£1,444 2013/14 National Average Band D Council Tax Rate Affordable:£1,794 + £350 supplement 6<br>
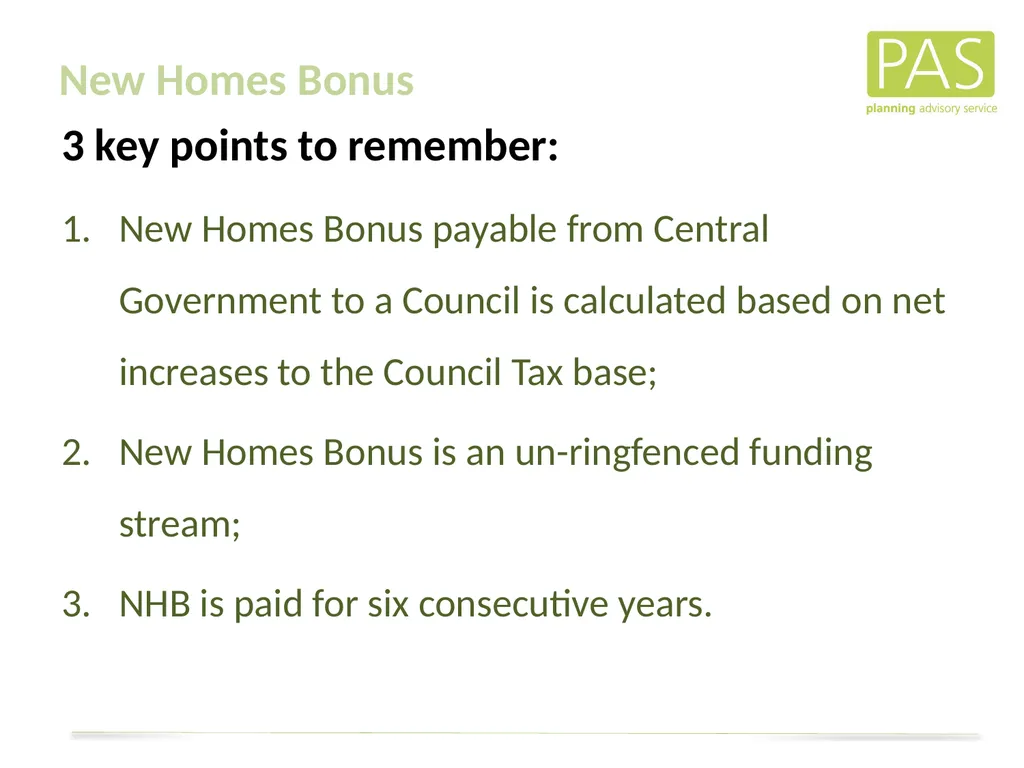
slide16. 3 key points to remember:
New Homes Bonus payable from Central Government to a Council is calculated based on net increases to the Council Tax base;
New Homes Bonus is an un-ringfenced funding stream;
NHB is paid for six consecutive years. New Homes Bonus<br>
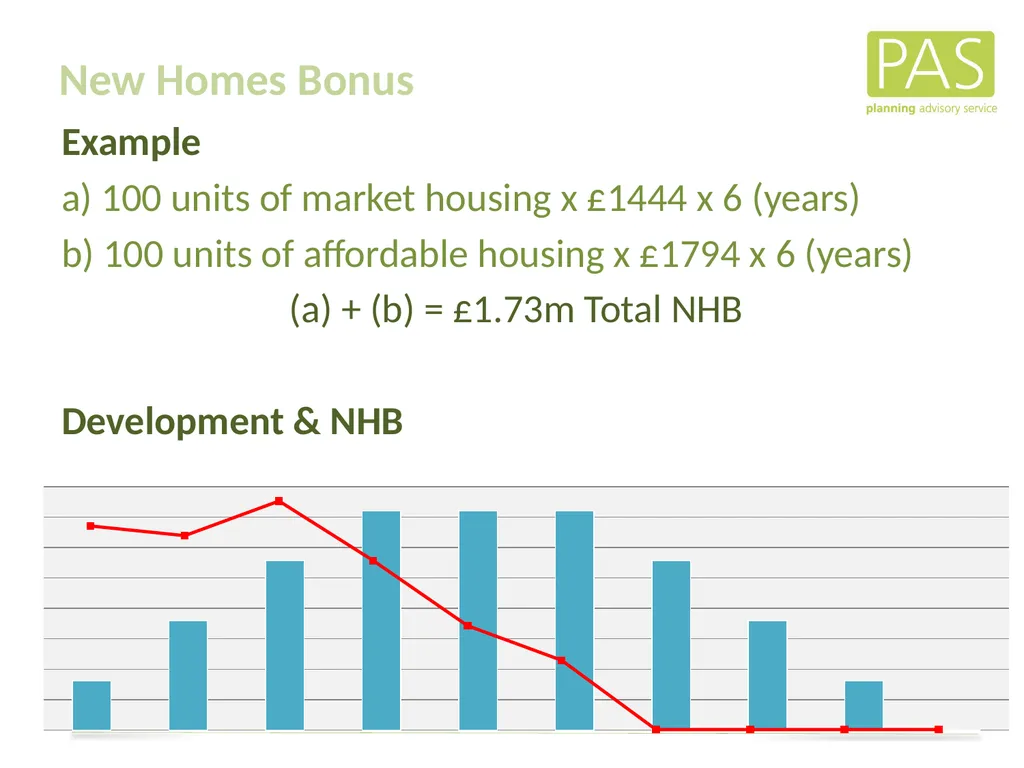
slide17. Example
a) 100 units of market housing x £1444 x 6 (years)
b) 100 units of affordable housing x £1794 x 6 (years)
(a) + (b) = £1.73m Total NHB
Development & NHB New Homes Bonus<br>
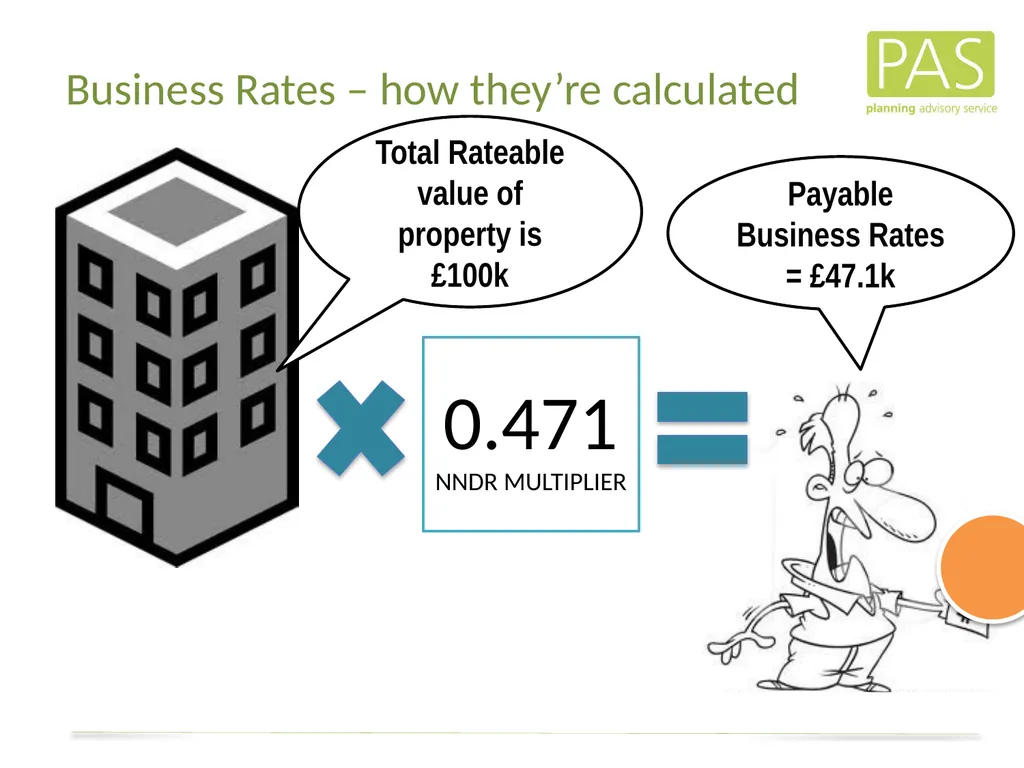
slide18. Business Rates – how they’re calculated Total Rateable value of property is £100k 0.471
NNDR MULTIPLIER Payable Business Rates = £47.1k<br>
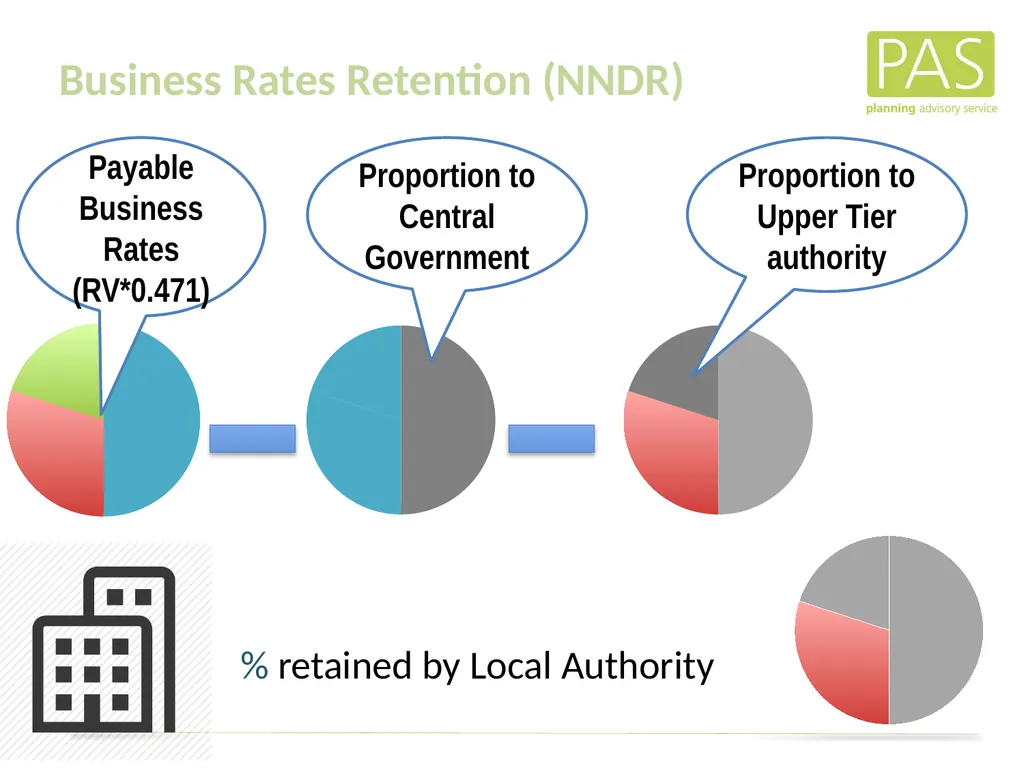
slide19. Business Rates Retention (NNDR) Proportion to Central Government Payable Business Rates (RV*0.471) Proportion to Upper Tier authority % retained by Local Authority<br>
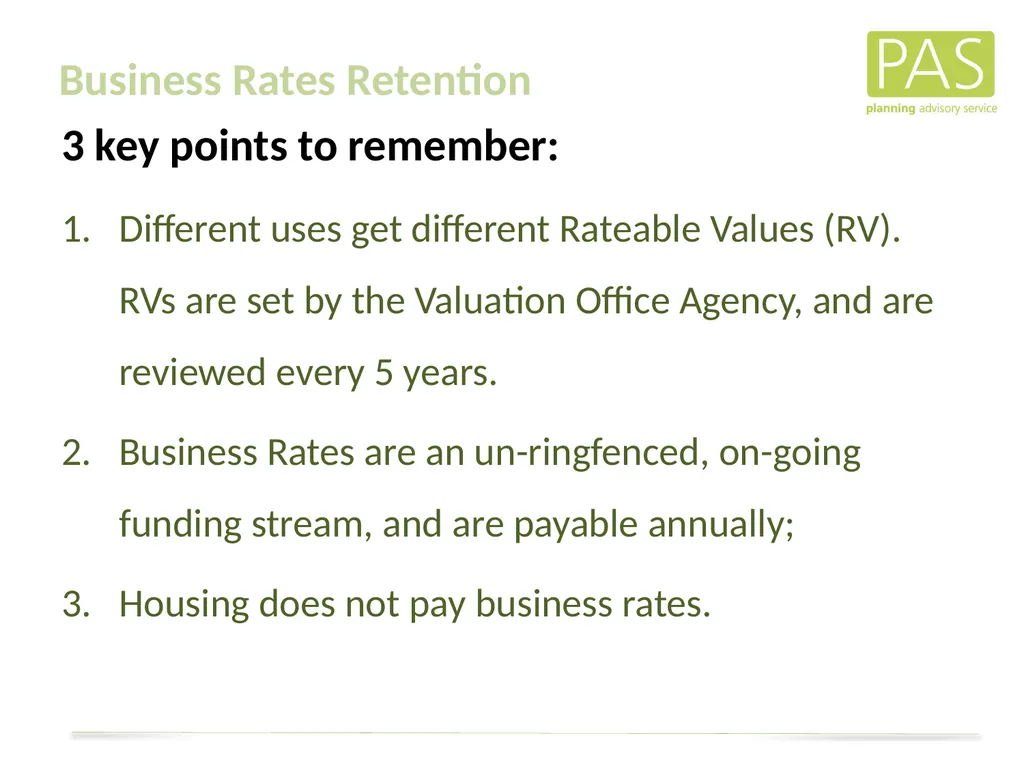
slide20. 3 key points to remember:
Different uses get different Rateable Values (RV). RVs are set by the Valuation Office Agency, and are reviewed every 5 years.
Business Rates are an un-ringfenced, on-going funding stream, and are payable annually;
Housing does not pay business rates. Business Rates Retention<br>
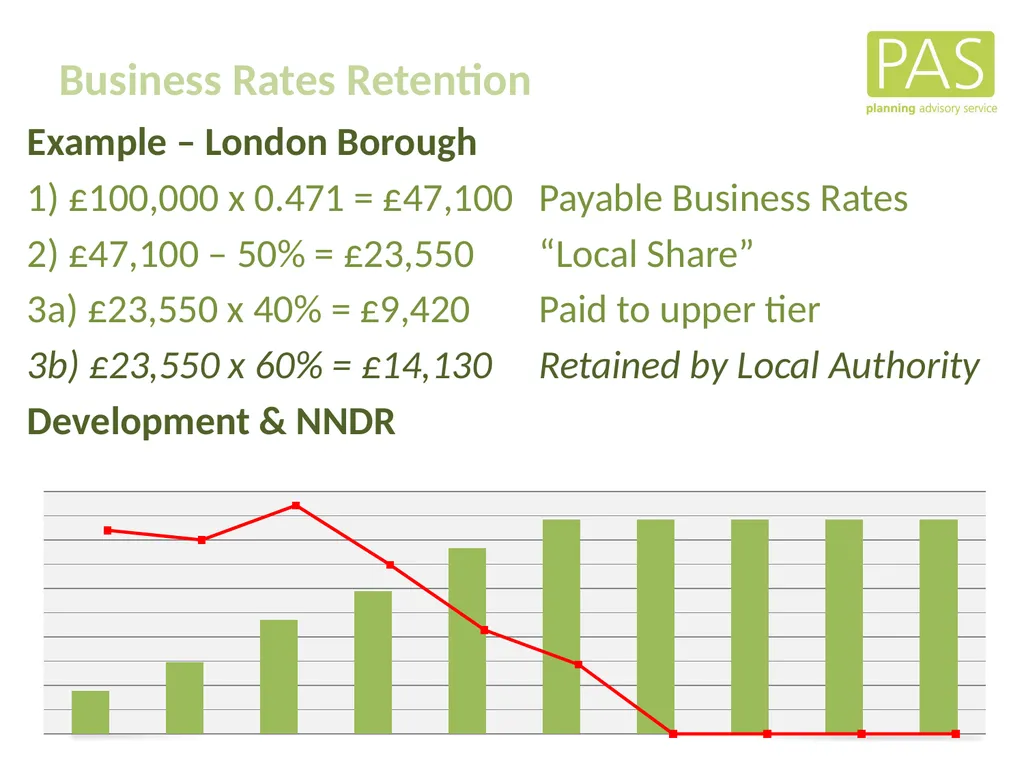
slide21. Example – London Borough
1) £100,000 x 0.471 = £47,100 Payable Business Rates
2) £47,100 – 50% = £23,550 “Local Share”
3a) £23,550 x 40% = £9,420 Paid to upper tier
3b) £23,550 x 60% = £14,130 Retained by Local Authority
Development & NNDR Business Rates Retention<br>
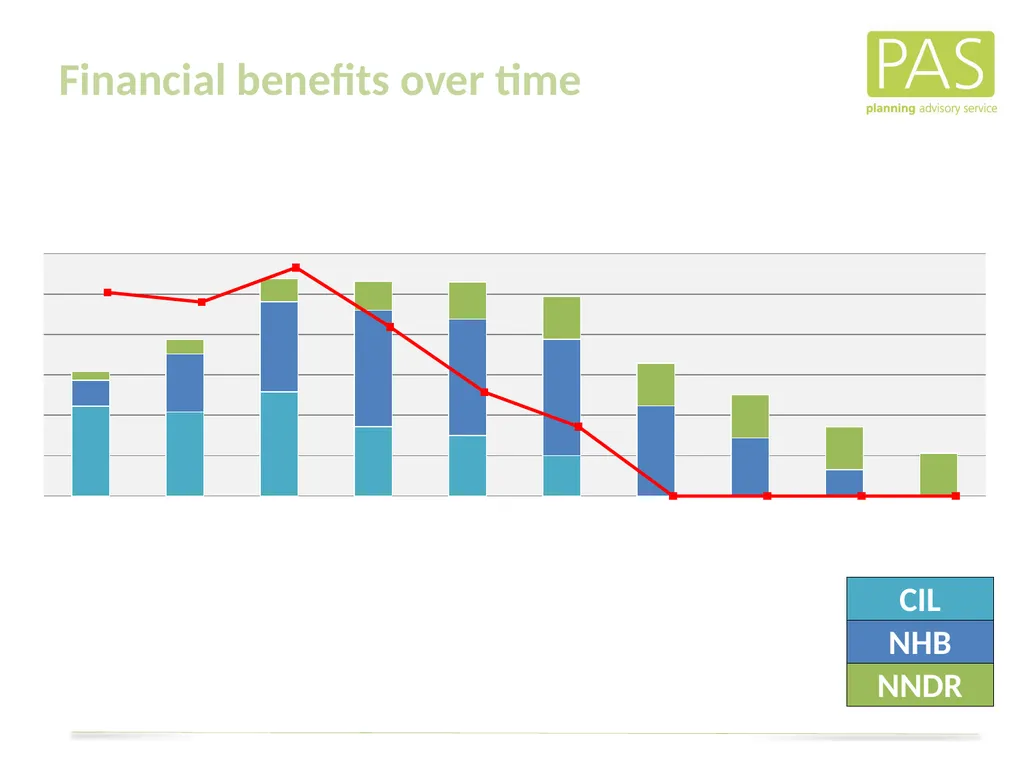
slide22. Financial benefits over time<br>
slide23. Finance as a Material Consideration in Planning Decision<br>
slide24. e.g.
Plan policies
Previous appeal decisions
Case law
Loss of sunlight / overshadowing
Capacity of physical infrastructure What is a Material Consideration<br>
slide25. When should a ‘local finance consideration’ be taken into account as a material planning consideration?
Whether or not a ‘local finance consideration’ is material to a particular decision will depend on whether it could help to make the development acceptable in planning terms.<br>
slide26. Example 1 City in South West UK
Master Plan Delivery Programming<br>
slide27. Ten strategic sites; unviable without intervention
Future prospects of main city as regional growth centre under threat
Outlying housing sites capable of subsidising city
Needed to understand medium to long term planning and financial options The Scenario<br>
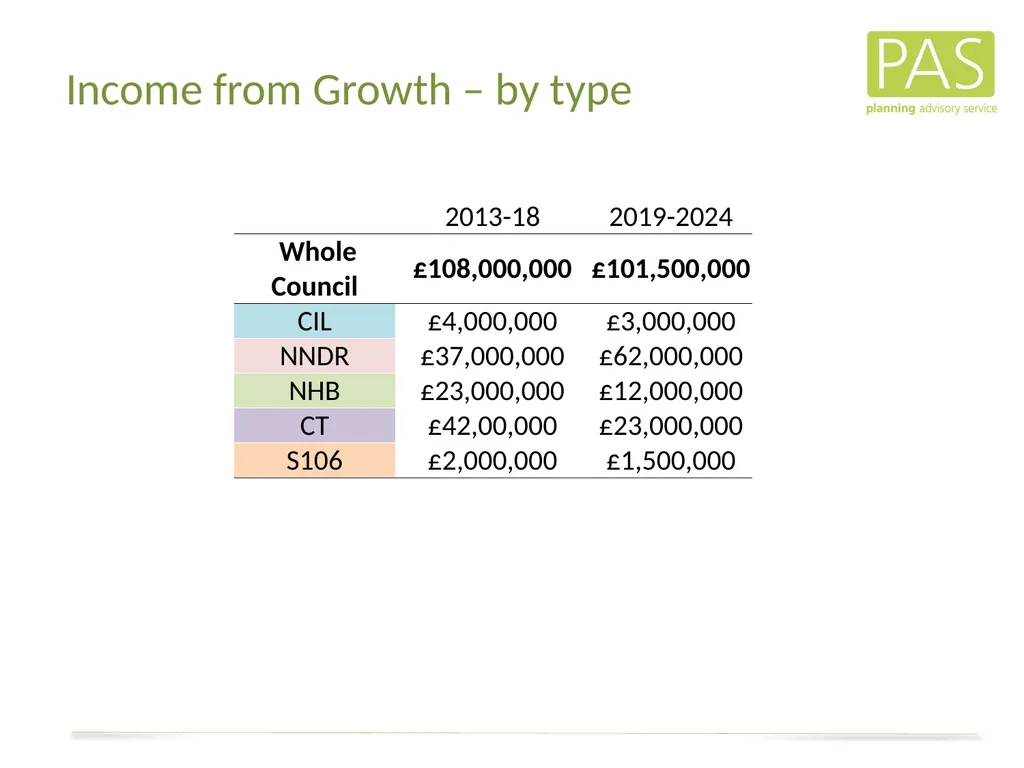
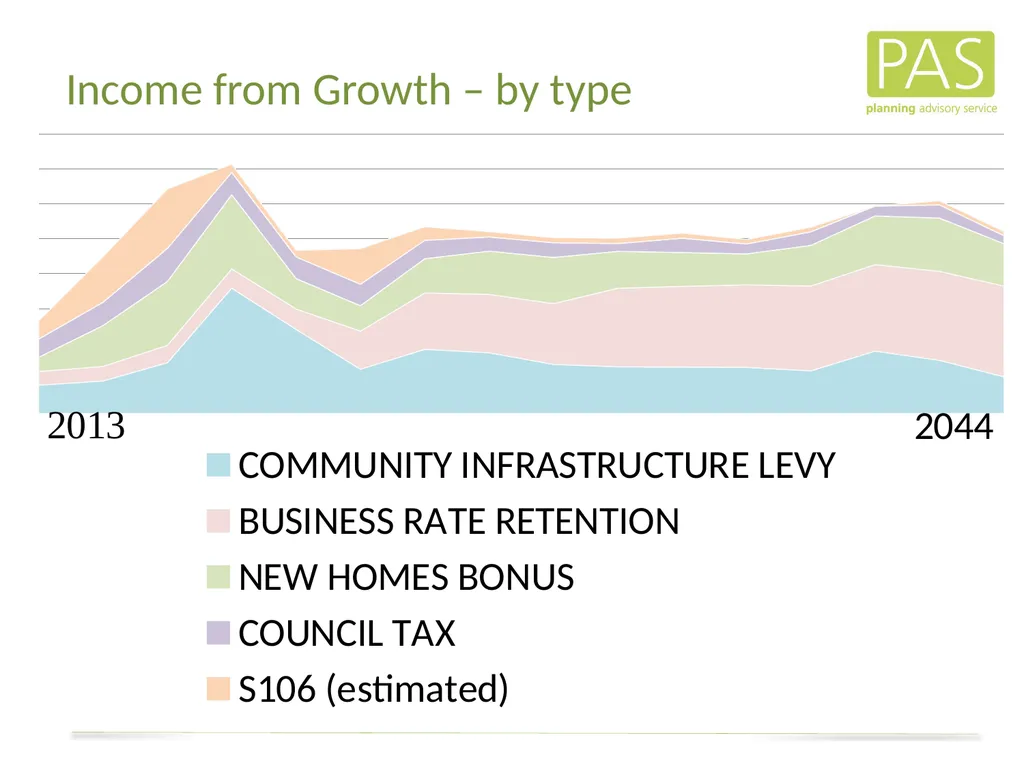
slide28. Income from Growth – by type<br>
slide29. Clear understanding of cash flow
Informed decisions on release of assets
Use of asset receipts to ease cash flow
Influenced CIL rate setting
Informed successful funding applications The Implications<br>
slide30. Example 2 Local Authority in Urban Growth Area 1:
Strategic Infrastructure Investment<br>
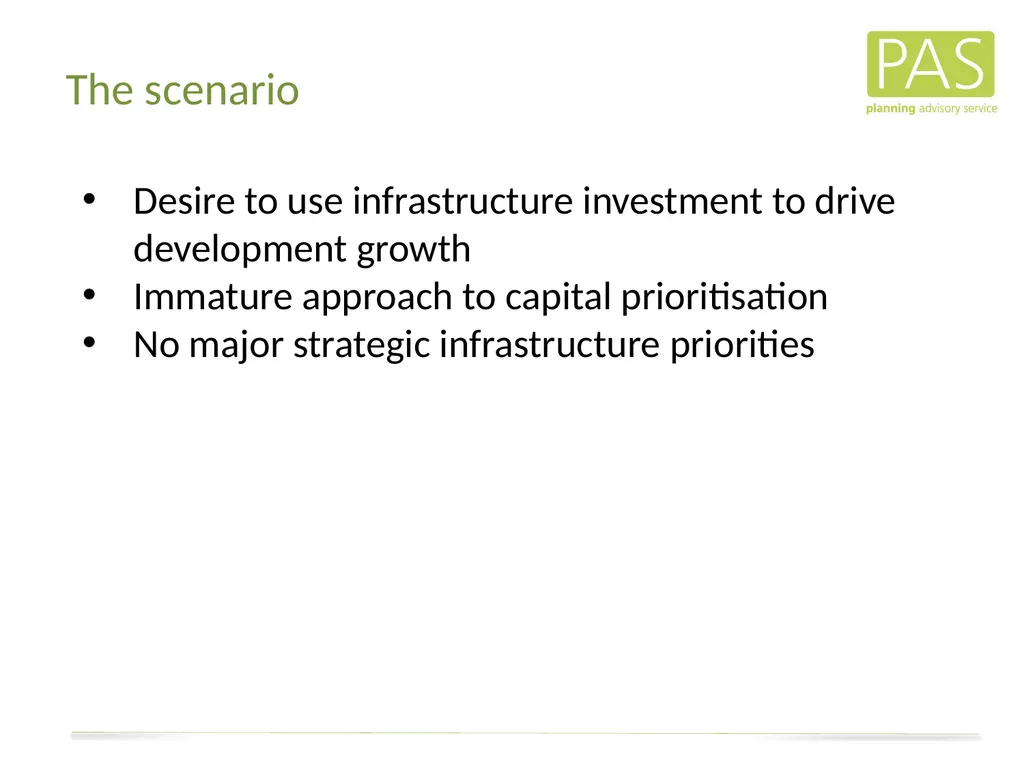
slide31. Desire to use infrastructure investment to drive development growth
Immature approach to capital prioritisation
No major strategic infrastructure priorities The scenario<br>
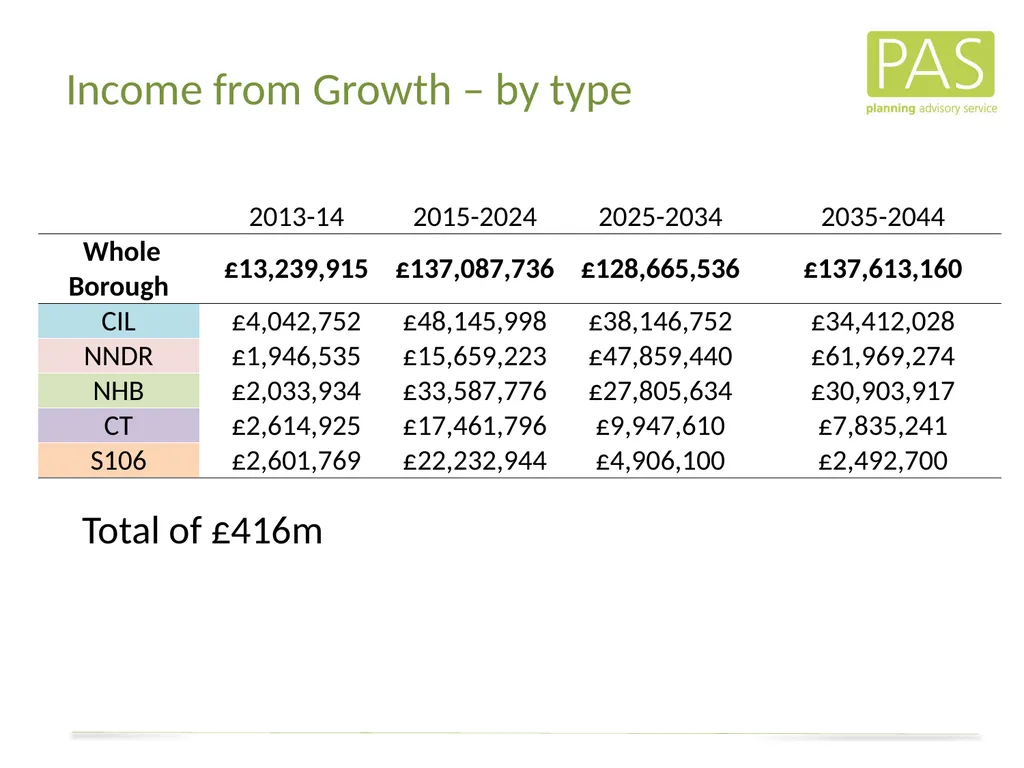
slide32. Income from Growth – by type Total of £416m<br>
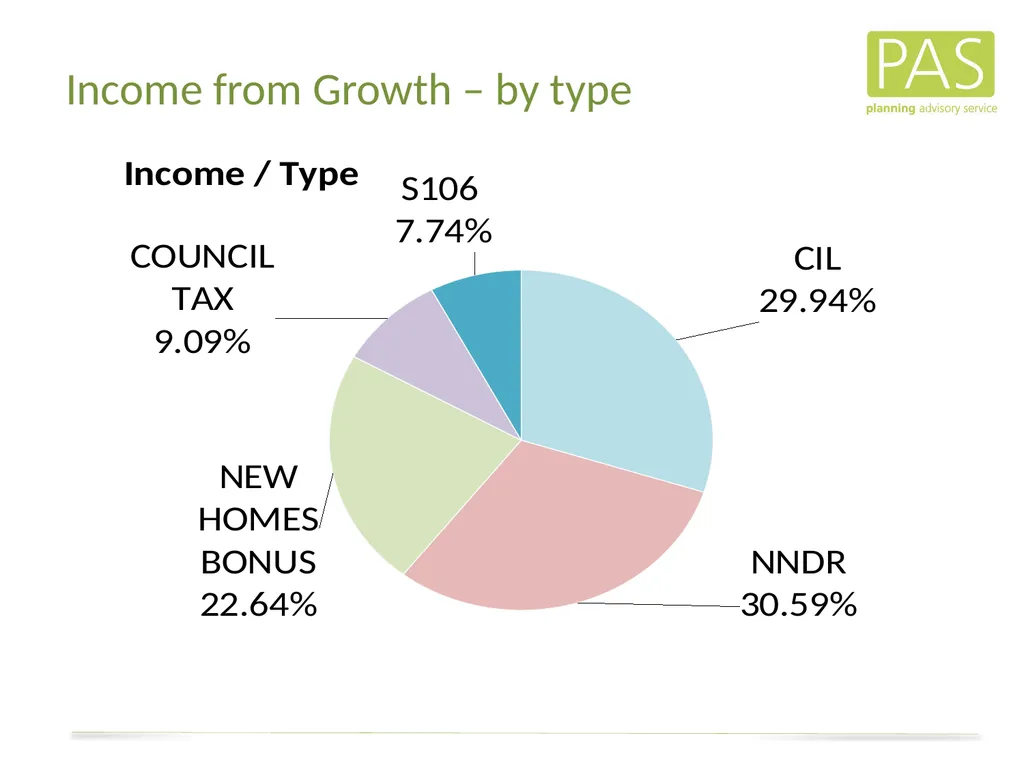
slide33. Income from Growth – by type<br>
slide34. Income from Growth – by type<br>
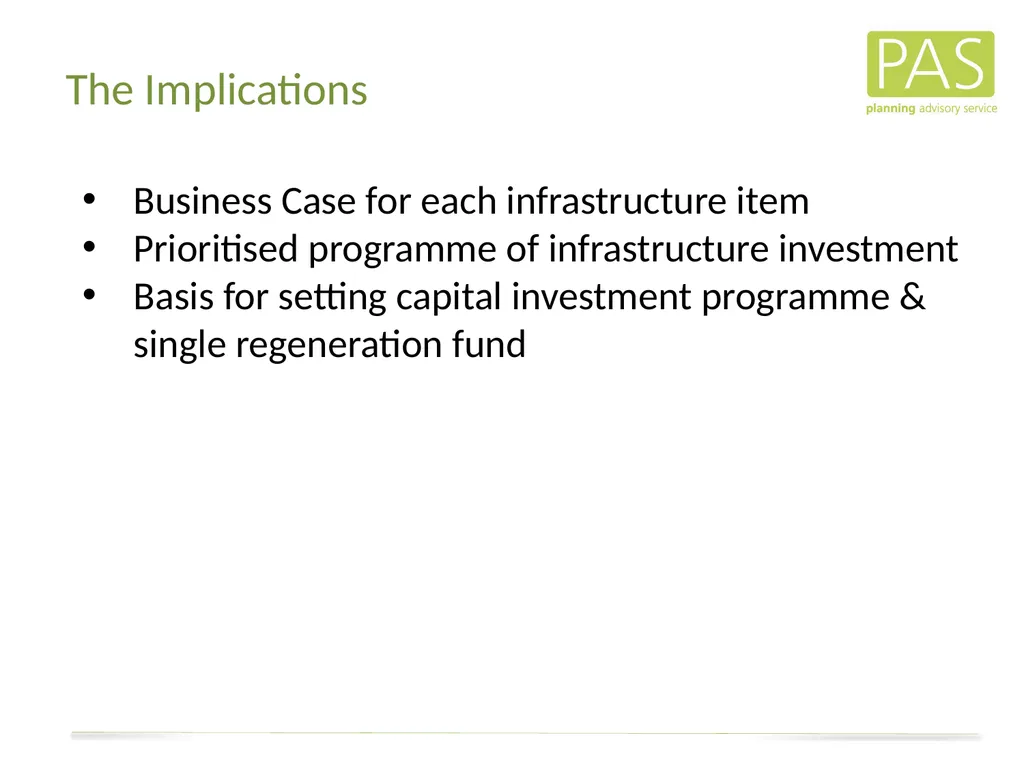
slide35. Business Case for each infrastructure item
Prioritised programme of infrastructure investment
Basis for setting capital investment programme & single regeneration fund The Implications<br>
slide36. Example 3 Urban Growth Area 2
Medium Term Financial Planning<br>
slide37. 8 major regeneration areas
In process of major outsourcing
Information sought to inform infrastructure investment priorities The scenario<br>
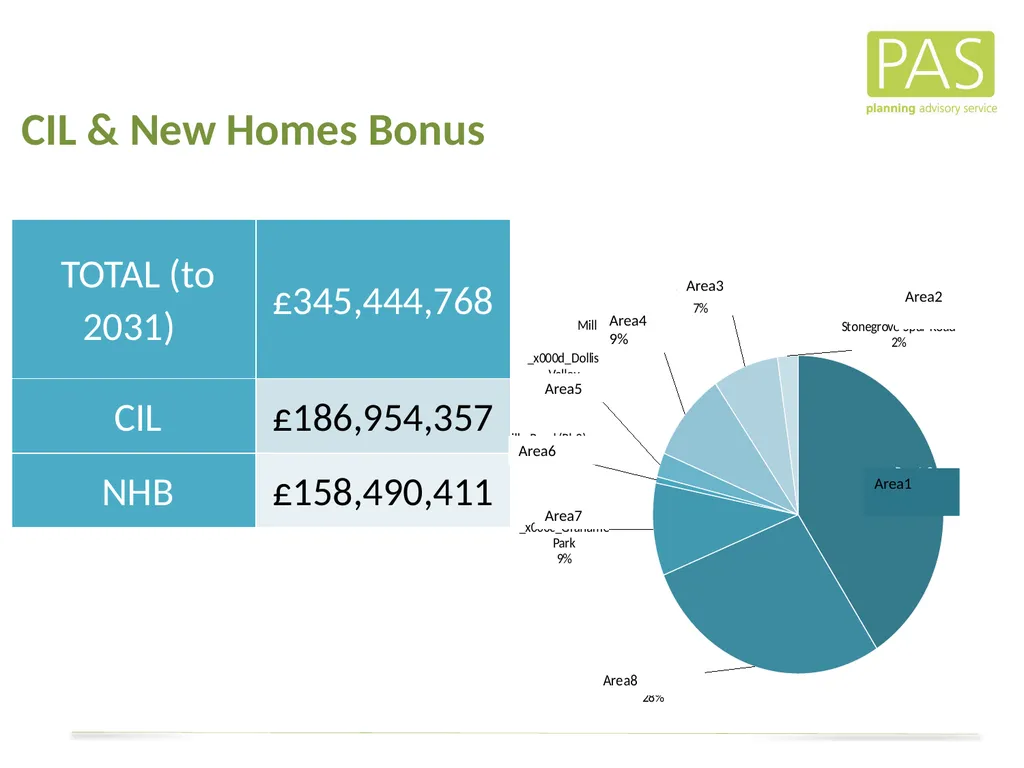
slide38. CIL & New Homes Bonus Area4 9% Area3 Area2 Area7 Area6 Area5 Area1<br>
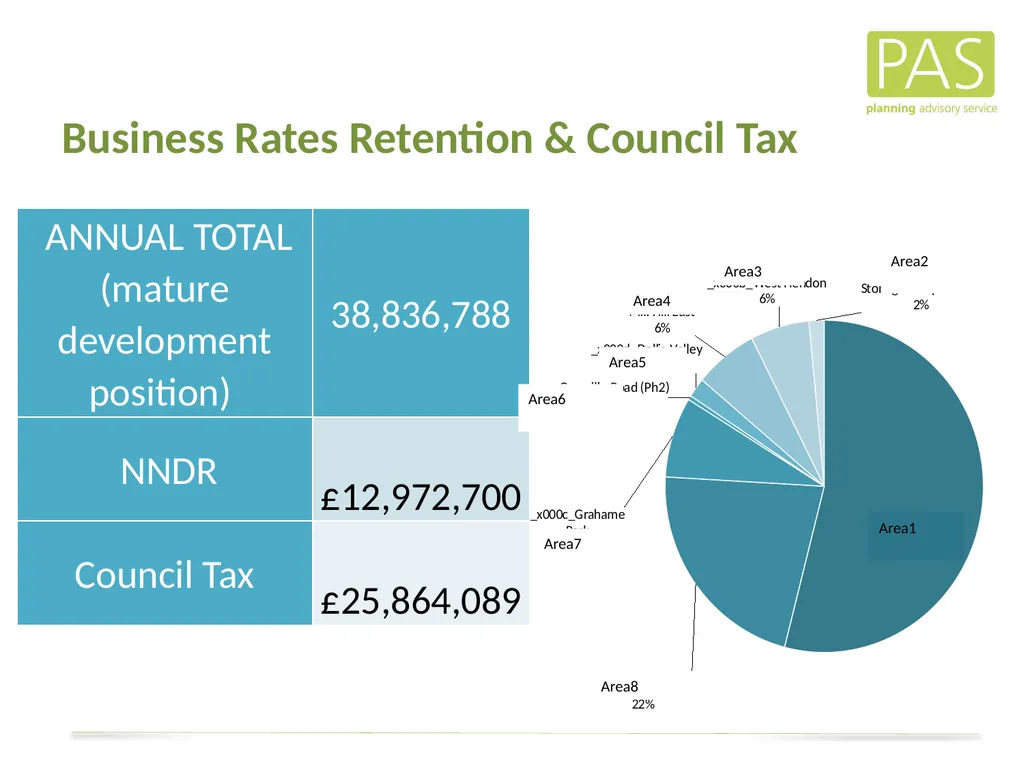
slide39. Business Rates Retention & Council Tax Area4 Area3 Area2 Area5 Area7 Area6 Area1 Area8<br>
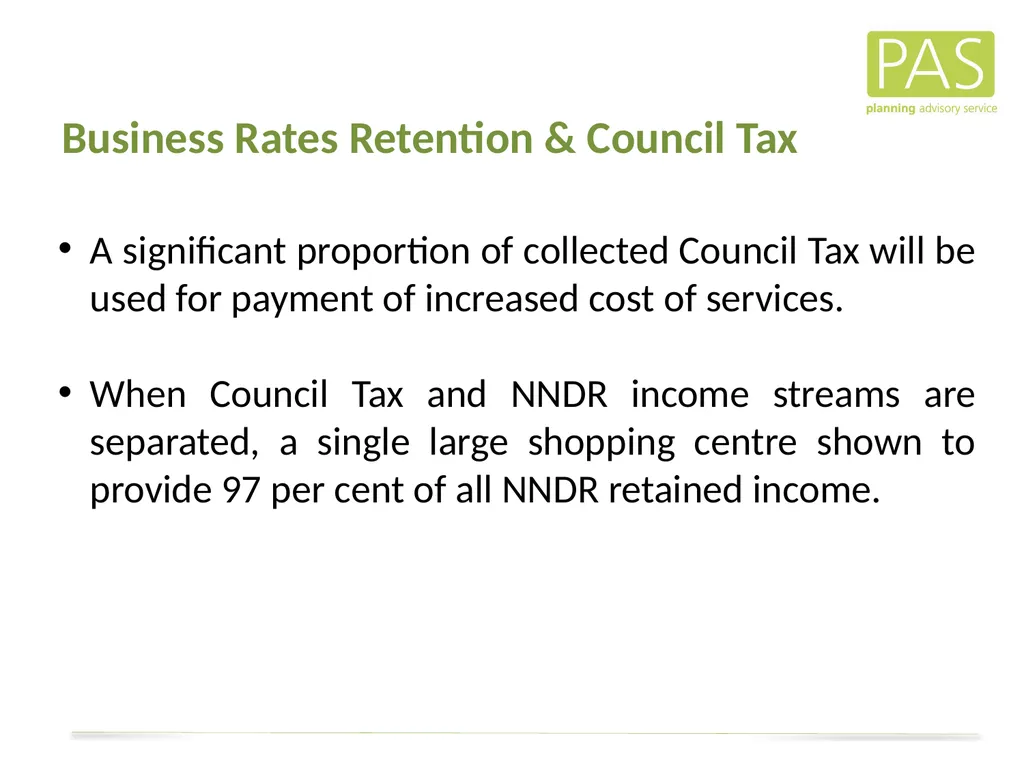
slide40. A significant proportion of collected Council Tax will be used for payment of increased cost of services.
When Council Tax and NNDR income streams are separated, a single large shopping centre shown to provide 97 per cent of all NNDR retained income. Business Rates Retention & Council Tax<br>
slide41. Informed a departmental outsourcing deal
Informed negotiations with Government on major infrastructure investment
Re-prioritised housing estate investment programme The Implications<br>
slide42. Example 4 Local Authority in Urban Growth Area 3
Informing Public Sector Interventions<br>
slide43. Site-specific assessments
Detailed assessment of ROI from any site-specific interventions, including the cashable impact on wider public financing and regeneration
Site residual valuations
public finance sources, such as NHB, CIL, Business Rate Retention, etc?
implementation planning
Where, when and how is Council intervention likely to have the biggest impact? The Approach<br>
slide44. Site Selection
Probability of development
History of planning applications
Cost of intervention
Delivery/site constraints and issues, such as land ownership, existing lease arrangements, etc.
Impacts - blight effect on town centre
Potential to have windfall benefits from adjacent development, i.e. gateway site
Potential regeneration impact
Financial return on investment from intervention SITE FOR INTERVENTION FINDINGS<br>
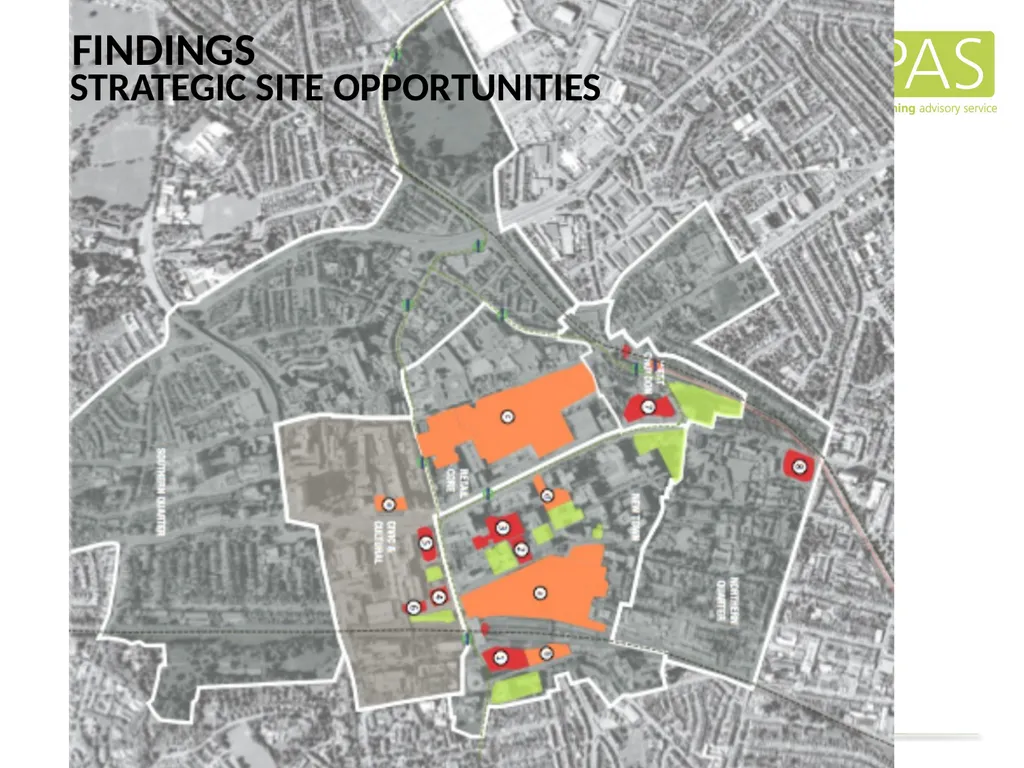
slide45. FINDINGS STRATEGIC SITE OPPORTUNITIES<br>
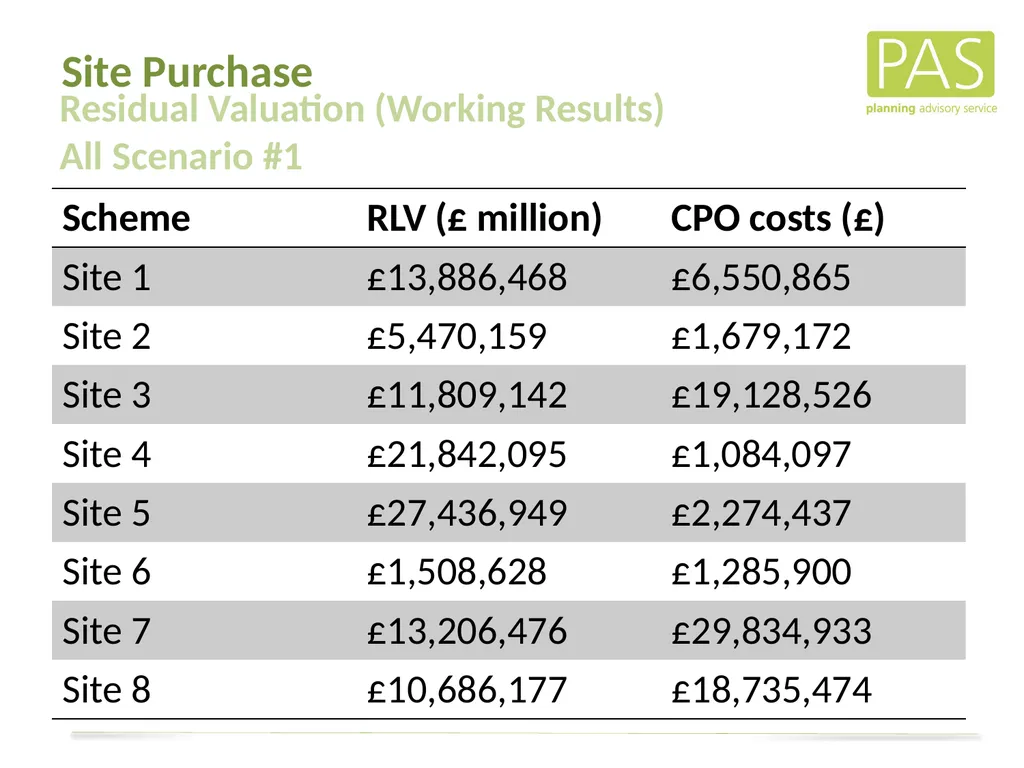
slide46. Site Purchase Residual Valuation (Working Results)
All Scenario #1<br>
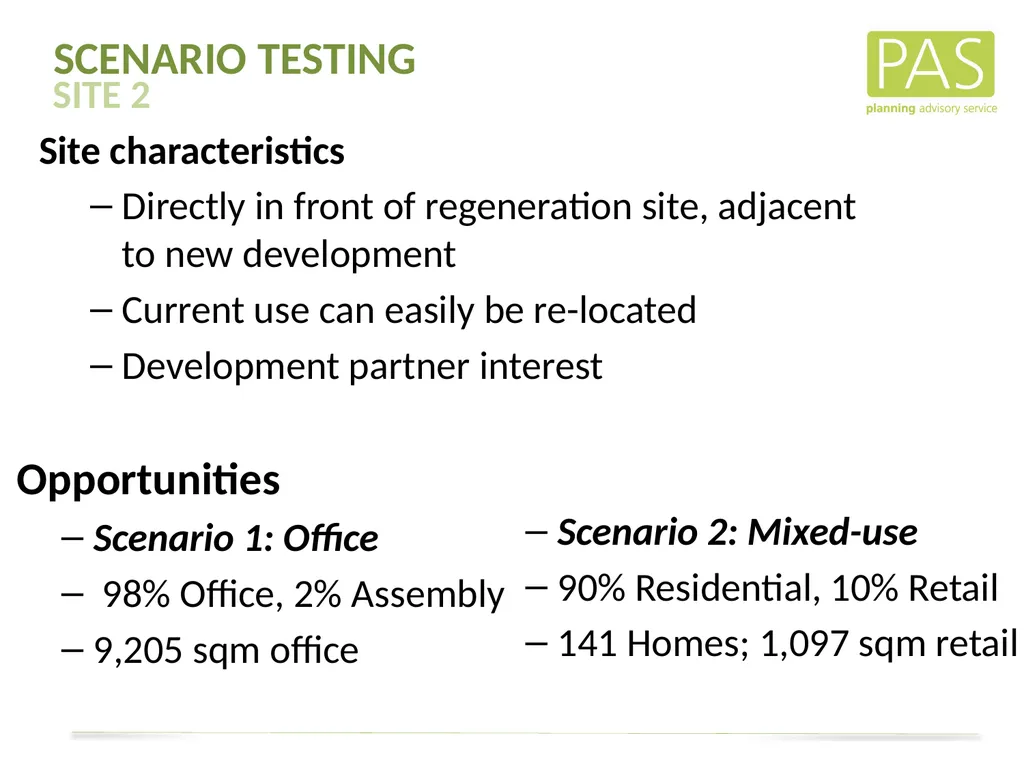
slide47. SITE 2 SCENARIO TESTING Site characteristics
Directly in front of regeneration site, adjacent to new development
Current use can easily be re-located
Development partner interest Opportunities
Scenario 1: Office
98% Office, 2% Assembly
9,205 sqm office Scenario 2: Mixed-use
90% Residential, 10% Retail
141 Homes; 1,097 sqm retail<br>
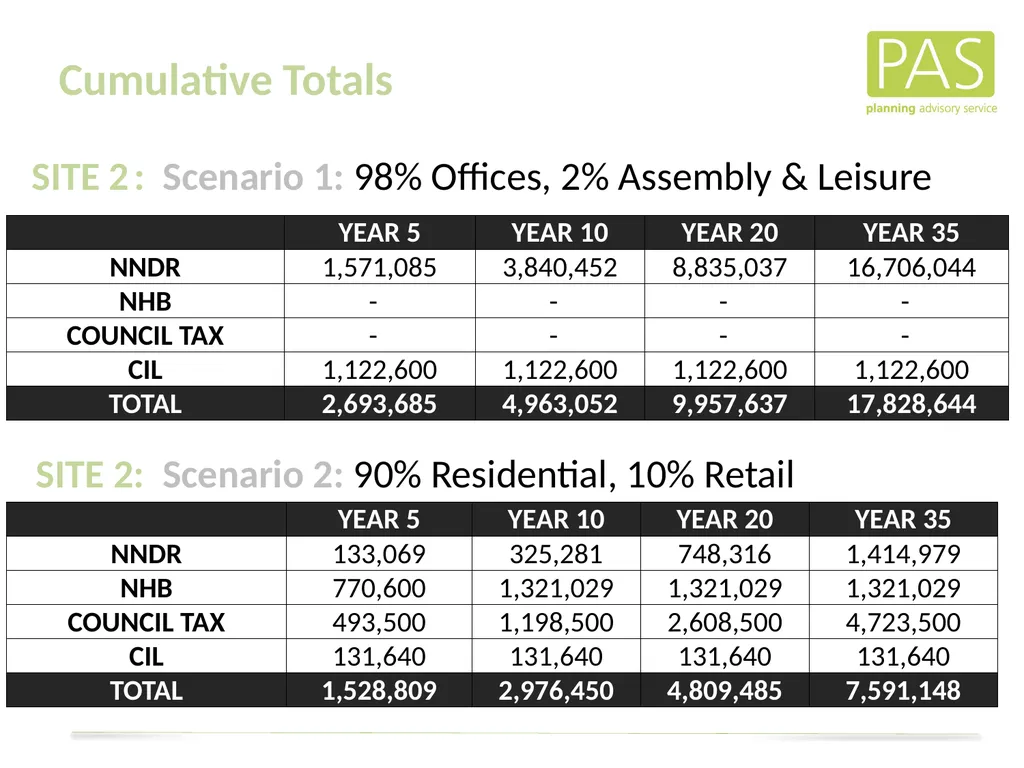
slide48. SCENARIO TESTING Finance Cumulative Totals SITE 2 : Scenario 1: 98% Offices, 2% Assembly & Leisure SITE 2: Scenario 2: 90% Residential, 10% Retail<br>
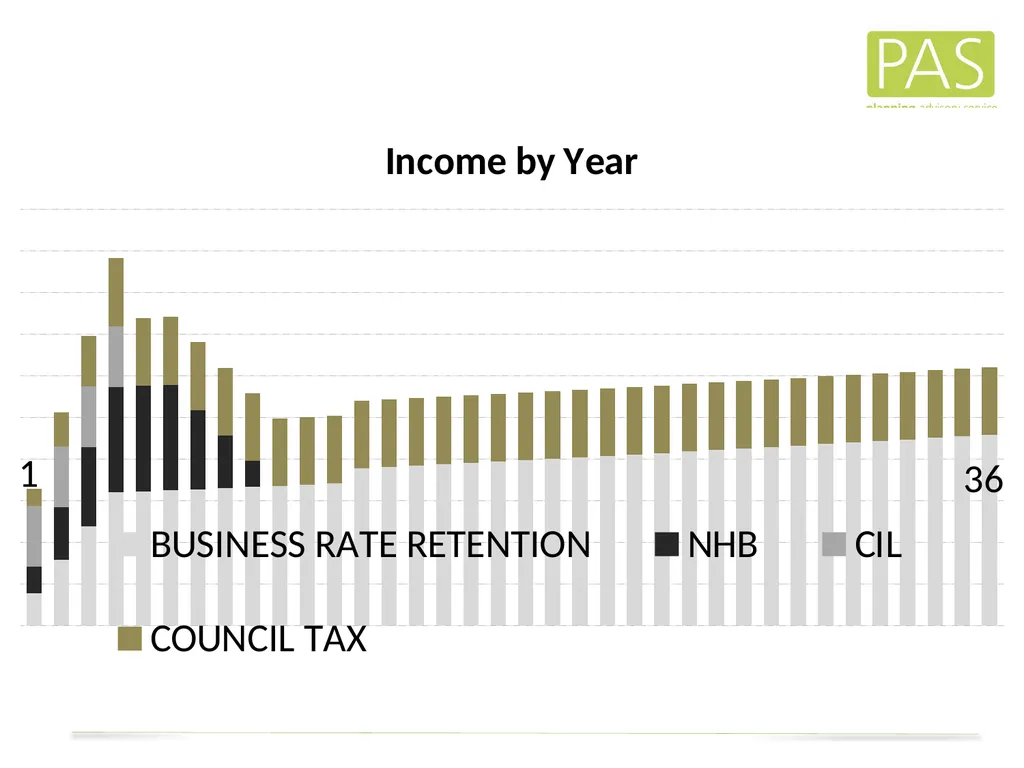
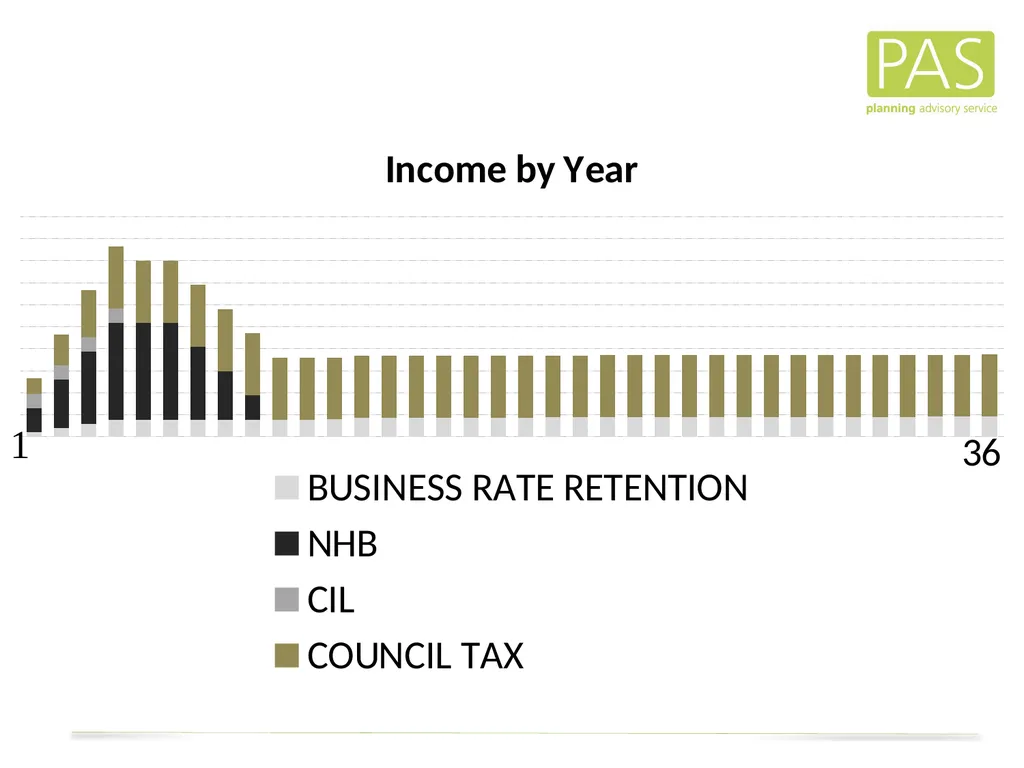
slide49. 1 36<br>
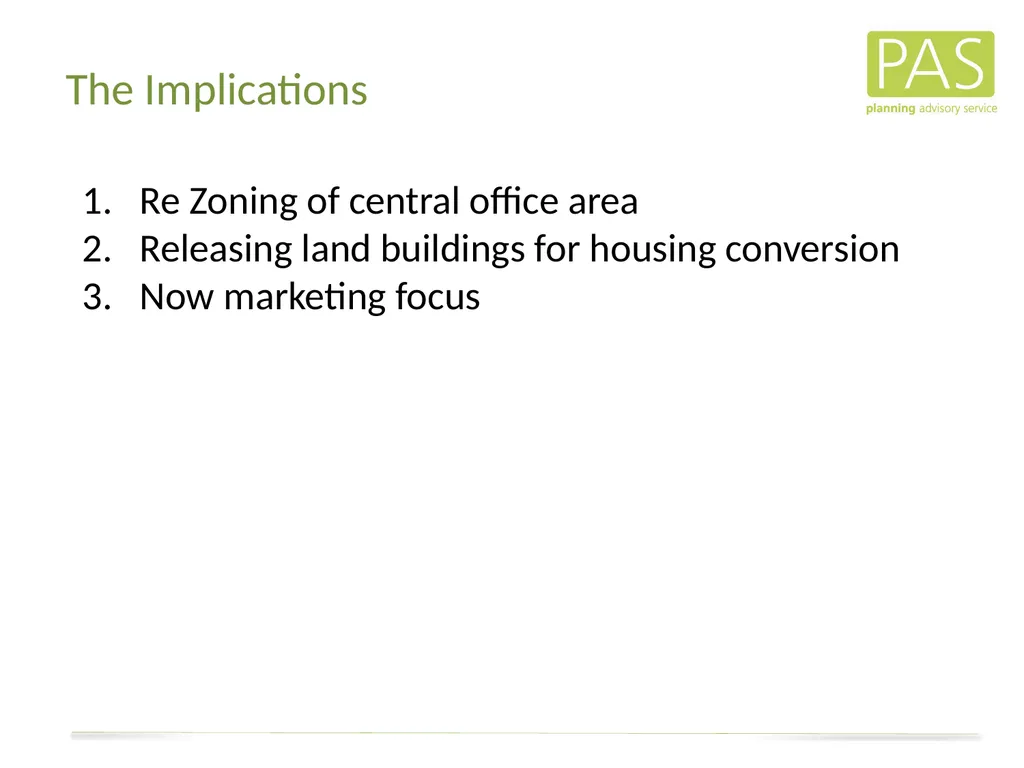
slide51. Re Zoning of central office area
Releasing land buildings for housing conversion
Now marketing focus The Implications<br>
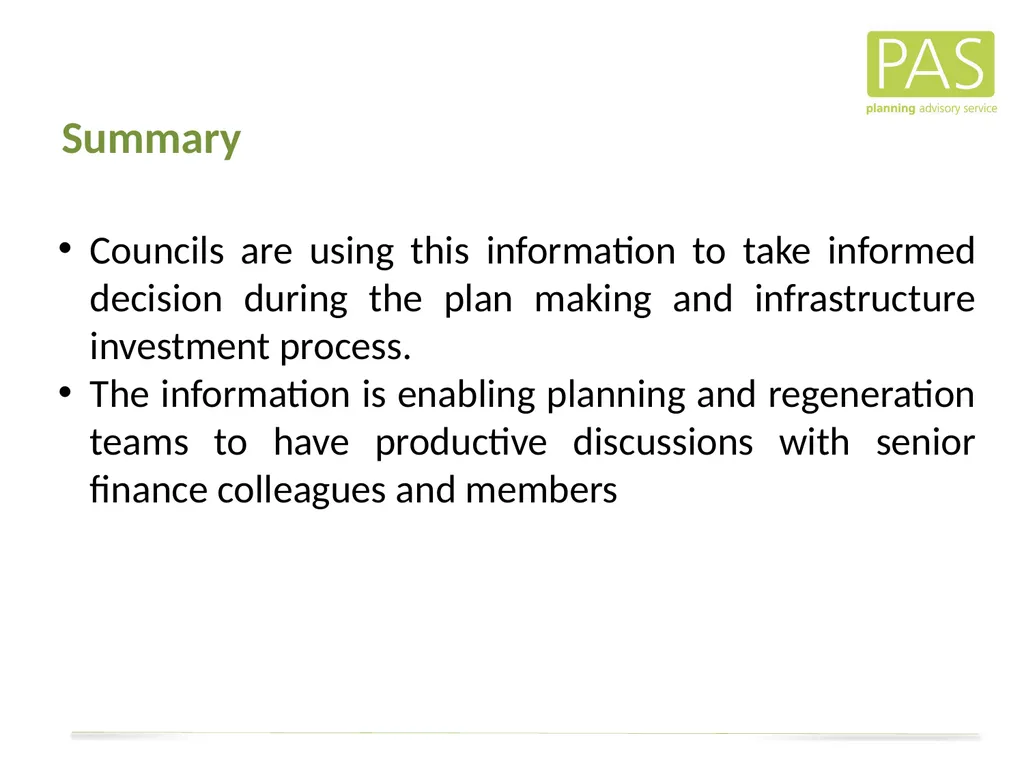
slide52. Councils are using this information to take informed decision during the plan making and infrastructure investment process.
The information is enabling planning and regeneration teams to have productive discussions with senior finance colleagues and members Summary<br>
slide53. www. pas.gov.uk End<br>
CIL Knowledge<br>
slide2. Introduction<br>
slide3. Long term Strategic Planning
Carefully calculated needs assessments
Business Cases
Options appraisal
Building political consensus
Delivery routes
Working with private providers 2. Opportunism &<br>
slide6. THE COMMUNITY INFRASTRUCTURE LEVY<br>
slide8. Business Rates collected + Business Rates – Why promote growth? Before… NNDR Funding level Local share level Allocated to local authority<br>
slide9. Business Rates collected + Business Rates – Why promote growth? Now… NNDR Funding level Local share level Allocated to local authority +<br>
slide11. How to Model the Financial Benefits of Planning & Growth<br>
slide12. Community Infrastructure Levy (CIL) Net additional floor space in square metres CIL Rate Set by the Council; Charging Schedule will determine rates by use Payable CIL<br>
slide13. 3 key points to remember:
CIL is a one-off payment, payable by the developer at the beginning of a development (following planning permission).
Replacement floor space & affordable housing do not pay CIL.
Planning obligations cannot be collected to pay for items in the Reg 123 list Community Infrastructure Levy<br>
slide14. Example
3,000 sqm of new retail floorspace
X £100 per sqm (your CIL rate for retail)
= £300,000 CIL!
Development & CIL Community Infrastructure Levy<br>
slide15. New Homes Bonus (NHB) Number of homes Private:£1,444 2013/14 National Average Band D Council Tax Rate Affordable:£1,794 + £350 supplement 6<br>
slide16. 3 key points to remember:
New Homes Bonus payable from Central Government to a Council is calculated based on net increases to the Council Tax base;
New Homes Bonus is an un-ringfenced funding stream;
NHB is paid for six consecutive years. New Homes Bonus<br>
slide17. Example
a) 100 units of market housing x £1444 x 6 (years)
b) 100 units of affordable housing x £1794 x 6 (years)
(a) + (b) = £1.73m Total NHB
Development & NHB New Homes Bonus<br>
slide18. Business Rates – how they’re calculated Total Rateable value of property is £100k 0.471
NNDR MULTIPLIER Payable Business Rates = £47.1k<br>
slide19. Business Rates Retention (NNDR) Proportion to Central Government Payable Business Rates (RV*0.471) Proportion to Upper Tier authority % retained by Local Authority<br>
slide20. 3 key points to remember:
Different uses get different Rateable Values (RV). RVs are set by the Valuation Office Agency, and are reviewed every 5 years.
Business Rates are an un-ringfenced, on-going funding stream, and are payable annually;
Housing does not pay business rates. Business Rates Retention<br>
slide21. Example – London Borough
1) £100,000 x 0.471 = £47,100 Payable Business Rates
2) £47,100 – 50% = £23,550 “Local Share”
3a) £23,550 x 40% = £9,420 Paid to upper tier
3b) £23,550 x 60% = £14,130 Retained by Local Authority
Development & NNDR Business Rates Retention<br>
slide22. Financial benefits over time<br>
slide23. Finance as a Material Consideration in Planning Decision<br>
slide24. e.g.
Plan policies
Previous appeal decisions
Case law
Loss of sunlight / overshadowing
Capacity of physical infrastructure What is a Material Consideration<br>
slide25. When should a ‘local finance consideration’ be taken into account as a material planning consideration?
Whether or not a ‘local finance consideration’ is material to a particular decision will depend on whether it could help to make the development acceptable in planning terms.<br>
slide26. Example 1 City in South West UK
Master Plan Delivery Programming<br>
slide27. Ten strategic sites; unviable without intervention
Future prospects of main city as regional growth centre under threat
Outlying housing sites capable of subsidising city
Needed to understand medium to long term planning and financial options The Scenario<br>
slide28. Income from Growth – by type<br>
slide29. Clear understanding of cash flow
Informed decisions on release of assets
Use of asset receipts to ease cash flow
Influenced CIL rate setting
Informed successful funding applications The Implications<br>
slide30. Example 2 Local Authority in Urban Growth Area 1:
Strategic Infrastructure Investment<br>
slide31. Desire to use infrastructure investment to drive development growth
Immature approach to capital prioritisation
No major strategic infrastructure priorities The scenario<br>
slide32. Income from Growth – by type Total of £416m<br>
slide33. Income from Growth – by type<br>
slide34. Income from Growth – by type<br>
slide35. Business Case for each infrastructure item
Prioritised programme of infrastructure investment
Basis for setting capital investment programme & single regeneration fund The Implications<br>
slide36. Example 3 Urban Growth Area 2
Medium Term Financial Planning<br>
slide37. 8 major regeneration areas
In process of major outsourcing
Information sought to inform infrastructure investment priorities The scenario<br>
slide38. CIL & New Homes Bonus Area4 9% Area3 Area2 Area7 Area6 Area5 Area1<br>
slide39. Business Rates Retention & Council Tax Area4 Area3 Area2 Area5 Area7 Area6 Area1 Area8<br>
slide40. A significant proportion of collected Council Tax will be used for payment of increased cost of services.
When Council Tax and NNDR income streams are separated, a single large shopping centre shown to provide 97 per cent of all NNDR retained income. Business Rates Retention & Council Tax<br>
slide41. Informed a departmental outsourcing deal
Informed negotiations with Government on major infrastructure investment
Re-prioritised housing estate investment programme The Implications<br>
slide42. Example 4 Local Authority in Urban Growth Area 3
Informing Public Sector Interventions<br>
slide43. Site-specific assessments
Detailed assessment of ROI from any site-specific interventions, including the cashable impact on wider public financing and regeneration
Site residual valuations
public finance sources, such as NHB, CIL, Business Rate Retention, etc?
implementation planning
Where, when and how is Council intervention likely to have the biggest impact? The Approach<br>
slide44. Site Selection
Probability of development
History of planning applications
Cost of intervention
Delivery/site constraints and issues, such as land ownership, existing lease arrangements, etc.
Impacts - blight effect on town centre
Potential to have windfall benefits from adjacent development, i.e. gateway site
Potential regeneration impact
Financial return on investment from intervention SITE FOR INTERVENTION FINDINGS<br>
slide45. FINDINGS STRATEGIC SITE OPPORTUNITIES<br>
slide46. Site Purchase Residual Valuation (Working Results)
All Scenario #1<br>
slide47. SITE 2 SCENARIO TESTING Site characteristics
Directly in front of regeneration site, adjacent to new development
Current use can easily be re-located
Development partner interest Opportunities
Scenario 1: Office
98% Office, 2% Assembly
9,205 sqm office Scenario 2: Mixed-use
90% Residential, 10% Retail
141 Homes; 1,097 sqm retail<br>
slide48. SCENARIO TESTING Finance Cumulative Totals SITE 2 : Scenario 1: 98% Offices, 2% Assembly & Leisure SITE 2: Scenario 2: 90% Residential, 10% Retail<br>
slide49. 1 36<br>
slide51. Re Zoning of central office area
Releasing land buildings for housing conversion
Now marketing focus The Implications<br>
slide52. Councils are using this information to take informed decision during the plan making and infrastructure investment process.
The information is enabling planning and regeneration teams to have productive discussions with senior finance colleagues and members Summary<br>
slide53. www. pas.gov.uk End<br>