Yuqing Yang CS548 Showcase Prof. Carolina Ruiz Visualizing Association Rules in Groceries 1 Hahsler M, Chelluboina S. Visualizing Association Rules: Introduction to the R-extension Package arulesVizJ. R project module, 2011. 2 Wong P
"Yuqing Yang CS548 Showcase Prof. Carolina Ruiz" is the property of its rightful owner. Permission is granted to
download and print the materials on this website for personal, non-commercial use only, and to display it
on your personal computer provided you do not modify the materials and that you retain all copyright
notices contained in the materials. By downloading content from our website, you accept the terms of this
agreement.
Presentation Transcript
01
Yuqing Yang
CS548 Showcase Prof. Carolina Ruiz Visualizing Association Rules in Groceries<br>
02
[1] Hahsler M, Chelluboina S. Visualizing Association Rules: Introduction to the R-extension Package arulesViz[J]. R project module, 2011.
[2] Wong P C, Whitney P, Thomas J. Visualizing association rules for text mining[C]//Information Visualization, 1999.(Info Vis' 99) Proceedings. 1999 IEEE Symposium on. IEEE, 1999: 120-123, 152.
[3] Ertek, Gürdal, and Ayhan Demiriz. "A framework for visualizing association mining results." Computer and Information Sciences–ISCIS 2006. Springer Berlin Heidelberg, 2006. 593-602.
[4] Hofmann, Heike, Arno PJM Siebes, and Adalbert FX Wilhelm. "Visualizing association rules with interactive mosaic plots." Proceedings of the sixth ACM SIGKDD international conference on Knowledge discovery and data mining. ACM, 2000.
[5] Jeffrey Heer, Stuart K. Card, James Landay (2005). "Prefuse: a toolkit for interactive information visualization". In: ACM Human Factors in Computing Systems CHI 2005. 4/29/2014 2 References<br>
03
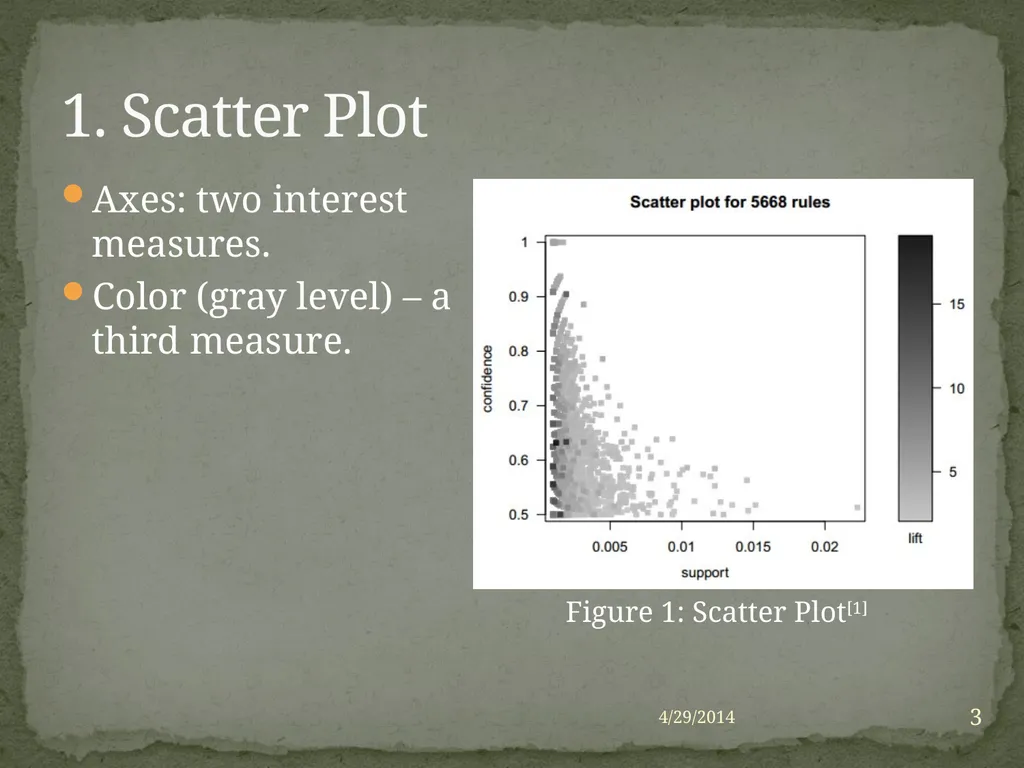
Axes: two interest measures.
Color (gray level) – a third measure. 4/29/2014 3 1. Scatter Plot Figure 1: Scatter Plot[1]<br>
04
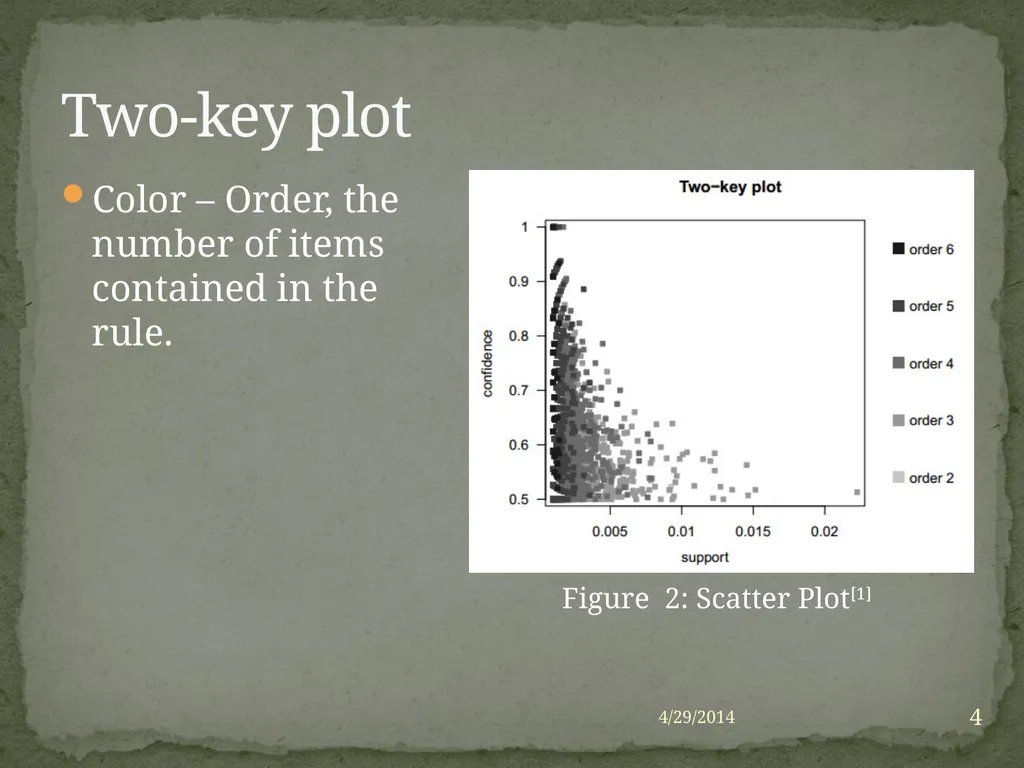
Color – Order, the number of items contained in the rule. 4/29/2014 4 Two-key plot Figure 2: Scatter Plot[1]<br>
05
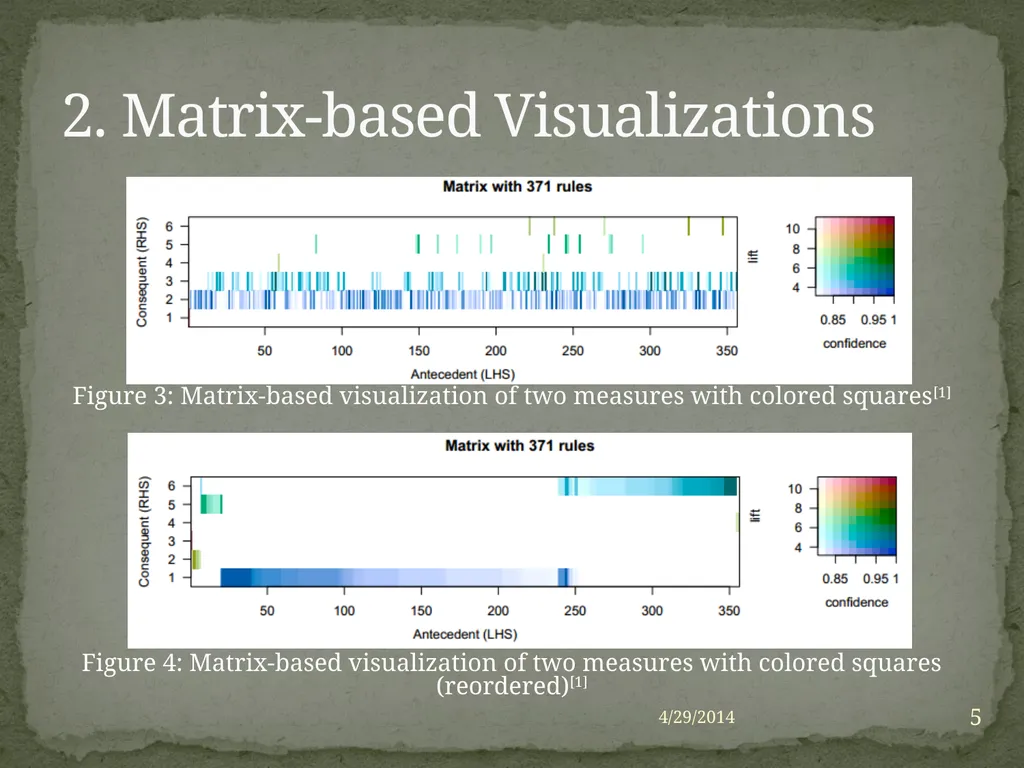
4/29/2014 5 2. Matrix-based Visualizations Figure 3: Matrix-based visualization of two measures with colored squares[1] Figure 4: Matrix-based visualization of two measures with colored squares (reordered)[1]<br>
06
4/29/2014 6 Matrix-based Visualizations<br>
07
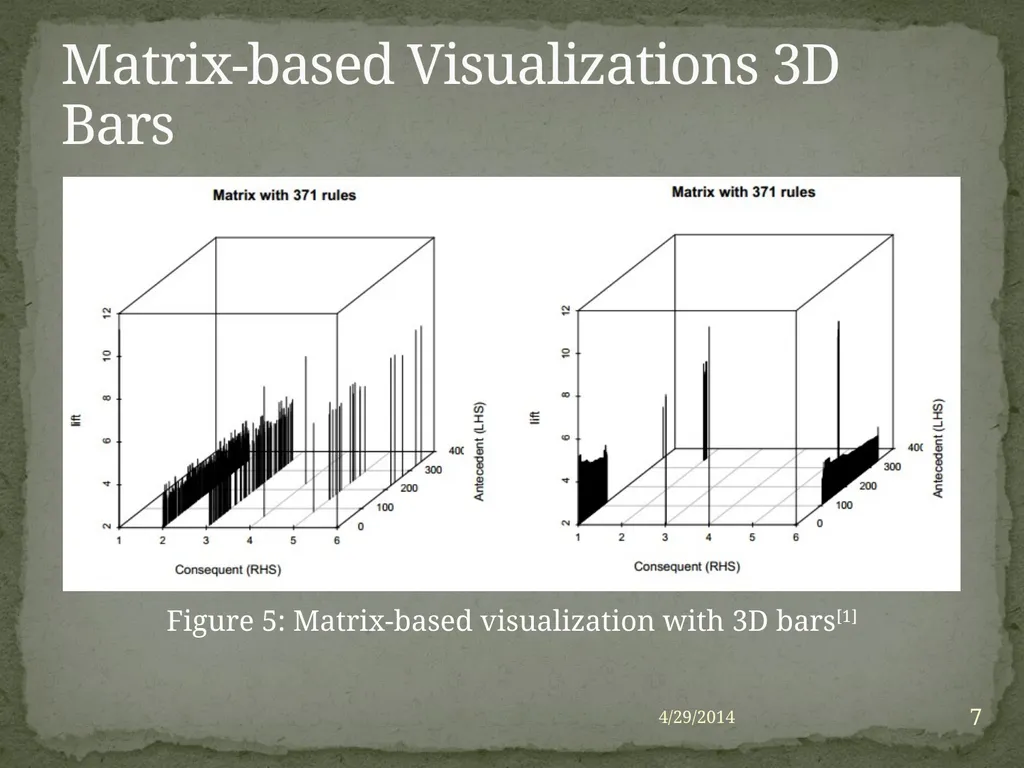
4/29/2014 7 Matrix-based Visualizations 3D Bars Figure 5: Matrix-based visualization with 3D bars[1]<br>
08
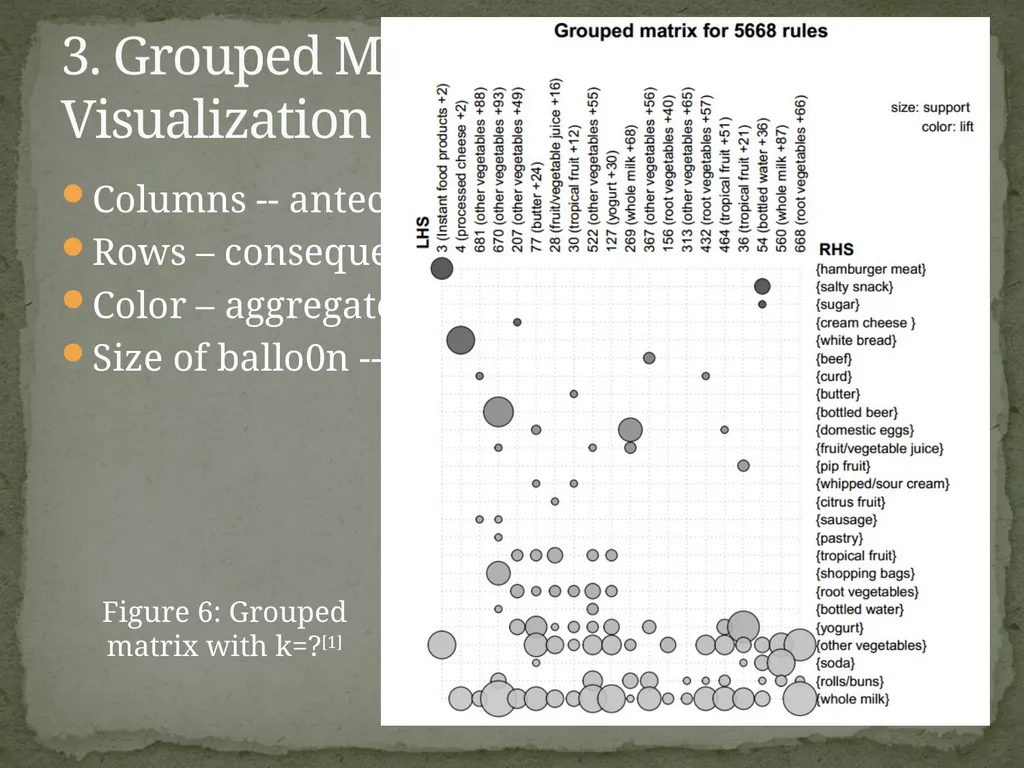
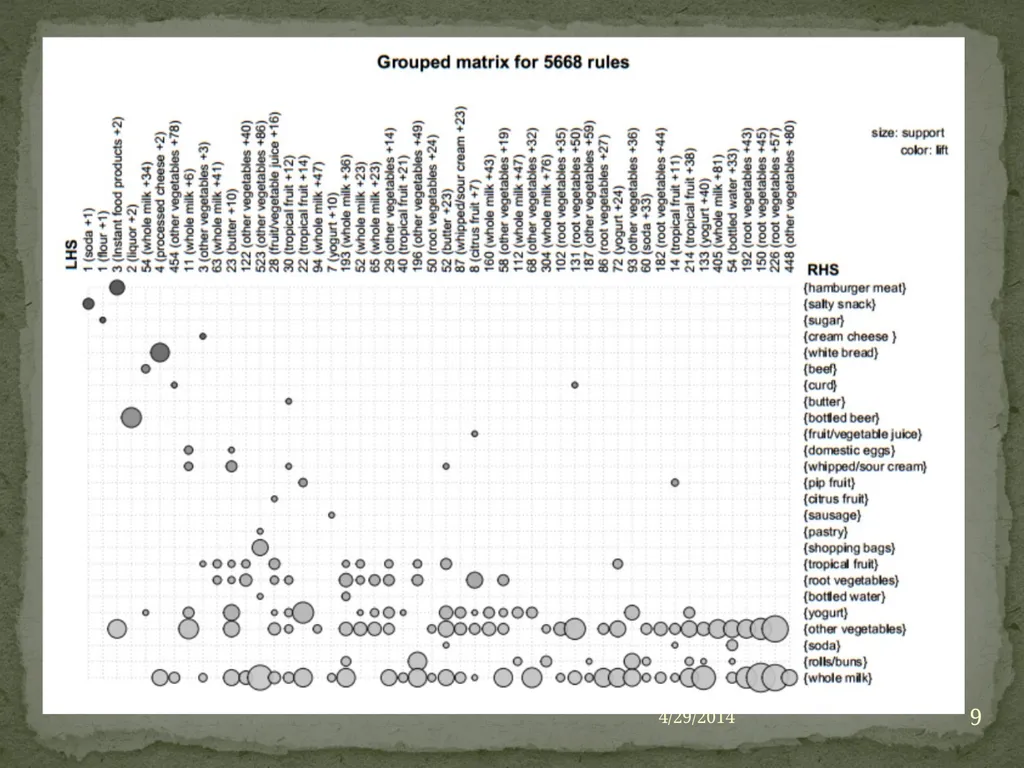
Columns -- antecedent groups
Rows – consequents
Color – aggregated interest measure
Size of ballo0n -- aggregated support 4/29/2014 8 3. Grouped Matrix-based Visualization Figure 6: Grouped matrix with k=?[1]<br>
09
4/29/2014 9<br>
10
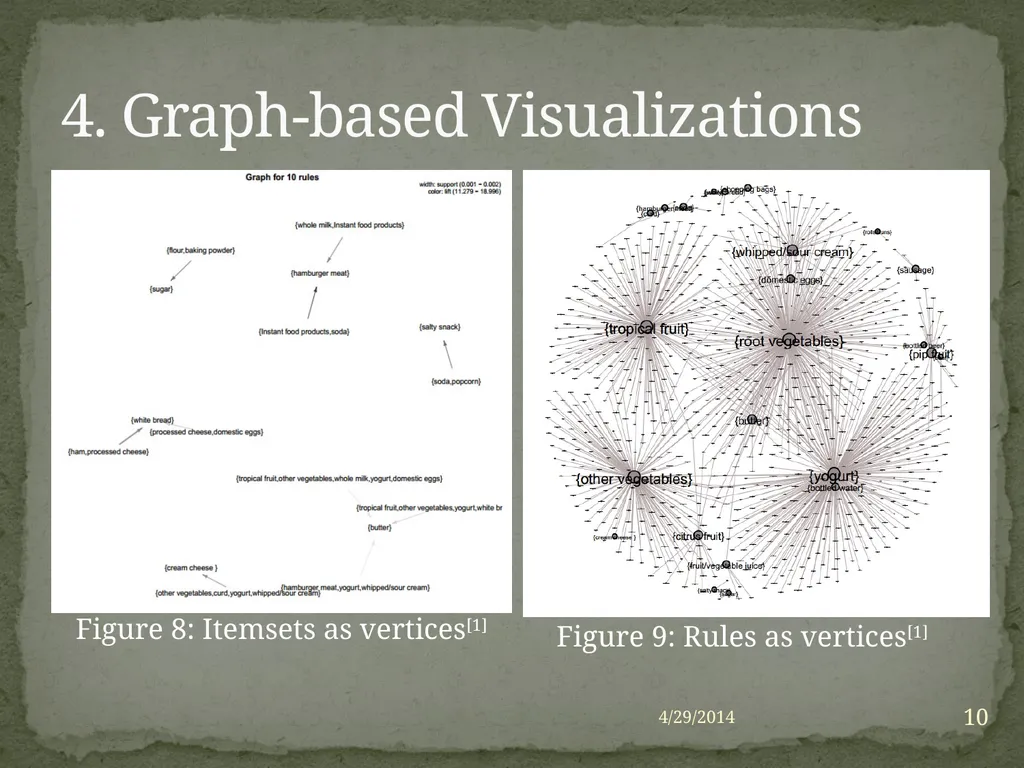
4/29/2014 10 4. Graph-based Visualizations Figure 8: Itemsets as vertices[1] Figure 9: Rules as vertices[1]<br>
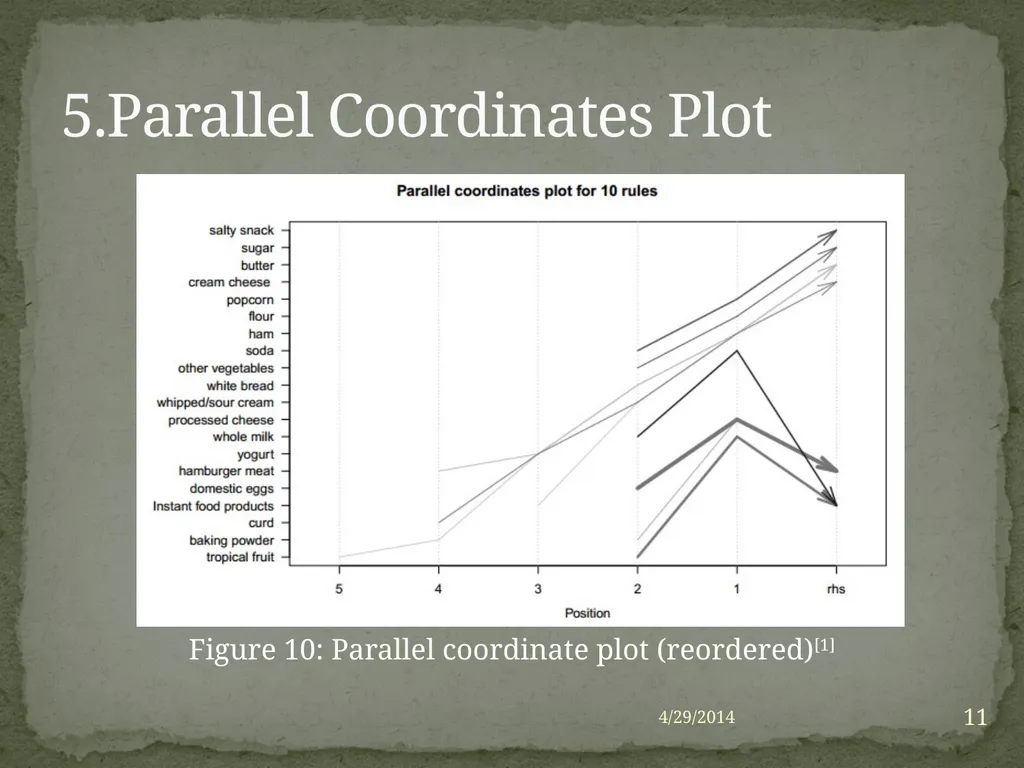
To visualize multidimensional data.
X-axis -- the positions in a rule,
i.e., first item, second item, etc.
Head of arrow -- points to the consequent item.
The width of the arrows -- support
The intensity of the color -- confidence. Parallel Coordinates Plot 4/29/2014 12<br>
13
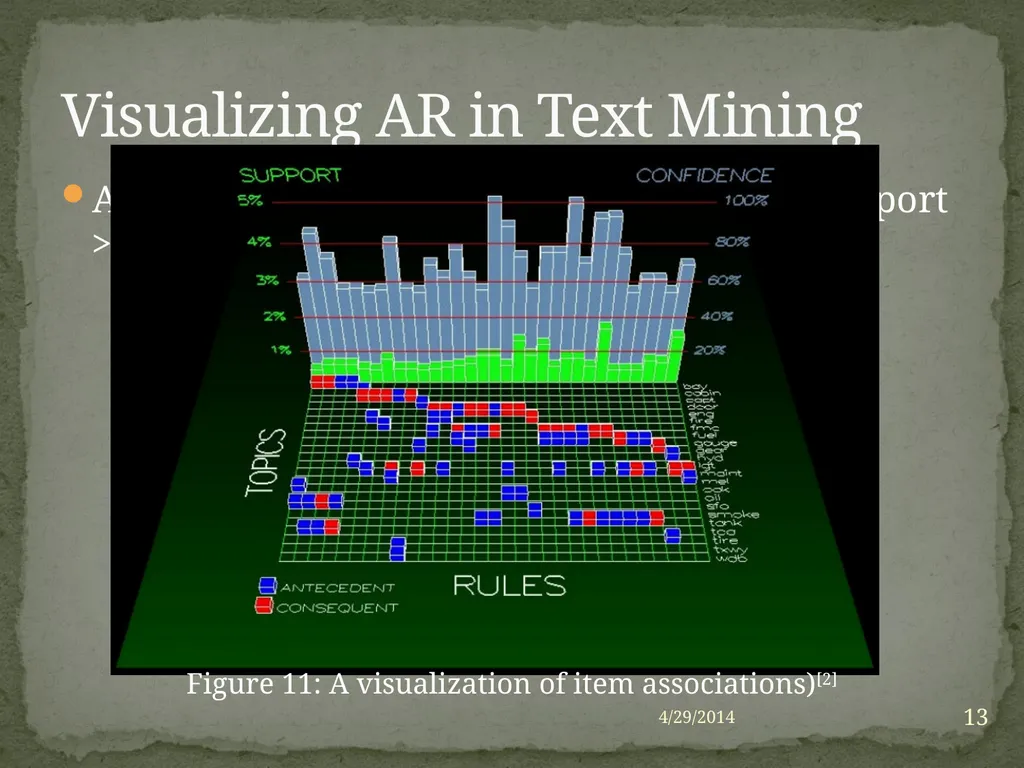
A visualization of item associations with support > 0.4% and confidence > 50%. 4/29/2014 13 Visualizing AR in Text Mining Figure 11: A visualization of item associations)[2]<br>
14
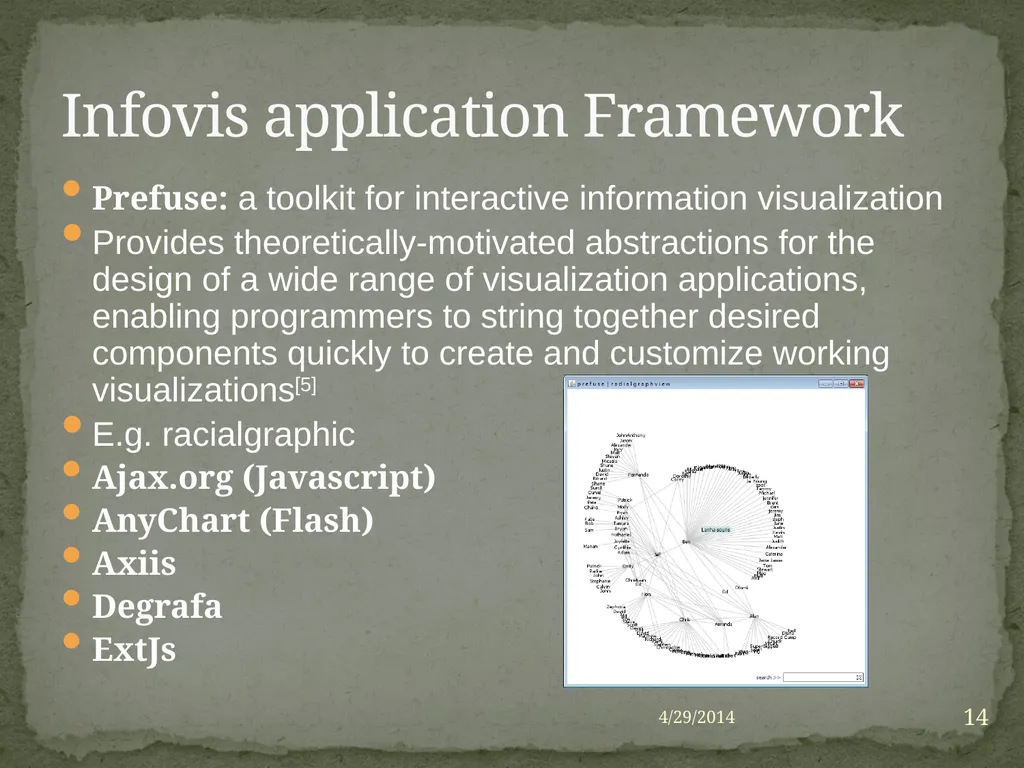
Prefuse: a toolkit for interactive information visualization
Provides theoretically-motivated abstractions for the design of a wide range of visualization applications, enabling programmers to string together desired components quickly to create and customize working visualizations[5]
E.g. racialgraphic
Ajax.org (Javascript)
AnyChart (Flash)
Axiis
Degrafa
ExtJs 4/29/2014 14 Infovis application Framework<br>