/
Model N included in model Model N included in model

Model N included in model - PowerPoint Presentation

wang
wang . @wang
Follow
65 views
Uploaded On 2023-10-28

Model N included in model - PPT Presentation

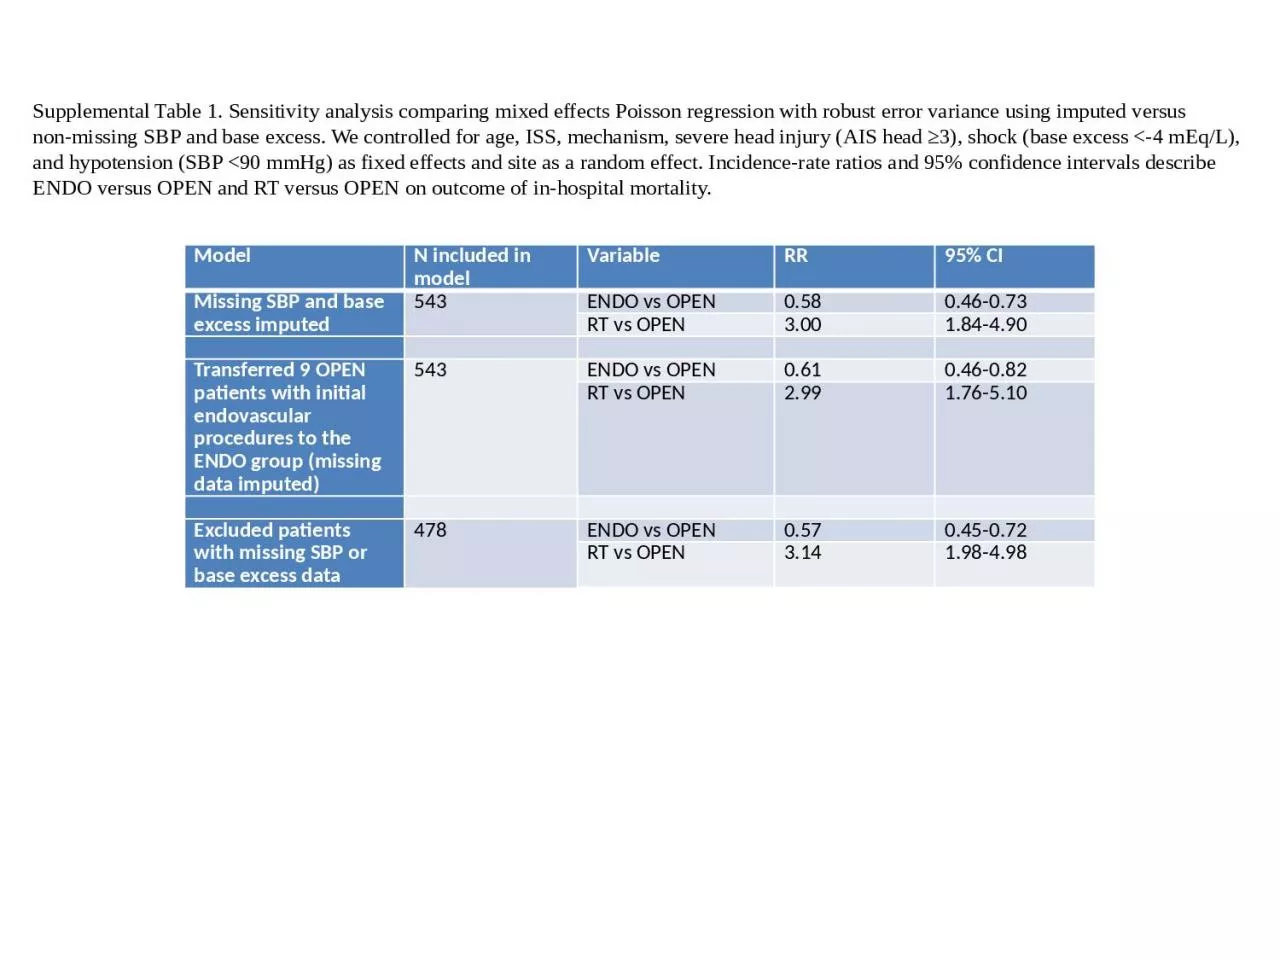
Variable RR 95 CI Missing SBP and base excess imputed 543 ENDO vs OPEN 058 046073 RT vs OPEN 300 184490           Transferred 9 OPEN patients with initial endovascular procedures to the ENDO group missing data imputed ID: 1026207

data figure simulated fig figure data fig simulated residuals supplemental deviance suppl excess base sbp missing imputed patients model

Share:

Link:

Embed:

Download Presentation from below link

Download Presentation The PPT/PDF document "Model N included in model" is the property of its rightful owner. Permission is granted to download and print the materials on this web site for personal, non-commercial use only, and to display it on your personal computer provided you do not modify the materials and that you retain all copyright notices contained in the materials. By downloading content from our website, you accept the terms of this agreement.


Presentation Transcript

1. ModelN included in modelVariableRR95% CIMissing SBP and base excess imputed543ENDO vs OPEN0.580.46-0.73RT vs OPEN3.001.84-4.90     Transferred 9 OPEN patients with initial endovascular procedures to the ENDO group (missing data imputed)543ENDO vs OPEN0.610.46-0.82RT vs OPEN2.991.76-5.10     Excluded patients with missing SBP or base excess data478ENDO vs OPEN0.570.45-0.72RT vs OPEN3.141.98-4.98Supplemental Table 1. Sensitivity analysis comparing mixed effects Poisson regression with robust error variance using imputed versus non-missing SBP and base excess. We controlled for age, ISS, mechanism, severe head injury (AIS head ≥3), shock (base excess <-4 mEq/L), and hypotension (SBP <90 mmHg) as fixed effects and site as a random effect. Incidence-rate ratios and 95% confidence intervals describe ENDO versus OPEN and RT versus OPEN on outcome of in-hospital mortality.

2. Suppl Fig 1

3. Suppl Fig 2

4. Suppl Fig 3

5. Suppl Fig 4

6. Suppl Fig 5

7. Suppl Fig 6

8. Suppl Fig 7

9. Suppl Fig 8

10. Suppl Fig 9

11. Suppl Fig 10

12. Supplemental Figure 1. Deviance residuals versus predicted for the overall model with imputed missing SBP and base excess data (n=543).Supplemental Figure 2. Actual (black) versus simulated deviance residuals (grey, n=20) using simulated data generated by the model in Figure 1.Supplemental Figure 3. Deviance residuals versus predicted for patients without BTAI with imputed missing SBP and base excess data (n=488).Supplemental Figure 4. Actual (black) versus simulated deviance residuals (grey, n=20) using simulated data generated by the model in Figure 3.Supplemental Figure 5. Deviance residuals versus predicted for patients with chest NCTH with imputed missing SBP and base excess data (n=137).Supplemental Figure 6. Actual (black) versus simulated deviance residuals (grey, n=20) using simulated data generated by the model in Figure 5.Supplemental Figure 7. Deviance residuals versus predicted for patients with abdomen NCTH with imputed missing SBP and base excess data (n=225).Supplemental Figure 8. Actual (black) versus simulated deviance residuals (grey, n=20) using simulated data generated by the model in Figure 7.Supplemental Figure 9. Deviance residuals versus predicted for patients with pelvis NCTH with imputed missing SBP and base excess data (n=167).Supplemental Figure 10. Actual (black) versus simulated deviance residuals (grey, n=20) using simulated data generated by the model in Figure 9.